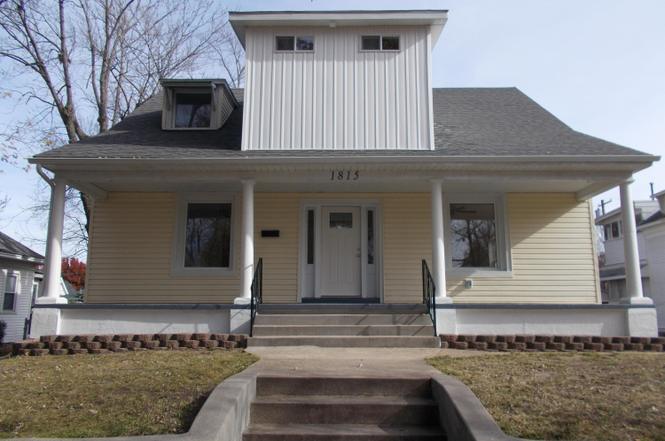
1815 S Picher Ave · Joplin, MO
Flood risk 1/10 · Minimal
- FEMA flood zone
- X (unshaded)
- Chance of flooding over 30 yrs
- 0.0%
- Est. flood insurance / yr
- $473 – $860
Fire risk 2/10 · Minimal
- Est. fire insurance / yr
- $1,054 – $1,958
Heat risk 5/10 · Moderate
- Hot days now (above 107°F)
- 7 days/yr
- Hot days in 30 yrs
- 20 days/yr
Wind risk 2/10 · Minimal
- Chance of severe wind over 30 yrs
- 2.0%
Air-quality risk 2/10 · Minimal
- Unhealthy air days now
- 1 days/yr
- Unhealthy air days in 30 yrs
- 1 days/yr
Risk factors via First Street. Map © Google.
Why this score? — see what drove the D grade
The composite is a weighted blend of 9 inputs, each scored 0–100. Each bar is that input's sub-score; the figure is the points it added to the 100-point composite (weight × sub-score).
- Cash flow +14.7/30.0
- ARV discount +7.5/15.0
- Rent growth +5.0/5.0
- DSCR +4.5/10.0
- Livability +3.2/5.0
- 1% rule +2.9/10.0
- Schools +2.9/10.0
- Condition / age +2.5/5.0
- Appreciation +0.0/10.0
$194,900
🖨 Deal sheet (PDF) 📄 Offer letter ✓ Due diligence
Listing remarks
Fully remodeled and city inspected three bedroom, two and a half bath home in Joplin Missouri. This home features over 1600 sq ft of living space on the first and second floor along with 800 sq ft in the full basement. So many updates in this home including: paint, flooring, electrical, plumbing, HVAC, appliances, kitchen cabinets and so much more. Large backyard with oversized deck and two car carport are a plus with this home. Close to schools, shopping, dining and easy access to the city. Call for your showing today!
Key facts
- Garbage disposal
- Remodeled kitchen
- Full basement
Tags
Property features AI
Exterior
- Parking: 2-car detached carport; Carport (2 spaces)
- Security: Smoke detectors
- Utilities: Public sewer
- Home design: Single-family residence; Residential property; Single-family freestanding
- Construction: Vinyl siding; Block foundation; Rolled/Hot Mop roof; Shingle roof; Built area above grade: 1,628
- Exterior features: Covered patio/porch; Deck; Front porch; Chain link and wood fencing; Level lot
Interior
- Kitchen: Electric range; Refrigerator; Dishwasher; Garbage disposal
- Flooring: Carpet; Vinyl
- Bathrooms: 2 full bathrooms; 1 half bathroom
- Heating & cooling: Central heating; Electric heating; Ceiling fan cooling
- Interior features: Ceiling fans; Walk-in closets; Full basement
Neighborhood map
What this means for you Summary
Snapshot
- This is a 3-bed/2.5-bath other listed at $195k.
Deal economics
- At list price, monthly cash flow is $51 ($610/yr) — positive.
- The deal already cash-flows at list — no discount required.
- To meet the 1% rule (rent ≥ 1% of price), the offer needs to be $153k (21.2% below list).
- Recommended offer: $153k (21.2% below list) — sets the bar for 1% rule.
- Cap rate 6.6% vs local median 5.1% in Joplin — meaningfully above typical; check what's discounted (condition, days-on-market, listing class) to confirm the premium yield is real.
Location & tenants
- Location reads 64/100 on livability (#318 in MO) — a middle-class / working-renter tenant base. Strengths: cost of living A+, housing A+; Watch: crime F, amenities F, commute F.
- Joplin Schools (urban): math 30% / reading 39% proficiency, ranked #231 of 324 in MO (top 71%) — families likely to look elsewhere, expect single-tenant / working-renter base with shorter leases.
- Zoned schools: Cecil Floyd Elem. (math 28% / reading 33%, grade F, #806 of 1,115 statewide, top 72%, 497 students, 66% FRL); North Middle (math 26% / reading 35%, grade F, #283 of 391 statewide, top 74%, 517 students, 65% FRL); Joplin High (math 32% / reading 46%, grade F, #287 of 521 statewide, top 55%, 2,233 students, 50% FRL).
- Market conditions: Rents rising fast (+15.7%/yr); 355 active listings in the ZIP; 13 comparable units currently listed for rent nearby; rentals at typical pace (median 23d on market — plan ~3-4 weeks tenant-placement turnaround); 602 units permitted in Jasper County in 2024 (0 in 5+ unit buildings).
Forward outlook
- Local home prices are declining (-3.0%/yr); year-one equity from $1k of loan paydown is wiped out by about $6k of value loss. Plan a longer hold.
Negotiation context
- It's been on market 99 days — a 9% lower offer ($177k) is reasonable based on typical stale-listing flexibility.
- 2 sale attempts; this cycle's ask has dropped $15k (7%) from the opening price — seller is motivated, your offer sets the floor, not the list.
Risks & watch-outs
- Watch-outs: built in 1930 — expect roof / HVAC / electrical / plumbing capex.
- Climate carrying-cost: extreme-heat days projected 7→20/yr by 2055 (HVAC capex compounding) — expect insurance premiums to compound above CPI over the hold.
Questions for the listing agent
- It's been on market 99 days. Have you received any prior offers? Is the seller open to a 21% concession, seller financing, or rate buy-down credit?
- Built in 1930 — when were the roof, HVAC, electrical panel, plumbing, and water heater last replaced?
- Why hasn't it sold? Are there any deal-killer items the seller is aware of (foundation, flood, title, zoning, code violations)?
- Is there a deadline driving the sale (1031 exchange, divorce, estate, relocation)? That informs how much negotiation room exists.
- Schools are D-rated, which usually means shorter tenancies and higher turnover. Who's the typical renter profile here, and what's been the actual vacancy rate?
- Crime grade is F in this area — have there been break-ins, vandalism, or insurance claims at this property in the last 3 years? What carrier currently insures it and at what premium?
- The area grade is low — what's the realistic commute time and amenity access for the typical tenant pool here? Any planned neighborhood developments (good or bad) we should know about?
- What's the average days-on-market for RENTAL listings here right now (not sales)? A rising rental-DOM trend means longer vacancies and softer asking-rent achievability than the comps imply.
- What's the recent tenant-quality profile in this submarket — average credit score on applications, eviction rate, late-payment / NSF rate, and stable-employment percentage? A property-management company in the area should have these aggregated.
- How much new for-sale + rental construction is in the pipeline within 1–3 miles? Heavy new supply typically softens prices + rents 12–24 months out; constrained supply supports both.
Investment metrics
- 1% rule
- 0.79% ✗
- Cap rate
- 6.61%
- Cash-on-cash
- 1.12%
- DSCR
- 1.05
- GRM
- 10.6
CMA / ARV
No comps found within radius.
Projected returns pro-forma
-3.0% appreciation · 8.0% rent growth · sell at horizon
- IRR
- -9.8%
- Equity multiple
- 0.63×
- Total profit
- $-20,322
- Equity at exit
- $29,060
- IRR
- 4.8%
- Equity multiple
- 1.42×
- Total profit
- $23,025
- Equity at exit
- $16,851
Cash invested: $54,572 (down + closing). Projections, not guarantees.
Landlord ↔ Tenant lean methodology
- Overall (STATE)
- 81 Strongly Landlord-Friendly
- State Missouri
- 81 Strongly Landlord-Friendly · R+10
- County
- — inherits STATE
- City
- — inherits STATE
ZIP-level market 64804
- Rents YoY
- 15.7%
- Active inventory
- 355
- Price-to-rent
- 10.6×
Monthly cashflow live
- Estimated rent
- $1,535 high interval (Pro) →
- Mortgage (P&I)
- −$1,022
- Tax from tax record
- −$58 /mo · $701/yr
- Insurance
- −$81
- HOA
- −$0
- Vacancy / Maint / Mgmt
- −$322
- Net cashflow
- $51
Break-even live
Sensitivity live
| Price | -10% $161 | -5% $106 | +0% $51 | +5% $-4 | +10% $-59 |
|---|---|---|---|---|---|
| Rent | -10% $-70 | -5% $-10 | +0% $51 | +5% $111 | +10% $172 |
| Rate | -1.0pp $149 | -0.5pp $100 | base $51 | +0.5pp $0 | +1.0pp $-51 |
UW: 25.0% down · 7.5% · 30yr · 1.5% tax · 5.0% vac · 8.0% maint · 8.0% mgmt
Financing live
Cash to close
- Down payment
- $48,725
- Closing costs
- $5,847
- Reserves months
- —
- Total cash needed
- —
Loan-product check · same deal, 3 products live
Conventional
25% down · 7.5% · 30yr
- Down + closing
- —
- Monthly P&I
- —
- Monthly cashflow
- —
- DSCR
- —
- Eligible?
- —
Personal DTI + credit; lowest rate.
DSCR
20% down · 8.5% · 30yr
- Down + closing
- —
- Monthly P&I
- —
- Monthly cashflow
- —
- DSCR
- —
- Eligible?
- —
No personal income docs; deal must DSCR.
Hard money
10% down · 12.0% · 12mo
- Down + closing
- —
- Monthly P&I
- —
- Monthly cashflow
- —
- DSCR
- —
- Eligible?
- —
Short-term bridge; refi at stabilization.
Rent comps 13 comps
| Address | Beds | Baths | Sqft | Rent | $/sqft | DOM | Units | Dist |
|---|---|---|---|---|---|---|---|---|
| 2012 S Connor Ave Joplin, MO | 3.0 | 2.0 | 1379 | $1,595 | $1.16 | 23d | 1 | 0.24mi |
| 623 W Junge Blvd Joplin, MO | 3.0 | 2.0 | 1217 | $1,500 | $1.23 | 23d | 1 | 0.46mi |
| 2226 S Moffet Ave Joplin, MO | 4.0 | 2.0 | 1818 | $1,600 | $0.88 | 23d | 1 | 0.51mi |
| 2201 S Pearl Ave Joplin, MO | 3.0 | 2.0 | 1487 | $1,475 | $0.99 | 23d | 1 | 0.59mi |
| 2602 S Moffet Ave Joplin, MO | 3.0 | 2.0 | 1214 | $1,300 | $1.07 | 23d | 1 | 0.74mi |
| 1806 Pennsylvania Ave Joplin, MO | 3.0 | 1.0 | 1295 | $1,050 | $0.81 | 23d | 1 | 0.77mi |
| 2521 S Tyler Ave Joplin, MO | 3.0 | 2.0 | 1500 | $1,700 | $1.13 | 23d | 1 | 0.87mi |
| 2002 W 11th St Joplin, MO | 3.0 | 1.0 | 1200 | $1,200 | $1.00 | 23d | 1 | 0.92mi |
| 2515 S Willard Ave Joplin, MO | 3.0 | 2.0 | 1500 | $1,600 | $1.07 | 23d | 1 | 0.97mi |
| 2517 Ohio Ave Joplin, MO | 3.0 | 2.0 | 1503 | $1,695 | $1.13 | 23d | 1 | 1.30mi |
| 120 /122 S Pearl Ave #122 Joplin, MO | 3.0 | 2.0 | 1200 | $1,250 | $1.04 | 23d | 1 | 1.34mi |
| 306 N Connor Ave Joplin, MO | 2.0 | 1.0 | 1072 | $1,000 | $0.93 | 23d | 1 | 1.49mi |
| 101 N Main Street Rd Unit 1806 Joplin, MO | 3.0 | 2.0 | 1386 | $1,300 | $0.94 | 23d | 1 | 1.50mi |
Listing history 9 events
-
2026-05-06status Pending
-
2026-04-28price $194,900
-
2026-04-10price $197,900
-
2026-04-02status Active
-
2026-03-26status Pending
-
2026-03-10price $199,900
-
2026-01-21$209,500 Active
-
2025-12-12price $224,900
-
1996-05-21soldstatus
ⓘ Source: listings_history table (triggers on properties + properties_extension) + one-shot
backfill from property_details.listing_events for pre-trigger history.
Tax reassessment forecast MO · Resets to sale price
- Current annual tax
- $701 · $58/mo
- Projected year-2 tax
- $1,891 · $158/mo
- Expected delta
- +$1,190/yr (+$99/mo · 169.8%)
ⓘ Screening estimate from a state-policy table — verify with the county assessor before closing.
Climate risk First Street
- Flood 1/10 Low FEMA zone X (unshaded) · 0% chance over 30 yrs
- Wildfire 2/10 Low
- Heat 5/10 Major 7 d/yr ≥107°F today · 20 d/yr by 30 yrs out
- Wind 2/10 Low 2% chance of damaging wind over 30 yrs
- Air quality 2/10 Low 1 unhealthy d/yr today · 1 by 30 yrs out
Nearby sold comps map
Loading sold comps map…
Walkable amenities ~0.75 mi
Loading nearby amenities…
Taxation est. · year 1
- Rental income
- $18,418
- − Mortgage interest
- −$10,917
- − Property taxes
- −$701
- − Insurance
- −$974
- − Repairs & maintenance
- −$1,473
- − Management
- −$1,473
- − Depreciation
- −$5,670
- Taxable loss
- −$2,791
- Est. tax savings @ 24.0%
- +$670
- After-tax cash flow
- $1,280/yr
For passive investors: Depreciation is non-cash, so a rental often shows a tax loss while cash-flowing — sheltering income. Rental losses are passive: they offset passive income freely, and up to $25,000/yr can offset ordinary (W-2) income if you actively participate and your MAGI is under $100k (phasing out to $0 by $150k); unused losses carry forward. On sale, claimed depreciation is recaptured at up to 25%, and gains may owe capital-gains tax (a 1031 exchange can defer both). Figures are a year-1 estimate at your 24.0% rate — not tax advice; consult a CPA.
Schools (NCES district)
- District
- Joplin Schools
- NCES district ID
- 2916350
- Math proficiency
- 30% ▼ -3.00%
- Reading proficiency
- 39% ▼ -3.00%
- Median HH income
- $38,648
- Composite
- 28.82/100
- National rank
- #6657
- State rank
- #231 of 324 in MO
Livability — Joplin
- Score
- 64/100
- State rank
- #318
- US rank
- #14578
Category grades
Schools grade is shown separately in the Schools card above.
Census & demographics
- Census place
- Joplin, MO
- County
- Newton County · 37,016 people
- City population
- 73,303
- Metro
- Joplin, MO
- Population (ZIP)
- 37,016
- Household income
- $62,574
- Rent vs Own
- Severe rent burden
- 1082.0
Population outlook (Jasper County) Hauer SSP2
- Today (2025)
- 120,033 people
- By 2030
- 120,091 · +0.0%
- By 2040
- 119,297 · -0.6%
- By 2050
- 117,705 · -1.9%
- By 2075
- 110,402 · -8.0%
- By 2100
- 99,719 · -16.9%
Race, ethnicity, and origin ACS 2023
- Neighborhood character
- Predominantly White (84%)
- Race & ethnicity
- White 84% Two or more races 9% Hispanic / Latino 6% Black 2% Asian 2%
- Hispanic origin (detail)
- Mexican 3%
- Common ancestry
- Slovak 3% Italian 2% Lithuanian 2%
- Foreign-born
- 3% · Canada, Vietnam
- Languages at home
- 96% English-only · Spanish 1% Other Indo-European 1% Vietnamese 1%
Political lean MEDSL · Jasper
- 2024 margin
- Solid R (+46.8) · D 25.9% · R 72.7% · Other 1.4%
- 2008→2024 swing
- -13.6pp toward R · 2008: -33.2pp · 2024: -46.8pp
- All cycles
- 2024: R+46.8 2020: R+46.2 2016: R+50.8 2012: R+41.0 2008: R+33.2
Not yet ingested
- Civics
- —
Market trends
- HPI YoY
- ▼ -204.80%
- Current HPI
- 279.4471
- Rent YoY
- ▲ 15.66%
- Metro
- Joplin, MO
- State GDP YoY
- ▲ 1.84%
- F500 in state
- 20
Industry mix (Fortune 500 HQ in MO)
| Industry | F500 HQs | Revenue |
|---|---|---|
| Healthcare | 1 | $163B |
|
||
| Insurance | 1 | $21B |
|
||
| Industrial Technology | 1 | $17B |
|
||
| Retail | 1 | $16B |
|
||
| Industrial Distribution | 1 | $10B |
|
||
| Utilities | 1 | $9B |
|
||
Price history
-13.3% since first listed9 events — show timeline
- 2026-05-06 Pending — OGAR
- 2026-04-28 Price Changed $194,900 OGAR
- 2026-04-10 Price Changed $197,900 OGAR
- 2026-04-02 Relisted — OGAR
- 2026-03-26 Pending — OGAR
- 2026-03-10 Price Changed $199,900 OGAR
- 2026-01-21 Listed $209,500 OGAR
- 2025-12-12 Price Changed $224,900 OGAR
- 1996-05-21 Sold (Public Records) — Public Records
Property tax history
+1.6%/yrLatest (2025): $701 · +12.7% YoY. Source: county tax records.
Cash-flow waterfall
monthlySold comps — $/sqft
last 12 mo · ≤1 miLoading sold comps…