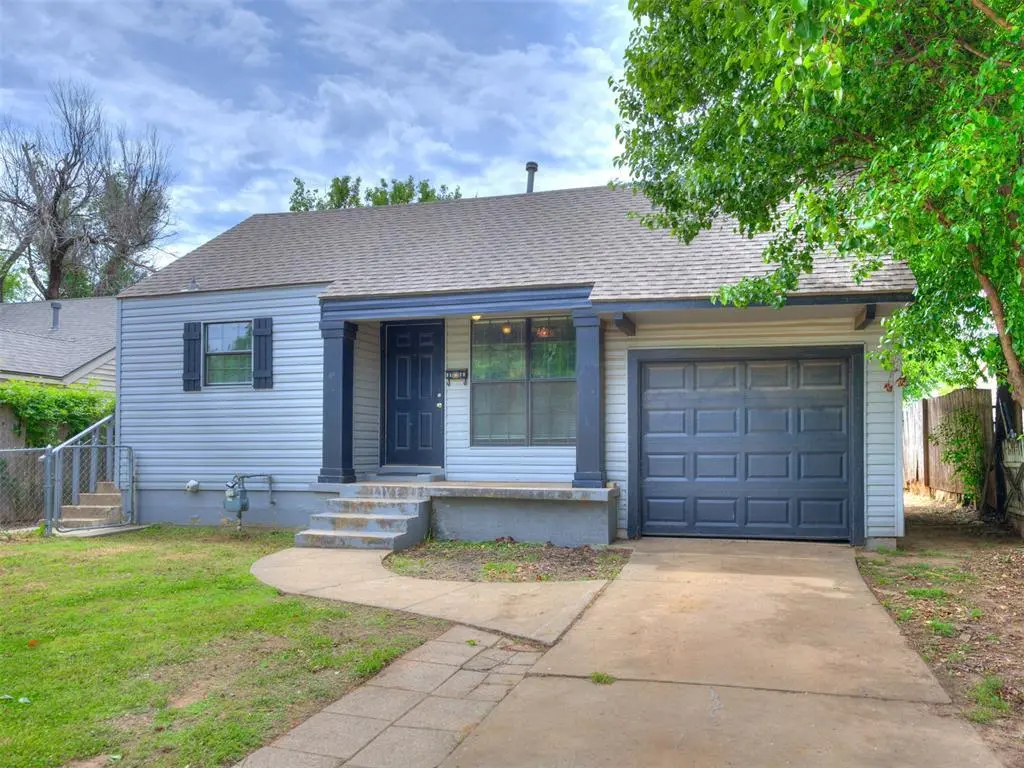
3112 NW 28th St · Oklahoma City, OK
Flood risk 1/10 · Minimal
- FEMA flood zone
- X (unshaded)
- Chance of flooding over 30 yrs
- 0.0%
- Est. flood insurance / yr
- $507 – $1,088
Fire risk 1/10 · Minimal
- Est. fire insurance / yr
- $2,463 – $4,575
Heat risk 6/10 · Moderate
- Hot days now (above 107°F)
- 7 days/yr
- Hot days in 30 yrs
- 19 days/yr
Wind risk 2/10 · Minimal
- Chance of severe wind over 30 yrs
- 3.0%
Air-quality risk 2/10 · Minimal
- Unhealthy air days now
- 1 days/yr
- Unhealthy air days in 30 yrs
- 2 days/yr
Risk factors via First Street. Map © Google.
Why this score? — see what drove the D grade
The composite is a weighted blend of 9 inputs, each scored 0–100. Each bar is that input's sub-score; the figure is the points it added to the 100-point composite (weight × sub-score).
- Cash flow +12.9/30.0
- ARV discount +10.4/15.0
- Rent growth +4.3/5.0
- Livability +4.0/5.0
- DSCR +3.9/10.0
- 1% rule +3.3/10.0
- Condition / age +2.5/5.0
- Schools +0.7/10.0
- Appreciation +0.0/10.0
$130,000
🖨 Deal sheet 📄 Offer letter ✓ Due diligence
Listing remarks MLS
Cute centrally located house with 2 bedrooms and one bath. MOVE IN READY with updates throughout. New Vinyl Siding, New Thermal Pane Windows, New Hot-water Tank, New Granite Counter tops, New Washer and Dryer, and the list goes on. Schedule your showing today!
Key facts
- 6 minutes from ocu
- Large backyard
- 7,000 sq ft lot
Tags
Property features AI
Finance
- Other: Living area listed as 852 (assessor)
- Financial info: Not assumable
- HOA & community: No mandatory association dues
Exterior
- Parking: 1-car garage
- Home design: Single family residence; One-level property; Existing property; Located in Ingleside To Okla City addition
- Construction: Frame construction; Composition roof; Conventional foundation; Built (existing)
- Exterior features: No notable exterior features listed; Lot described as 'Other'
Interior
- Bedrooms: 2 bedrooms
- Bathrooms: 1 full bathroom
- Heating & cooling: Electric heating
- Interior features: One living area; Mock fireplace
Neighborhood map
What this means for you Summary
Snapshot
- This is a 2-bed/1.0-bath single-family listed at $130k.
Deal economics
- At list price, monthly cash flow is $-10 ($-114/yr) — negative.
- To cash-flow at today's rent, offer at most $128k (1.3% below list).
- To meet the 1% rule (rent ≥ 1% of price), the offer needs to be $108k (16.7% below list).
- Recommended offer: $108k (16.7% below list) — sets the bar for 1% rule.
- Cap rate 6.2% vs local median 3.7% in Oklahoma City — top-decile yield for the area; either an underpriced asset or a hidden risk that comps aren't pricing in. Stress-test before assuming the spread holds.
Location & tenants
- Location reads 80/100 on livability (#3 in OK, #1,635 nationally) — a professional / high-income tenant draw. Strengths: amenities A+, commute A+, cost of living A+; Watch: crime F.
- Oklahoma City (urban): math 7% / reading 10% proficiency, ranked #254 of 270 in OK (top 94%) — low school quality limits family demand, transient renter base, plan for 1-2y turnover; 82% free/reduced lunch — lower-income household profile, screen leases tightly.
- Zoned schools: Kaiser Es (math 8% / reading 8%, grade F, #741 of 845 statewide, top 89%, 530 students, 0% FRL); Northwest Classen Hs (math 5% / reading 10%, grade F, #420 of 447 statewide, top 95%, 1,702 students, 0% FRL) — zoned schools average 0% FRL vs 82% district-wide (82 pts lower); this property's tenant base skews higher-income than the district average.
- Market conditions: Rents rising fast (+7.3%/yr); 216 active listings in the ZIP; 40 comparable units currently listed for rent nearby; rentals at typical pace (median 17d on market — plan ~3-4 weeks tenant-placement turnaround); 5,365 units permitted in Oklahoma County in 2024 (569 in 5+ unit buildings).
Forward outlook
- Local home prices are declining (-3.0%/yr); year-one equity from $899 of loan paydown is wiped out by about $4k of value loss. Plan a longer hold.
- Oklahoma County population projected at +41% by 2050 — long-run rental-demand tailwind backs the buy-and-hold thesis.
Negotiation context
- It's been on market 48 days — a 3% lower offer ($126k) is reasonable based on typical stale-listing flexibility.
- 3 sale attempts since 6y ago with the ask held roughly flat each time — persistent listings suggest the price (not the market) is what's stuck; bring a comps-based counter.
- Current owner paid $97k; 34% above their basis — modest negotiation headroom, anchor on the comps not their cost.
Risks & watch-outs
- Watch-outs: built in 1942 — expect roof / HVAC / electrical / plumbing capex.
- Climate carrying-cost: extreme-heat days projected 7→19/yr by 2055 (HVAC capex compounding) — expect insurance premiums to compound above CPI over the hold.
Questions for the listing agent
- What do current leases actually rent for vs. the listed asking? Can we see a recent rent roll and the last 12 months of T-12 income?
- It's been on market 48 days. Have you received any prior offers? Is the seller open to a 17% concession, seller financing, or rate buy-down credit?
- Built in 1942 — when were the roof, HVAC, electrical panel, plumbing, and water heater last replaced?
- Is there a deadline driving the sale (1031 exchange, divorce, estate, relocation)? That informs how much negotiation room exists.
- Schools are F-rated, which usually means shorter tenancies and higher turnover. Who's the typical renter profile here, and what's been the actual vacancy rate?
- Crime grade is F in this area — have there been break-ins, vandalism, or insurance claims at this property in the last 3 years? What carrier currently insures it and at what premium?
- The area grade is low — what's the realistic commute time and amenity access for the typical tenant pool here? Any planned neighborhood developments (good or bad) we should know about?
- What's the average days-on-market for RENTAL listings here right now (not sales)? A rising rental-DOM trend means longer vacancies and softer asking-rent achievability than the comps imply.
- What's the recent tenant-quality profile in this submarket — average credit score on applications, eviction rate, late-payment / NSF rate, and stable-employment percentage? A property-management company in the area should have these aggregated.
- How much new for-sale + rental construction is in the pipeline within 1–3 miles? Heavy new supply typically softens prices + rents 12–24 months out; constrained supply supports both.
Investment metrics
- 1% rule
- 0.83% ✗
- Cap rate
- 6.20%
- Cash-on-cash
- -0.31%
- DSCR
- 0.99
- GRM
- 10.0
CMA / ARV
- ARV (median comp)
- $139,081
- List price
- $130,000
- Delta
- -6.53%
- Verdict
- FAIR
- Comps
- 20 within 1.0 mi
Show comp detail 12 sales within ~0.75 mi
| Address | Dist | Beds/Ba | Sqft | Sold | Price | $/sf | Match |
|---|---|---|---|---|---|---|---|
| 3209 Cashion Pl | 0.24mi | 2/1.0 | 820 (-4%) | 3mo | $158,750 | $194 | 80 |
| 3029 NW 28 St | 0.09mi | 2/1.0 | 810 (-5%) | 11mo | $75,000 | $93 | 79 |
| 3025 Pioneer St | 0.10mi | 2/1.0 | 946 (+11%) | 11mo | $135,000 | $143 | 68 |
| 3012 NW NW 32nd St | 0.33mi | 3/1.0 (+1) | 890 (+4%) | 6mo | $65,000 | $73 | 67 |
| 3241 NW 33rd St | 0.42mi | 2/1.0 | 801 (-6%) | 4mo | $139,900 | $175 | 67 |
| 3029 NW 27th St | 0.13mi | 1/1.0 (-1) | 752 (-12%) | 4mo | $139,000 | $185 | 66 |
| 3105 NW 32nd St | 0.32mi | 2/1.0 | 801 (-6%) | 12mo | $143,497 | $179 | 66 |
| 3133 NW 31st St | 0.27mi | 3/1.0 (+1) | 796 (-7%) | 10mo | $112,500 | $141 | 64 |
| 3133 NW 33rd St | 0.37mi | 3/1.0 (+1) | 801 (-6%) | 13mo | $82,500 | $103 | 57 |
| 3411 NW 28th St | 0.36mi | 3/1.0 (+1) | 960 (+13%) | 2mo | $142,500 | $148 | 56 |
| 2645 NW 31st St | 0.62mi | 2/1.0 | 940 (+10%) | 6mo | $149,000 | $159 | 49 |
| 2641 NW 33rd St | 0.70mi | 2/1.0 | 952 (+12%) | 13mo | $160,000 | $168 | 37 |
Match score weights: distance 35% · size 25% · config 20% · recency 20%. Top-matched comps best support the ARV.
Projected returns pro-forma
-3.0% appreciation · 7.29% rent growth · sell at horizon
- IRR
- -12.3%
- Equity multiple
- 0.54×
- Total profit
- $-16,799
- Equity at exit
- $19,383
- IRR
- 2.1%
- Equity multiple
- 1.18×
- Total profit
- $6,445
- Equity at exit
- $11,240
Cash invested: $36,400 (down + closing). Projections, not guarantees.
Landlord ↔ Tenant lean methodology
- Overall (STATE)
- 83 Strongly Landlord-Friendly
- State Oklahoma
- 83 Strongly Landlord-Friendly · R+20
- County
- — inherits STATE
- City
- — inherits STATE
ZIP-level market 73107
- Rents YoY
- 7.3%
- Active inventory
- 216
- Price-to-rent
- 10.0×
Monthly cashflow live
- Estimated rent
- $1,083 high interval (Pro) →
- Mortgage (P&I)
- −$682
- Tax from tax record
- −$129 /mo · $1,553/yr
- Insurance
- −$54
- HOA
- −$0
- Vacancy / Maint / Mgmt
- −$227
- Net cashflow
- $-10
Break-even live
UW: 25.0% down · 7.5% · 30yr · 1.5% tax · 5.0% vac · 8.0% maint · 8.0% mgmt
Financing live
Cash to close
- Down payment
- $32,500
- Closing costs
- $3,900
- Reserves months
- —
- Total cash needed
- —
Loan-product check · same deal, 3 products live
Conventional
25% down · 7.5% · 30yr
- Down + closing
- —
- Monthly P&I
- —
- Monthly cashflow
- —
- DSCR
- —
- Eligible?
- —
Personal DTI + credit; lowest rate.
DSCR
20% down · 8.5% · 30yr
- Down + closing
- —
- Monthly P&I
- —
- Monthly cashflow
- —
- DSCR
- —
- Eligible?
- —
No personal income docs; deal must DSCR.
Hard money
10% down · 12.0% · 12mo
- Down + closing
- —
- Monthly P&I
- —
- Monthly cashflow
- —
- DSCR
- —
- Eligible?
- —
Short-term bridge; refi at stabilization.
Rent comps 40 comps
| Address | Beds | Baths | Sqft | Rent | $/sqft | DOM | Units | Dist |
|---|---|---|---|---|---|---|---|---|
| 3045 Pioneer St Oklahoma City, OK | 2.0 | 1.0 | 857 | $1,050 | $1.23 | 17d | 1 | 0.06mi |
| 3044 NW 28th St Oklahoma City, OK | 3.0 | 1.0 | 1030 | $1,150 | $1.12 | 2d | 1 | 0.07mi |
| 3228 NW 27th St Oklahoma City, OK | 2.0 | 1.0 | 1088 | $1,195 | $1.10 | 11d | 1 | 0.18mi |
| 2943 Pioneer Ave Unit 2943 Oklahoma City, OK | 1.0 | 1.0 | 643 | $895 | $1.39 | 3d | 1 | 0.19mi |
| 3000 NW 27th St Oklahoma City, OK | 2.0 | 1.0 | 967 | $1,095 | $1.13 | 11d | 1 | 0.20mi |
| 3000 NW 27th St Oklahoma City, OK | 2.0 | 1.0 | 967 | $1,095 | $1.13 | 4d | 1 | 0.20mi |
| 3112 Cashion Pl Oklahoma City, OK | 3.0 | 1.0 | 968 | $1,150 | $1.19 | 10d | 1 | 0.21mi |
| 2924 Pioneer St Oklahoma City, OK | 2.0 | 1.0 | 806 | $1,125 | $1.40 | 43d | 1 | 0.24mi |
| 3109 NW 23rd St Oklahoma City, OK | 2.0 | 1.0 | 1006 | $925 | $0.92 | 43d | 1 | 0.32mi |
| 3116 NW 32nd St Oklahoma City, OK | 2.0 | 1.0 | 720 | $950 | $1.32 | 4d | 1 | 0.32mi |
| 3141 NW 32nd St Oklahoma City, OK | 2.0 | 1.0 | 1010 | $1,025 | $1.01 | 21d | 1 | 0.35mi |
| 2932 NW 32nd St Oklahoma City, OK | 1.0 | 1.0 | 1000 | $695 | $0.69 | 43d | 1 | 0.41mi |
| 3003 NW 20th St Oklahoma City, OK | 2.0 | 1.0 | 909 | $999 | $1.10 | 43d | 1 | 0.58mi |
| 3033 N Grand Blvd Oklahoma City, OK | 1.0 | 1.0 | 672 | $675 | $1.00 | 2d | 1 | 0.59mi |
| 2748 NW 22nd St Oklahoma City, OK | 2.0 | 1.0 | 1066 | $1,500 | $1.41 | 2d | 1 | 0.67mi |
| 2854 NW 19th St Unit 2854 Oklahoma City, OK | 2.0 | 1.0 | 811 | $1,280 | $1.58 | 3d | 1 | 0.72mi |
| 3175 N Portland Ave Oklahoma City, OK | 1.0 | 1.0 | 700 | $834 | $1.19 | 14d | 1 | 0.76mi |
| 3175 N Portland Ave Oklahoma City, OK | 2.0 | 1.0 | 865 | $899 | $1.04 | 43d | 1 | 0.76mi |
| 3175 N Portland Ave Oklahoma City, OK | 2.0 | 2.0 | 918 | $960 | $1.05 | 23d | 1 | 0.76mi |
| 3175 N Portland Ave Oklahoma City, OK | 1.0–2.0 | 1.0–2.0 | 809 | $960 | $1.19 | 16d | 3 | 0.76mi |
| 3403 NW 17th St Unit B Oklahoma City, OK | 1.0 | 1.0 | 572 | $1,050 | $1.84 | 43d | 1 | 0.82mi |
| 3733 NW 22nd St Apt 210 Oklahoma City, OK | 2.0 | 1.0 | 850 | $950 | $1.12 | 43d | 1 | 0.87mi |
| 2400 NW 30th St Oklahoma City, OK | 1.0–2.0 | 1.0–2.0 | 801 | $1,279 | $1.60 | 2d | 11 | 0.87mi |
| 2400 NW 30th St Oklahoma City, OK | 2.0 | 2.0 | 1078 | $1,289 | $1.20 | 43d | 1 | 0.91mi |
| 3829 NW 26th St Oklahoma City, OK | 2.0 | 1.0 | 895 | $1,125 | $1.26 | 2d | 1 | 0.92mi |
| 3625 NW 18th St Oklahoma City, OK | 3.0 | 2.0 | 1040 | $1,500 | $1.44 | 43d | 1 | 0.94mi |
| 3205 NW 14th St Unit b Oklahoma City, OK | 1.0 | 1.0 | 613 | $850 | $1.39 | 4d | 1 | 0.95mi |
| 2502 NW 35th St Unit 3S Oklahoma City, OK | 1.0 | 1.0 | 600 | $750 | $1.25 | 23d | 1 | 0.96mi |
| 3024 NW 14th St Oklahoma City, OK | 2.0 | 1.0 | 924 | $895 | $0.97 | 16d | 1 | 0.98mi |
| 3221 NW 39th Ter Oklahoma City, OK | 3.0 | 1.0 | 1073 | $1,350 | $1.26 | 17d | 1 | 0.99mi |
| 2916 NW 14th St Oklahoma City, OK | 2.0 | 4.0 | 800 | $900 | $1.12 | 2d | 1 | 1.01mi |
| 3905 NW 23rd St Oklahoma City, OK | 2.0 | 1.5 | 1044 | $1,100 | $1.05 | 17d | 1 | 1.02mi |
| 3021 NW 13th St Oklahoma City, OK | 3.0 | 1.0 | 1072 | $995 | $0.93 | 23d | 1 | 1.02mi |
| 3608 NW 16th St Oklahoma City, OK | 2.0 | 1.0 | 784 | $950 | $1.21 | 43d | 1 | 1.03mi |
| 3800 NW 19th St Oklahoma City, OK | 3.0 | 1.0 | 1073 | $1,250 | $1.16 | 23d | 1 | 1.04mi |
| 3224 NW 13th St Oklahoma City, OK | 2.0 | 1.0 | 640 | $900 | $1.41 | 14d | 1 | 1.04mi |
| 2946 NW 13th St Oklahoma City, OK | 1.0 | 1.0 | 624 | $725 | $1.16 | 11d | 1 | 1.05mi |
| 2400 NW 36th St Oklahoma City, OK | 2.0 | 1.0 | 950 | $1,100 | $1.16 | 43d | 1 | 1.09mi |
| 2517 NW 38th St Oklahoma City, OK | 3.0 | 1.0 | 1000 | $1,225 | $1.23 | 23d | 1 | 1.09mi |
| 2517 NW 38th St Oklahoma City, OK | 3.0 | 1.0 | 1000 | $1,225 | $1.23 | 4d | 1 | 1.09mi |
Listing history 21 events
-
2026-06-18days on market $130,000 Active 48 DOM
-
2026-06-17days on market $130,000 Active 47 DOM
-
2026-06-16days on market $130,000 Active 46 DOM
-
2026-06-15days on market $130,000 Active 45 DOM
-
2026-06-13days on market $130,000 Active 43 DOM
-
2026-06-09days on market $130,000 Active 39 DOM
-
2026-06-08days on market $130,000 Active 38 DOM
-
2026-06-07days on market $130,000 Active 37 DOM
-
2026-06-05days on market $130,000 Active 34 DOM
-
2026-06-03days on market $130,000 Active 33 DOM
-
2026-06-02days on market $130,000 Active 32 DOM
-
2026-06-02remarks 485-char remark
-
2026-06-01days on market $130,000 Active 31 DOM
-
2026-05-31days on market $130,000 Active 30 DOM
-
2026-05-18price $130,000 406-char remark
-
2026-04-26$135,000 Active 406-char remark
-
2020-05-07soldstatus $97,000 Sold 264-char remark
Show marketing remark (264 chars)
Cute centrally located house with 2 bedrooms and one bath. MOVE IN READY with updates throughout. New Vinyl Siding, New Thermal Pane Windows, New Hot-water Tank, New Granite Counter tops, New Washer and Dryer, and the list goes on. Schedule your showing today!
-
2020-04-11status Pending 264-char remark
Show marketing remark (264 chars)
Cute centrally located house with 2 bedrooms and one bath. MOVE IN READY with updates throughout. New Vinyl Siding, New Thermal Pane Windows, New Hot-water Tank, New Granite Counter tops, New Washer and Dryer, and the list goes on. Schedule your showing today!
-
2020-04-06status Active 264-char remark
Show marketing remark (264 chars)
Cute centrally located house with 2 bedrooms and one bath. MOVE IN READY with updates throughout. New Vinyl Siding, New Thermal Pane Windows, New Hot-water Tank, New Granite Counter tops, New Washer and Dryer, and the list goes on. Schedule your showing today!
-
2020-03-16status Pending 264-char remark
Show marketing remark (264 chars)
Cute centrally located house with 2 bedrooms and one bath. MOVE IN READY with updates throughout. New Vinyl Siding, New Thermal Pane Windows, New Hot-water Tank, New Granite Counter tops, New Washer and Dryer, and the list goes on. Schedule your showing today!
-
2020-03-13$99,500 Active 264-char remark
Show marketing remark (264 chars)
Cute centrally located house with 2 bedrooms and one bath. MOVE IN READY with updates throughout. New Vinyl Siding, New Thermal Pane Windows, New Hot-water Tank, New Granite Counter tops, New Washer and Dryer, and the list goes on. Schedule your showing today!
ⓘ Source: listings_history table (triggers on properties + properties_extension) + one-shot
backfill from property_details.listing_events for pre-trigger history.
Tax reassessment forecast OK · Resets to sale price
- Current annual tax
- $1,553 · $129/mo
- Projected year-2 tax
- $1,553 · $129/mo
- Expected delta
- $0/yr ($0/mo · 0.0%)
ⓘ Screening estimate from a state-policy table — verify with the county assessor before closing.
Climate risk First Street
- Flood 1/10 Low FEMA zone X (unshaded) · 0% chance over 30 yrs
- Wildfire 1/10 Low
- Heat 6/10 Major 7 d/yr ≥107°F today · 19 d/yr by 30 yrs out
- Wind 2/10 Low 3% chance of damaging wind over 30 yrs
- Air quality 2/10 Low 1 unhealthy d/yr today · 2 by 30 yrs out
Nearby sold comps map
Loading sold comps map…
Walkable amenities ~0.75 mi
Loading nearby amenities…
Taxation est. · year 1
- Rental income
- $12,999
- − Mortgage interest
- −$7,282
- − Property taxes
- −$1,553
- − Insurance
- −$650
- − Repairs & maintenance
- −$1,040
- − Management
- −$1,040
- − Depreciation
- −$3,782
- Taxable loss
- −$2,347
- Est. tax savings @ 24.0%
- +$563
- After-tax cash flow
- $449/yr
For passive investors: Depreciation is non-cash, so a rental often shows a tax loss while cash-flowing — sheltering income. Rental losses are passive: they offset passive income freely, and up to $25,000/yr can offset ordinary (W-2) income if you actively participate and your MAGI is under $100k (phasing out to $0 by $150k); unused losses carry forward. On sale, claimed depreciation is recaptured at up to 25%, and gains may owe capital-gains tax (a 1031 exchange can defer both). Figures are a year-1 estimate at your 24.0% rate — not tax advice; consult a CPA.
Schools (NCES district)
- District
- Oklahoma City
- NCES district ID
- 4022770
- Math proficiency
- 7% ▼ -5.00%
- Reading proficiency
- 10% ▼ -6.00%
- Median HH income
- $35,606
- Composite
- 7.0/100
- National rank
- #9970
- State rank
- #254 of 270 in OK
Livability — Oklahoma City
- Score
- 80/100
- State rank
- #3
- US rank
- #1635
Category grades
Schools grade is shown separately in the Schools card above.
Census & demographics
- Census place
- Oklahoma City, OK
- County
- Oklahoma County · 771,644 people
- City population
- 498,656
- Metro
- Oklahoma City, OK
- Population (ZIP)
- 25,791
- Household income
- $56,873
- Rent vs Own
- Severe rent burden
- 1210.0
Population outlook (Oklahoma County) Hauer SSP2
- Today (2025)
- 911,875 people
- By 2030
- 982,413 · +7.7%
- By 2040
- 1,130,468 · +24.0%
- By 2050
- 1,288,422 · +41.3%
- By 2075
- 1,711,482 · +87.7%
- By 2100
- 2,088,448 · +129.0%
Race, ethnicity, and origin ACS 2023
- Neighborhood character
- Diverse neighborhood (Simpson 0.64)
- Race & ethnicity
- White 47% Hispanic / Latino 37% Two or more races 13% Native American 6% Black 5% Asian 2%
- Hispanic origin (detail)
- Mexican 22%
- Common ancestry
- Lithuanian 1% Italian 1% Slovak 1%
- Foreign-born
- 19% · Canada, Vietnam
- Languages at home
- 67% English-only · Spanish 30% Vietnamese 1%
Political lean MEDSL · Oklahoma
- 2024 margin
- Toss-up / Even · D 48.0% · R 49.7% · Other 2.3%
- 2008→2024 swing
- +15.1pp toward D · 2008: -16.8pp · 2024: -1.7pp
- All cycles
- 2024: R+1.7 2020: R+1.1 2016: R+10.5 2012: R+16.7 2008: R+16.8
Not yet ingested
- Civics
- —
Market trends
- HPI YoY
- ▼ -245.03%
- Current HPI
- 274.7844
- Rent YoY
- ▲ 7.29%
- Metro
- Oklahoma City, OK
- State GDP YoY
- ▲ 1.55%
- F500 in state
- 6
Industry mix (Fortune 500 HQ in OK)
| Industry | F500 HQs | Revenue |
|---|---|---|
| Energy | 3 | $48B |
|
||
Price history
+30.7% since first listed7 events — show timeline
- 2026-05-18 Price Changed $130,000 MLSOK
- 2026-04-26 Listed $135,000 MLSOK
- 2020-05-07 Sold (MLS) $97,000 MLSOK
- 2020-04-11 Pending — MLSOK
- 2020-04-06 Relisted — MLSOK
- 2020-03-16 Pending — MLSOK
- 2020-03-13 Listed $99,500 MLSOK
Property tax history
+10.4%/yrLatest (2025): $1,553 · +4.2% YoY. Source: county tax records.
Cash-flow waterfall
monthlySold comps — $/sqft
last 12 mo · ≤1 miLoading sold comps…