117 Monroe St · Madison Heights, VA
Flood risk 1/10 · Minimal
- FEMA flood zone
- X (unshaded)
- Chance of flooding over 30 yrs
- 0.0%
- Est. flood insurance / yr
- $473 – $860
Fire risk 3/10 · Minor
- Est. fire insurance / yr
- $666 – $1,236
Heat risk 6/10 · Moderate
- Hot days now (above 102°F)
- 7 days/yr
- Hot days in 30 yrs
- 18 days/yr
Wind risk 2/10 · Minimal
- Chance of severe wind over 30 yrs
- 2.0%
Air-quality risk 2/10 · Minimal
- Unhealthy air days now
- 0 days/yr
- Unhealthy air days in 30 yrs
- 2 days/yr
Risk factors via First Street. Map © Google.
Why this score? — see what drove the D grade
The composite is a weighted blend of 9 inputs, each scored 0–100. Each bar is that input's sub-score; the figure is the points it added to the 100-point composite (weight × sub-score).
- Cash flow +14.9/30.0
- ARV discount +7.4/15.0
- DSCR +4.5/10.0
- Schools +4.4/10.0
- Livability +3.7/5.0
- 1% rule +2.8/10.0
- Rent growth +2.5/5.0
- Condition / age +2.5/5.0
- Appreciation +0.0/10.0
$199,900
🖨 Deal sheet 📄 Offer letter ✓ Due diligence
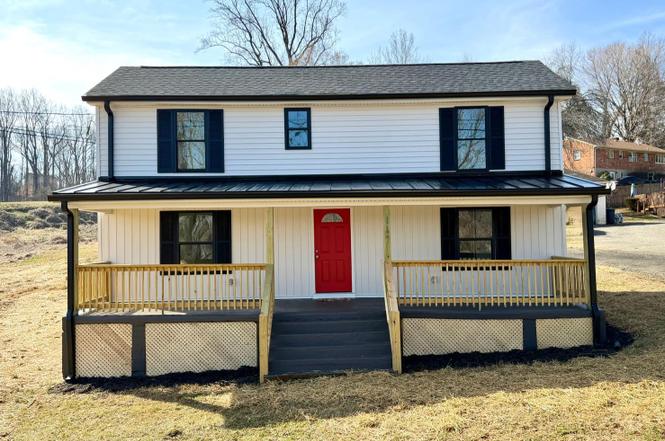
Listing remarks
Welcome home to this beautifully updated 2-bedroom, 2 full bath property offering modern upgrades and comfortable living. This move-in ready home features a convenient main-level bonus room, perfect for guests or flexible living needs. Enjoy a fully renovated interior with a stylish updated kitchen complete with stainless steel appliances, new flooring throughout, and fresh paint that gives the home a bright, welcoming feel. Major upgrades provide peace of mind, including new siding, windows, roof, and HVAC system. Ideally located just minutes from shopping, restaurants, and everyday conveniences, this home combines modern updates with a fantastic location in Amherst County. Don't miss the
Key facts
- New siding
- New flooring
- Updated kitchen
Tags
Property features AI
Exterior
- Parking: Off-street parking
- Utilities: Septic tank
- Home design: Single family residence; 2 stories
- Construction: Vinyl siding; Shingle roof
- Exterior features: Deck; Porch; Storage structure
Interior
- Kitchen: Electric range; Refrigerator; Microwave
- Flooring: Tile; Vinyl
- Bathrooms: 2 full bathrooms
- Heating & cooling: Heat pump (heating)
- Interior features: Electric water heater; Basement
- Laundry & utility: Main level laundry closet; Washer hookup
Neighborhood map
What this means for you Summary
Snapshot
- This is a 3-bed/1.5-bath single-family listed at $200k.
Deal economics
- At list price, monthly cash flow is $57 ($683/yr) — positive.
- The deal already cash-flows at list — no discount required.
- To meet the 1% rule (rent ≥ 1% of price), the offer needs to be $155k (22.5% below list).
- Recommended offer: $155k (22.5% below list) — sets the bar for 1% rule.
- Cap rate 6.6% vs local median 3.4% in Madison Heights — top-decile yield for the area; either an underpriced asset or a hidden risk that comps aren't pricing in. Stress-test before assuming the spread holds.
Location & tenants
- Location reads 73/100 on livability (#166 in VA) — a middle-class / working-renter tenant base. Strengths: cost of living A+, housing A+, commute B; Watch: health & safety C-, employment D, amenities F.
- Amherst County Public School District (rural): math 40% / reading 64% proficiency, ranked #94 of 131 in VA (top 72%) — acceptable for families but not a draw, mixed tenant base, ~2y average lease.
- Zoned schools: Amherst Elementary (math 57% / reading 77%, grade B+, #381 of 1,108 statewide, top 36%, 260 students, 78% FRL); Amherst Middle (math 30% / reading 66%, grade C-, #247 of 342 statewide, top 74%, 347 students, 77% FRL); Amherst County High (math 57% / reading 81%, grade B, #170 of 319 statewide, top 55%, 1,260 students, 75% FRL) — zoned schools average 77% FRL vs 42% district-wide (34 pts higher); higher-poverty schools than district average — tighter screening recommended.
- Market conditions: 51 active listings in the ZIP; 1 comparable units currently listed for rent nearby; 228 units permitted in Amherst County in 2024 (108 in 5+ unit buildings).
Forward outlook
- Local home prices are declining (-3.0%/yr); year-one equity from $1k of loan paydown is wiped out by about $6k of value loss. Plan a longer hold.
- Amherst County population projected at -28% by 2050 — secular population decline; favor cash flow + early exit over multi-decade hold.
Negotiation context
- It's been on market 56 days — a 3% lower offer ($194k) is reasonable based on typical stale-listing flexibility.
- Current owner paid $74k; list at $200k implies a 170% gain — meaningful room to come down on a strong offer.
Risks & watch-outs
- Watch-outs: built in 1905 — expect roof / HVAC / electrical / plumbing capex.
- Climate carrying-cost: extreme-heat days projected 7→18/yr by 2055 (HVAC capex compounding) — expect insurance premiums to compound above CPI over the hold.
Questions for the listing agent
- It's been on market 56 days. Have you received any prior offers? Is the seller open to a 22% concession, seller financing, or rate buy-down credit?
- Built in 1905 — when were the roof, HVAC, electrical panel, plumbing, and water heater last replaced?
- Is there a deadline driving the sale (1031 exchange, divorce, estate, relocation)? That informs how much negotiation room exists.
- Schools are B-rated — typically a magnet for longer-tenancy family renters. What's the average tenant stay here, and is there a school-zone premium baked into asking?
- The area grade is low — what's the realistic commute time and amenity access for the typical tenant pool here? Any planned neighborhood developments (good or bad) we should know about?
- What's the average days-on-market for RENTAL listings here right now (not sales)? A rising rental-DOM trend means longer vacancies and softer asking-rent achievability than the comps imply.
- What's the recent tenant-quality profile in this submarket — average credit score on applications, eviction rate, late-payment / NSF rate, and stable-employment percentage? A property-management company in the area should have these aggregated.
- How much new for-sale + rental construction is in the pipeline within 1–3 miles? Heavy new supply typically softens prices + rents 12–24 months out; constrained supply supports both.
Investment metrics
- 1% rule
- 0.78% ✗
- Cap rate
- 6.63%
- Cash-on-cash
- 1.22%
- DSCR
- 1.05
- GRM
- 10.7
CMA / ARV
- ARV (on-the-fly)
- $199,584
- Comps found
- 4
Show comp detail 4 sales within ~0.75 mi
| Address | Dist | Beds/Ba | Sqft | Sold | Price | $/sf | Match |
|---|---|---|---|---|---|---|---|
| 117 Monroe St | 0.00mi | 2/2.0 (-1) | 1,232 (0%) | 0mo | $199,900 | $162 | 93 |
| 107 B St | 0.28mi | 2/1.0 (-1) | 1,204 (-2%) | 8mo | $149,900 | $125 | 69 |
| 138 Magnolia Ln | 0.39mi | 3/1.0 | 1,188 (-4%) | 7mo | $246,000 | $207 | 68 |
| 136 A St | 0.35mi | 2/2.0 (-1) | 1,150 (-7%) | 13mo | $175,000 | $152 | 55 |
Match score weights: distance 35% · size 25% · config 20% · recency 20%. Top-matched comps best support the ARV.
Projected returns pro-forma
-3.0% appreciation · 3.0% rent growth · sell at horizon
- IRR
- -14.4%
- Equity multiple
- 0.48×
- Total profit
- $-28,875
- Equity at exit
- $29,806
- IRR
- -5.8%
- Equity multiple
- 0.63×
- Total profit
- $-20,915
- Equity at exit
- $17,284
Cash invested: $55,972 (down + closing). Projections, not guarantees.
Landlord ↔ Tenant lean methodology
- Overall (STATE)
- 55 Moderately Landlord-Leaning
- State Virginia
- 55 Moderately Landlord-Leaning · D+2
- County
- — inherits STATE
- City
- — inherits STATE
ZIP-level market 24574
- Home prices YoY
- -15.4%
- Active inventory
- 51
- Price-to-rent
- 10.7×
Monthly cashflow live
- Estimated rent
- $1,550 medium interval (Pro) →
- Mortgage (P&I)
- −$1,048
- Tax from tax record
- −$36 /mo · $432/yr
- Insurance
- −$83
- HOA
- −$0
- Vacancy / Maint / Mgmt
- −$326
- Net cashflow
- $57
Break-even live
UW: 25.0% down · 7.5% · 30yr · 1.5% tax · 5.0% vac · 8.0% maint · 8.0% mgmt
Financing live
Cash to close
- Down payment
- $49,975
- Closing costs
- $5,997
- Reserves months
- —
- Total cash needed
- —
Loan-product check · same deal, 3 products live
Conventional
25% down · 7.5% · 30yr
- Down + closing
- —
- Monthly P&I
- —
- Monthly cashflow
- —
- DSCR
- —
- Eligible?
- —
Personal DTI + credit; lowest rate.
DSCR
20% down · 8.5% · 30yr
- Down + closing
- —
- Monthly P&I
- —
- Monthly cashflow
- —
- DSCR
- —
- Eligible?
- —
No personal income docs; deal must DSCR.
Hard money
10% down · 12.0% · 12mo
- Down + closing
- —
- Monthly P&I
- —
- Monthly cashflow
- —
- DSCR
- —
- Eligible?
- —
Short-term bridge; refi at stabilization.
Rent comps 1 comps
| Address | Beds | Baths | Sqft | Rent | $/sqft | DOM | Units | Dist |
|---|---|---|---|---|---|---|---|---|
| 1208 S Coolwell Rd Madison Heights, VA | 3.0 | 1.0 | 845 | $1,550 | $1.83 | 13d | 1 | 1.44mi |
Listing history 5 events
-
2026-05-01status Pending
-
2026-04-24price $199,900
-
2026-04-06price $215,000
-
2026-03-05$225,000 Active
-
2003-07-01soldstatus $74,000
ⓘ Source: listings_history table (triggers on properties + properties_extension) + one-shot
backfill from property_details.listing_events for pre-trigger history.
Tax reassessment forecast VA · Resets to sale price
- Current annual tax
- $432 · $36/mo
- Projected year-2 tax
- $1,639 · $137/mo
- Expected delta
- +$1,207/yr (+$101/mo · 279.5%)
ⓘ Screening estimate from a state-policy table — verify with the county assessor before closing.
Climate risk First Street
- Flood 1/10 Low FEMA zone X (unshaded) · 0% chance over 30 yrs
- Wildfire 3/10 Moderate
- Heat 6/10 Major 7 d/yr ≥102°F today · 18 d/yr by 30 yrs out
- Wind 2/10 Low 2% chance of damaging wind over 30 yrs
- Air quality 2/10 Low 0 unhealthy d/yr today · 2 by 30 yrs out
Nearby sold comps map
Loading sold comps map…
Walkable amenities ~0.75 mi
Loading nearby amenities…
Taxation est. · year 1
- Rental income
- $18,600
- − Mortgage interest
- −$11,198
- − Property taxes
- −$432
- − Insurance
- −$1,000
- − Repairs & maintenance
- −$1,488
- − Management
- −$1,488
- − Depreciation
- −$5,815
- Taxable loss
- −$2,820
- Est. tax savings @ 24.0%
- +$677
- After-tax cash flow
- $1,360/yr
For passive investors: Depreciation is non-cash, so a rental often shows a tax loss while cash-flowing — sheltering income. Rental losses are passive: they offset passive income freely, and up to $25,000/yr can offset ordinary (W-2) income if you actively participate and your MAGI is under $100k (phasing out to $0 by $150k); unused losses carry forward. On sale, claimed depreciation is recaptured at up to 25%, and gains may owe capital-gains tax (a 1031 exchange can defer both). Figures are a year-1 estimate at your 24.0% rate — not tax advice; consult a CPA.
Schools (NCES district)
- District
- Amherst County Public School District
- NCES district ID
- 5100210
- Math proficiency
- 40% ▼ -42.00%
- Reading proficiency
- 64% ▼ -14.00%
- Median HH income
- $45,945
- Composite
- 43.96/100
- National rank
- #2900
- State rank
- #94 of 131 in VA
Livability — Madison Heights
- Score
- 73/100
- State rank
- #166
- US rank
- #5166
Category grades
Schools grade is shown separately in the Schools card above.
Census & demographics
- City population
- 15,744
- Population (ZIP)
- 4,071
Population outlook (Amherst County) Hauer SSP2
- Today (2025)
- 29,790 people
- By 2030
- 28,332 · -4.9%
- By 2040
- 24,963 · -16.2%
- By 2050
- 21,468 · -27.9%
- By 2075
- 14,111 · -52.6%
- By 2100
- 9,344 · -68.6%
Race, ethnicity, and origin ACS 2023
- Neighborhood character
- Predominantly White (77%)
- Race & ethnicity
- White 77% Black 17% Two or more races 3% Hispanic / Latino 2%
- Common ancestry
- Slovak 2% Iranian 1% Romanian 1%
- Foreign-born
- 4% · Canada, Philippines, Guatemala
- Languages at home
- 96% English-only · Spanish 1% Other Asian/Pacific 1%
Political lean MEDSL · Amherst
- 2024 margin
- Solid R (+36.5) · D 31.4% · R 67.9%
- 2008→2024 swing
- -20.3pp toward R · 2008: -16.2pp · 2024: -36.5pp
- All cycles
- 2024: R+36.5 2020: R+31.6 2016: R+30.7 2012: R+19.9 2008: R+16.2
Not yet ingested
- Civics
- —
Market trends
- HPI YoY
- ▼ -32.52%
- Current HPI
- 178.6127
- Rent YoY
- —
- Metro
- —
- State GDP YoY
- ▲ 2.40%
- F500 in state
- 50
Industry mix (Fortune 500 HQ in VA)
| Industry | F500 HQs | Revenue |
|---|---|---|
| Aerospace / Defense | 4 | $236B |
|
||
| Technology / Defense | 3 | $32B |
|
||
| Financial Services | 2 | $176B |
|
||
| Utilities | 2 | $27B |
|
||
| Insurance | 2 | $25B |
|
||
| Technology | 2 | $15B |
|
||
Price history
+170.1% since first listed5 events — show timeline
- 2026-05-01 Pending — LMLS
- 2026-04-24 Price Changed $199,900 LMLS
- 2026-04-06 Price Changed $215,000 LMLS
- 2026-03-05 Listed $225,000 LMLS
- 2003-07-01 Sold (Public Records) $74,000 Public Records
Property tax history
+0.7%/yrLatest (2025): $432 · +0.0% YoY. Source: county tax records.
Cash-flow waterfall
monthlySold comps — $/sqft
last 12 mo · ≤1 miLoading sold comps…