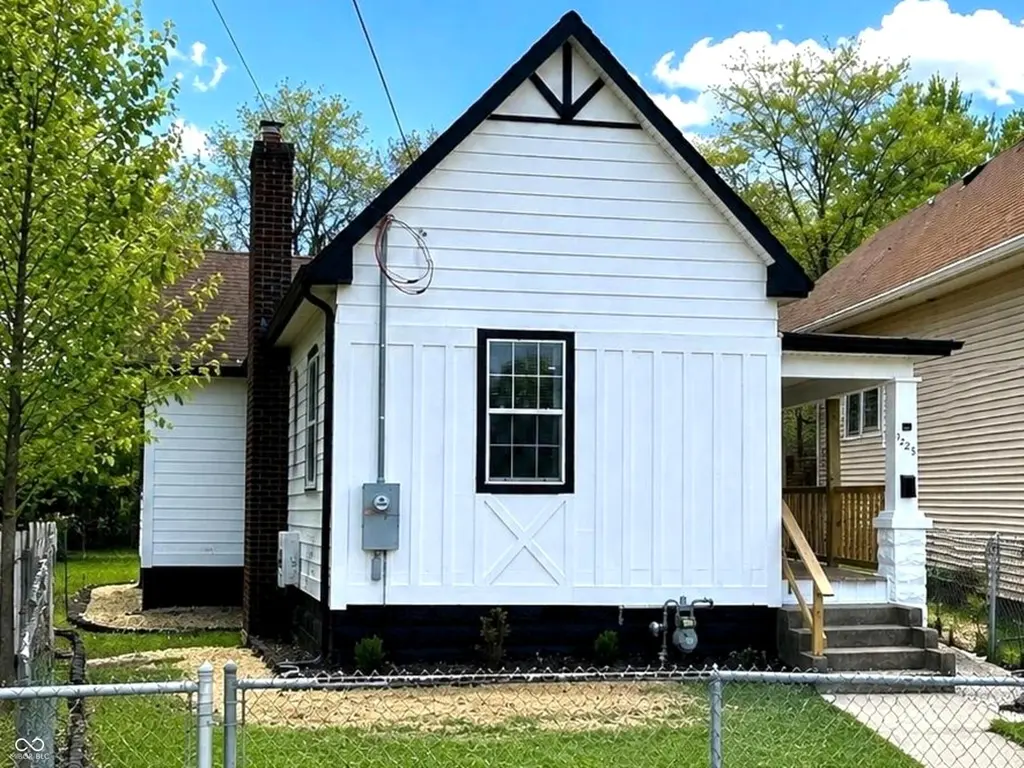
1225 E Adams St · Muncie, IN
Flood risk 1/10 · Minimal
- FEMA flood zone
- X (unshaded)
- Chance of flooding over 30 yrs
- 0.0%
- Est. flood insurance / yr
- $473 – $860
Fire risk 1/10 · Minimal
- Est. fire insurance / yr
- $717 – $1,331
Heat risk 3/10 · Minor
- Hot days now (above 101°F)
- 7 days/yr
- Hot days in 30 yrs
- 18 days/yr
Wind risk 2/10 · Minimal
- Chance of severe wind over 30 yrs
- 0.0%
Air-quality risk 3/10 · Minor
- Unhealthy air days now
- 2 days/yr
- Unhealthy air days in 30 yrs
- 3 days/yr
Risk factors via First Street. Map © Google.
Why this score? — see what drove the C- grade
The composite is a weighted blend of 9 inputs, each scored 0–100. Each bar is that input's sub-score; the figure is the points it added to the 100-point composite (weight × sub-score).
- Cash flow +20.9/30.0
- Appreciation +7.6/10.0
- DSCR +6.6/10.0
- 1% rule +4.4/10.0
- Livability +4.0/5.0
- Rent growth +3.3/5.0
- Condition / age +2.5/5.0
- Schools +1.7/10.0
- ARV discount +0.0/15.0
$125,000
🖨 Deal sheet (PDF) 📄 Offer letter ✓ Due diligence
Listing remarks MLS
Great fixer-upper opportunity with lots of potential on this 3-bed, 1 bath, 1.5 story home!
Key facts
- New flooring
- Stylish kitchen
- Granite countertops
Tags
Property features AI
Finance
- Other: Lot size approximately 0.08 acres (< 1/4 acre)
Exterior
- Parking: No garage square footage listed
- Utilities: Public water; Municipal sewer connected; No solid waste service indicated
- Home design: Single-family residence; One-and-a-half story home; Property type: Residential
- Construction: Built with other construction materials; Foundation includes block and crawl space (partial)
- Exterior features: Covered porch; Fully fenced yard
Interior
- Kitchen: Kitchen with island
- Bedrooms: Three bedrooms total — two on the main level and one on the upper level
- Flooring: Luxury vinyl plank in multiple rooms
- Bathrooms: One full bathroom and one half bathroom (both on the main level)
- Heating & cooling: Forced-air heating; Wall air conditioning unit(s); no central air
- Interior features: Attic access; Breakfast bar; Kitchen island; Walk-in closet(s)
- Laundry & utility: Laundry on the main level
Neighborhood map
What this means for you Summary
Snapshot
- This is a 4-bed/1.0-bath single-family listed at $125k.
Deal economics
- At list price, monthly cash flow is $173 ($2k/yr) — positive.
- The deal already cash-flows at list — no discount required.
- To meet the 1% rule (rent ≥ 1% of price), the offer needs to be $117k (6.4% below list).
- Recommended offer: $117k (6.4% below list) — sets the bar for 1% rule.
- Cap rate 8.0% vs local median 5.9% in Muncie — top-decile yield for the area; either an underpriced asset or a hidden risk that comps aren't pricing in. Stress-test before assuming the spread holds.
Location & tenants
- Location reads 80/100 on livability (#18 in IN, #1,654 nationally) — a professional / high-income tenant draw. Strengths: amenities A+, commute A+, cost of living A+; Watch: crime F, employment F.
- Muncie Community Schools (urban): math 18% / reading 25% proficiency, ranked #275 of 301 in IN (top 91%) — low school quality limits family demand, transient renter base, plan for 1-2y turnover; 68% free/reduced lunch — lower-income household profile, screen leases tightly.
- Zoned schools: East Washington Academy (math 41% / reading 42%, grade F, #478 of 994 statewide, top 49%, 468 students, 70% FRL); Southside Middle School (math 7% / reading 15%, grade F, #312 of 330 statewide, top 95%, 443 students, 85% FRL); Muncie Central High School (math 20% / reading 39%, 1,326 students, 70% FRL).
- Market conditions: Rents rising (+3.3%/yr); 27 active listings in the ZIP; 16 comparable units currently listed for rent nearby; rentals lingering (median 46d on market — plan ~5-8 weeks vacancy on turnover, expect pricing pressure); 100% of comp listings sitting > 30 days — soft ceiling on asking rent; lower-income renter base — watch delinquency; 171 units permitted in Delaware County in 2024 (57 in 5+ unit buildings).
Forward outlook
- In year one you build about $7k of equity ($864 loan paydown + $7k appreciation (5.3% local appreciation)).
- Delaware County population projected at -11% by 2050 — secular population decline; favor cash flow + early exit over multi-decade hold.
- At projected returns (5.3% appreciation + 3.3% rent growth), your $35k cash investment doubles in ~4 years — after that, you're playing with house money.
- By year 5, paydown + projected appreciation supports a ~$33k cash-out refi (75% LTV) — recoverable capital for the next deal without selling this one.
Negotiation context
- It's been on market 44 days — a 3% lower offer ($121k) is reasonable based on typical stale-listing flexibility.
- 2 sale attempts since 2y ago with the ask held roughly flat each time — persistent listings suggest the price (not the market) is what's stuck; bring a comps-based counter.
- Current owner paid $13k; list at $125k implies a 869% gain — meaningful room to come down on a strong offer.
Risks & watch-outs
- Watch-outs: built in 1890 — expect roof / HVAC / electrical / plumbing capex.
Questions for the listing agent
- It's been on market 44 days. Have you received any prior offers? Is the seller open to a 6% concession, seller financing, or rate buy-down credit?
- Built in 1890 — when were the roof, HVAC, electrical panel, plumbing, and water heater last replaced?
- Is there a deadline driving the sale (1031 exchange, divorce, estate, relocation)? That informs how much negotiation room exists.
- Schools are D-rated, which usually means shorter tenancies and higher turnover. Who's the typical renter profile here, and what's been the actual vacancy rate?
- Crime grade is F in this area — have there been break-ins, vandalism, or insurance claims at this property in the last 3 years? What carrier currently insures it and at what premium?
- What's the average days-on-market for RENTAL listings here right now (not sales)? A rising rental-DOM trend means longer vacancies and softer asking-rent achievability than the comps imply.
- What's the recent tenant-quality profile in this submarket — average credit score on applications, eviction rate, late-payment / NSF rate, and stable-employment percentage? A property-management company in the area should have these aggregated.
- How much new for-sale + rental construction is in the pipeline within 1–3 miles? Heavy new supply typically softens prices + rents 12–24 months out; constrained supply supports both.
Investment metrics
- 1% rule
- 0.94% ✗
- Cap rate
- 7.96%
- Cash-on-cash
- 5.94%
- DSCR
- 1.26
- GRM
- 8.9
CMA / ARV
- ARV (median comp)
- $89,095
- List price
- $125,000
- Delta
- 40.30%
- Verdict
- OVERPRICED
- Comps
- 20 within 1.0 mi
Show comp detail 11 sales within ~0.75 mi
| Address | Dist | Beds/Ba | Sqft | Sold | Price | $/sf | Match |
|---|---|---|---|---|---|---|---|
| 901 E 1st St | 0.35mi | 3/2.0 (-1) | 1,425 (-1%) | 5mo | $140,000 | $98 | 68 |
| 1322 E Jackson St | 0.12mi | 3/1.0 (-1) | 1,525 (+6%) | 16mo | $13,200 | $9 | 66 |
| 409 S Pershing Dr | 0.31mi | 3/2.0 (-1) | 1,400 (-3%) | 12mo | $90,000 | $64 | 62 |
| 801 E Charles St | 0.29mi | 3/1.5 (-1) | 1,541 (+7%) | 8mo | $27,500 | $18 | 61 |
| 809 E Main St | 0.29mi | 3/1.5 (-1) | 1,484 (+3%) | 18mo | $55,000 | $37 | 60 |
| 405 N Pershing Dr | 0.44mi | 4/1.5 | 1,600 (+11%) | 8mo | $104,000 | $65 | 52 |
| 526 S Shipley St | 0.42mi | 3/2.0 (-1) | 1,232 (-14%) | 5mo | $35,000 | $28 | 44 |
| 215 N Monroe St | 0.47mi | 3/1.0 (-1) | 1,228 (-15%) | 13mo | $137,000 | $112 | 38 |
| 700 E 8th St | 0.71mi | 3/1.5 (-1) | 1,343 (-7%) | 15mo | $139,000 | $103 | 37 |
| 1118 S Walling Ave | 0.65mi | 3/1.0 (-1) | 1,275 (-12%) | 14mo | $99,500 | $78 | 34 |
| 803 S Luick Ave | 0.73mi | 3/1.5 (-1) | 1,232 (-14%) | 18mo | $104,900 | $85 | 20 |
Match score weights: distance 35% · size 25% · config 20% · recency 20%. Top-matched comps best support the ARV.
Projected returns pro-forma
5.27% appreciation · 3.27% rent growth · sell at horizon
- IRR
- 18.7%
- Equity multiple
- 2.20×
- Total profit
- $42,076
- Equity at exit
- $72,929
- IRR
- 18.6%
- Equity multiple
- 4.35×
- Total profit
- $117,322
- Equity at exit
- $127,632
Cash invested: $35,000 (down + closing). Projections, not guarantees.
Landlord ↔ Tenant lean methodology
- Overall (STATE)
- 90 Strongly Landlord-Friendly
- State Indiana
- 90 Strongly Landlord-Friendly · R+11
- County
- — inherits STATE
- City
- — inherits STATE
ZIP-level market 47305
- Home prices YoY
- 2.0%
- Rents YoY
- 3.3%
- Active inventory
- 27
- Price-to-rent
- 8.9×
Monthly cashflow live
- Estimated rent
- $1,170 high interval (Pro) →
- Mortgage (P&I)
- −$656
- Tax from tax record
- −$43 /mo · $520/yr
- Insurance
- −$52
- HOA
- −$0
- Vacancy / Maint / Mgmt
- −$246
- Net cashflow
- $173
Break-even live
Sensitivity live
| Price | -10% $244 | -5% $209 | +0% $173 | +5% $138 | +10% $102 |
|---|---|---|---|---|---|
| Rent | -10% $81 | -5% $127 | +0% $173 | +5% $219 | +10% $266 |
| Rate | -1.0pp $236 | -0.5pp $205 | base $173 | +0.5pp $141 | +1.0pp $108 |
UW: 25.0% down · 7.5% · 30yr · 1.5% tax · 5.0% vac · 8.0% maint · 8.0% mgmt
Financing live
Cash to close
- Down payment
- $31,250
- Closing costs
- $3,750
- Reserves months
- —
- Total cash needed
- —
Loan-product check · same deal, 3 products live
Conventional
25% down · 7.5% · 30yr
- Down + closing
- —
- Monthly P&I
- —
- Monthly cashflow
- —
- DSCR
- —
- Eligible?
- —
Personal DTI + credit; lowest rate.
DSCR
20% down · 8.5% · 30yr
- Down + closing
- —
- Monthly P&I
- —
- Monthly cashflow
- —
- DSCR
- —
- Eligible?
- —
No personal income docs; deal must DSCR.
Hard money
10% down · 12.0% · 12mo
- Down + closing
- —
- Monthly P&I
- —
- Monthly cashflow
- —
- DSCR
- —
- Eligible?
- —
Short-term bridge; refi at stabilization.
Rent comps 16 comps
| Address | Beds | Baths | Sqft | Rent | $/sqft | DOM | Units | Dist |
|---|---|---|---|---|---|---|---|---|
| 1109 E Kirby Ave Muncie, IN | 2.0–3.0 | 1.0 | 971 | $975 | $1.00 | 45d | 2 | 0.27mi |
| 1521 E Kirby Ave Muncie, IN | 2.0–4.0 | 1.0–2.0 | 972 | $1,500 | $1.54 | 45d | 2 | 0.31mi |
| 305 N Pershing Dr Muncie, IN | 3.0 | 1.0 | 1062 | $1,100 | $1.04 | 45d | 1 | 0.40mi |
| 1802 E Willard St Muncie, IN | 3.0 | 2.5 | 1224 | $1,100 | $0.90 | 45d | 1 | 0.56mi |
| 412 W Howard St Muncie, IN | 3.0 | 1.0 | 1300 | $1,000 | $0.77 | 45d | 1 | 0.93mi |
| 417 S Council St Muncie, IN | 3.0 | 1.0 | 1132 | $1,025 | $0.91 | 45d | 1 | 1.03mi |
| 301 E Memorial Dr Muncie, IN | 3.0 | 1.5 | 1172 | $1,099 | $0.94 | 45d | 1 | 1.12mi |
| 2105 S Vine St Muncie, IN | 3.0 | 1.0 | 960 | $1,365 | $1.42 | 45d | 1 | 1.16mi |
| 509 W 8th St Muncie, IN | 3.0 | 1.0 | 1008 | $1,325 | $1.31 | 45d | 1 | 1.22mi |
| 808 W Beechwood Ave Muncie, IN | 4.0 | 2.0 | 1261 | $900 | $0.71 | 45d | 1 | 1.27mi |
| 1001 W 1st St Unit 1 Muncie, IN | 3.0 | 1.5 | 1098 | $875 | $0.80 | 45d | 1 | 1.29mi |
| 609 N Waldemere Ave Muncie, IN | 4.0 | 1.0 | 1664 | $1,300 | $0.78 | 45d | 1 | 1.30mi |
| 623 W 9th St Muncie, IN | 3.0 | 1.0 | 1574 | $1,499 | $0.95 | 45d | 1 | 1.30mi |
| 605 W 10th St Muncie, IN | 3.0 | 1.0 | 1688 | $1,150 | $0.68 | 45d | 1 | 1.32mi |
| 2316 S Walnut St Muncie, IN | 3.0 | 1.0 | 956 | $1,100 | $1.15 | 45d | 1 | 1.43mi |
| 1001 W Wayne St Muncie, IN | 3.0 | 2.0 | 1100 | $1,200 | $1.09 | 45d | 1 | 1.48mi |
Listing history 22 events
-
2026-06-22days on market $125,000 Active 44 DOM
-
2026-06-19days on market $125,000 Active 42 DOM
-
2026-06-18days on market $125,000 Active 41 DOM
-
2026-06-17days on market $125,000 Active 40 DOM
-
2026-06-16days on market $125,000 Active 39 DOM
-
2026-06-15days on market $125,000 Active 38 DOM
-
2026-06-14days on market $125,000 Active 36 DOM
-
2026-06-13days on market $125,000 Active 35 DOM
-
2026-06-10pricedays on market $125,000 Active 33 DOM
-
2026-06-09days on market $129,999 Active 32 DOM
-
2026-06-08days on market $129,999 Active 31 DOM
-
2026-06-07days on market $129,999 Active 30 DOM
-
2026-06-05days on market $129,999 Active 27 DOM
-
2026-06-03days on market $129,999 Active 26 DOM
-
2026-06-02days on market $129,999 Active 25 DOM
-
2026-06-01days on market $129,999 Active 24 DOM
-
2026-05-31days on market $129,999 Active 23 DOM
-
2026-05-30days on market $129,999 Active 22 DOM
-
2026-05-08$129,999 Active 843-char remark
-
2024-08-28soldstatus $12,900 Closed 91-char remark
Show marketing remark (91 chars)
Great fixer-upper opportunity with lots of potential on this 3-bed, 1 bath, 1.5 story home!
-
2024-08-17status Pending 91-char remark
Show marketing remark (91 chars)
Great fixer-upper opportunity with lots of potential on this 3-bed, 1 bath, 1.5 story home!
-
2024-07-22$13,900 Active 91-char remark
Show marketing remark (91 chars)
Great fixer-upper opportunity with lots of potential on this 3-bed, 1 bath, 1.5 story home!
ⓘ Source: listings_history table (triggers on properties + properties_extension) + one-shot
backfill from property_details.listing_events for pre-trigger history.
Tax reassessment forecast IN · Partial reset (capped growth)
- Current annual tax
- $520 · $43/mo
- Projected year-2 tax
- $791 · $66/mo
- Expected delta
- +$271/yr (+$23/mo · 52.2%)
ⓘ Screening estimate from a state-policy table — verify with the county assessor before closing.
Climate risk First Street
- Flood 1/10 Low FEMA zone X (unshaded) · 0% chance over 30 yrs
- Wildfire 1/10 Low
- Heat 3/10 Moderate 7 d/yr ≥101°F today · 18 d/yr by 30 yrs out
- Wind 2/10 Low 0% chance of damaging wind over 30 yrs
- Air quality 3/10 Moderate 2 unhealthy d/yr today · 3 by 30 yrs out
Nearby sold comps map
Loading sold comps map…
Walkable amenities ~0.75 mi
Loading nearby amenities…
Taxation est. · year 1
- Rental income
- $14,037
- − Mortgage interest
- −$7,002
- − Property taxes
- −$520
- − Insurance
- −$625
- − Repairs & maintenance
- −$1,123
- − Management
- −$1,123
- − Depreciation
- −$3,636
- Taxable income
- $8
- Est. tax owed @ 24.0%
- −$2
- After-tax cash flow
- $2,076/yr
For passive investors: Depreciation is non-cash, so a rental often shows a tax loss while cash-flowing — sheltering income. Rental losses are passive: they offset passive income freely, and up to $25,000/yr can offset ordinary (W-2) income if you actively participate and your MAGI is under $100k (phasing out to $0 by $150k); unused losses carry forward. On sale, claimed depreciation is recaptured at up to 25%, and gains may owe capital-gains tax (a 1031 exchange can defer both). Figures are a year-1 estimate at your 24.0% rate — not tax advice; consult a CPA.
Schools (NCES district)
- District
- Muncie Community Schools
- NCES district ID
- 1807320
- Math proficiency
- 18% ▼ -9.00%
- Reading proficiency
- 25% ▼ -4.00%
- Median HH income
- $30,052
- Composite
- 17.22/100
- National rank
- #9099
- State rank
- #275 of 301 in IN
Livability — Muncie
- Score
- 80/100
- State rank
- #18
- US rank
- #1654
Category grades
Schools grade is shown separately in the Schools card above.
Census & demographics
- Census place
- Muncie, IN
- County
- Delaware County · 84,658 people
- City population
- 84,658
- Metro
- Muncie, IN
- Population (ZIP)
- 3,556
- Household income
- $36,389
- Rent vs Own
- Severe rent burden
- 336.0
Population outlook (Delaware County) Hauer SSP2
- Today (2025)
- 113,036 people
- By 2030
- 111,313 · -1.5%
- By 2040
- 106,432 · -5.8%
- By 2050
- 100,747 · -10.9%
- By 2075
- 91,000 · -19.5%
- By 2100
- 80,687 · -28.6%
Race, ethnicity, and origin ACS 2023
- Neighborhood character
- Diverse neighborhood (Simpson 0.60)
- Race & ethnicity
- White 62% Two or more races 24% Black 8% Hispanic / Latino 7%
- Hispanic origin (detail)
- Mexican 6%
- Common ancestry
- Italian 4% Iranian 1% Lithuanian 1%
- Foreign-born
- 1%
- Languages at home
- 96% English-only · Spanish 2% Arabic 1% Other Asian/Pacific 1%
Political lean MEDSL · Delaware
- 2024 margin
- R (+15.8) · D 41.2% · R 57.0% · Other 1.8%
- 2008→2024 swing
- -30.8pp toward R · 2008: 15.0pp · 2024: -15.8pp
- All cycles
- 2024: R+15.8 2020: R+13.2 2016: R+13.7 2012: D+3.1 2008: D+15.0
Not yet ingested
- Civics
- —
Market trends
- HPI YoY
- ▲ 5.27%
- Current HPI
- 269.888
- Rent YoY
- ▲ 3.27%
- Metro
- Muncie, IN
- State GDP YoY
- ▲ 2.90%
- F500 in state
- 18
Industry mix (Fortune 500 HQ in IN)
| Industry | F500 HQs | Revenue |
|---|---|---|
| Industrial Machinery | 2 | $37B |
|
||
| Healthcare | 1 | $177B |
|
||
| Pharmaceuticals | 1 | $45B |
|
||
| Metals / Steel | 1 | $18B |
|
||
| Agriculture | 1 | $17B |
|
||
| Packaging | 1 | $12B |
|
||
Price history
+799.3% since first listed5 events — show timeline
- 2026-06-10 Price Changed $125,000 MIBOR as Distributed by MLS Grid
- 2026-05-08 Listed $129,999 MIBOR as Distributed by MLS Grid
- 2024-08-28 Sold (MLS) $12,900 MIBOR as Distributed by MLS Grid
- 2024-08-17 Pending — MIBOR as Distributed by MLS Grid
- 2024-07-22 Listed $13,900 MIBOR as Distributed by MLS Grid
Property tax history
+24.6%/yrLatest (2024): $520 · -60.3% YoY. Source: county tax records.
Cash-flow waterfall
monthlySold comps — $/sqft
last 12 mo · ≤1 miLoading sold comps…