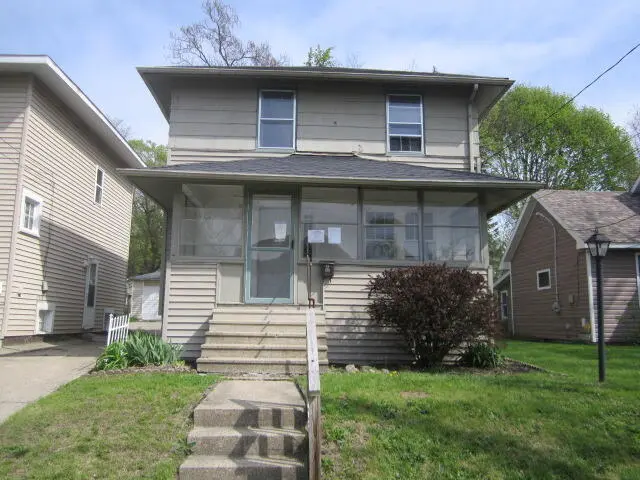
21 Bryant St · Battle Creek, MI
Flood risk 1/10 · Minimal
- FEMA flood zone
- X (unshaded)
- Chance of flooding over 30 yrs
- 0.0%
- Est. flood insurance / yr
- $473 – $860
Fire risk 1/10 · Minimal
- Est. fire insurance / yr
- $784 – $1,456
Heat risk 3/10 · Minor
- Hot days now (above 97°F)
- 7 days/yr
- Hot days in 30 yrs
- 16 days/yr
Wind risk 2/10 · Minimal
- Chance of severe wind over 30 yrs
- —
Air-quality risk 3/10 · Minor
- Unhealthy air days now
- 2 days/yr
- Unhealthy air days in 30 yrs
- 3 days/yr
Risk factors via First Street. Map © Google.
Why this score? — see what drove the C+ grade
The composite is a weighted blend of 9 inputs, each scored 0–100. Each bar is that input's sub-score; the figure is the points it added to the 100-point composite (weight × sub-score).
- Cash flow +23.4/30.0
- ARV discount +15.0/15.0
- DSCR +7.5/10.0
- 1% rule +6.0/10.0
- Livability +3.7/5.0
- Rent growth +2.5/5.0
- Condition / age +2.5/5.0
- Schools +1.1/10.0
- Appreciation +0.0/10.0
$109,000
🖨 Deal sheet 📄 Offer letter ✓ Due diligence
Listing remarks MLS
This is a lot of house for the money. according to previous listings Roof shingles and siding replaced 2019. Hardwood flooring throughout. Rooms are generously sized. Front porch enclosed, full basement for plenty of storage. For more information and to place a bid go to hudhomestore. gov HUD Case#263-685809. Equal H/O For more information on how to buy a HUD Home go to rainecompanies.com Equal H/O This home is close to the college, hospital, and elementary school.
Key facts
- Hardwood flooring
- Siding replaced
- Front porch enclosed
Tags
Property features AI
Finance
- Financial info: Home warranty included
Exterior
- Utilities: Natural gas available and connected; Electricity available; Cable connected
- Home design: Traditional style single-family residence; Built in 1925
- Construction: Vinyl siding; Asphalt shingle roof
- Exterior features: Paved road access; Public water
Interior
- Kitchen: Range; Refrigerator
- Bathrooms: 1 full bathroom
- Heating & cooling: Forced air heating; Window AC unit(s)
- Interior features: Low-threshold shower; Full basement; 7 total rooms
- Laundry & utility: Washer; Dryer; Natural gas water heater
Neighborhood map
What this means for you Summary
Snapshot
- This is a 3-bed/1.0-bath single-family listed at $109k.
Deal economics
- At list price, monthly cash flow is $201 ($2k/yr) — positive.
- The deal already cash-flows at list — no discount required.
- Meets the 1% rule at list price ($1k rent vs $109k).
- Recommended offer: $106k (3.0% below list) — sets the bar for market timing.
- Cap rate 8.5% vs local median 5.2% in Battle Creek — top-decile yield for the area; either an underpriced asset or a hidden risk that comps aren't pricing in. Stress-test before assuming the spread holds.
Location & tenants
- Location reads 73/100 on livability (#198 in MI) — a middle-class / working-renter tenant base. Strengths: cost of living A+, housing A+, health & safety A+; Watch: schools C-, amenities C-, crime F.
- Battle Creek Public Schools (urban): math 8% / reading 19% proficiency, ranked #510 of 540 in MI (top 94%) — low school quality limits family demand, transient renter base, plan for 1-2y turnover; 75% free/reduced lunch — lower-income household profile, screen leases tightly.
- Market conditions: 148 active listings in the ZIP; 6 comparable units currently listed for rent nearby; rentals lingering (median 44d on market — plan ~5-8 weeks vacancy on turnover, expect pricing pressure); 83% of comp listings sitting > 30 days — soft ceiling on asking rent; 132 units permitted in Calhoun County in 2024 (0 in 5+ unit buildings).
Forward outlook
- Local home prices are declining (-3.0%/yr); year-one equity from $754 of loan paydown is wiped out by about $3k of value loss. Plan a longer hold.
- Calhoun County population projected at -16% by 2050 — secular population decline; favor cash flow + early exit over multi-decade hold.
Negotiation context
- It's been on market 42 days — a 3% lower offer ($106k) is reasonable based on typical stale-listing flexibility.
- 33 sale attempts since 26y ago with the ask held roughly flat each time — persistent listings suggest the price (not the market) is what's stuck; bring a comps-based counter.
Risks & watch-outs
- Watch-outs: built in 1925 — expect roof / HVAC / electrical / plumbing capex.
Questions for the listing agent
- It's been on market 42 days. Have you received any prior offers? Is the seller open to a 3% concession, seller financing, or rate buy-down credit?
- Built in 1925 — when were the roof, HVAC, electrical panel, plumbing, and water heater last replaced?
- Is there a deadline driving the sale (1031 exchange, divorce, estate, relocation)? That informs how much negotiation room exists.
- Crime grade is F in this area — have there been break-ins, vandalism, or insurance claims at this property in the last 3 years? What carrier currently insures it and at what premium?
- What's the average days-on-market for RENTAL listings here right now (not sales)? A rising rental-DOM trend means longer vacancies and softer asking-rent achievability than the comps imply.
- What's the recent tenant-quality profile in this submarket — average credit score on applications, eviction rate, late-payment / NSF rate, and stable-employment percentage? A property-management company in the area should have these aggregated.
- How much new for-sale + rental construction is in the pipeline within 1–3 miles? Heavy new supply typically softens prices + rents 12–24 months out; constrained supply supports both.
Investment metrics
- 1% rule
- 1.10% ✓
- Cap rate
- 8.51%
- Cash-on-cash
- 7.92%
- DSCR
- 1.35
- GRM
- 7.6
CMA / ARV
- ARV (median comp)
- $144,040
- List price
- $109,000
- Delta
- -24.33%
- Verdict
- UNDERPRICED
- Comps
- 20 within 1.0 mi
Show comp detail 12 sales within ~0.75 mi
| Address | Dist | Beds/Ba | Sqft | Sold | Price | $/sf | Match |
|---|---|---|---|---|---|---|---|
| 261 E Emmett St E | 0.24mi | 3/1.0 | 1,176 (+3%) | 3mo | $65,000 | $55 | 82 |
| 136 N Broad St | 0.06mi | 2/1.0 (-1) | 1,215 (+6%) | 1mo | $185,000 | $152 | 81 |
| 246 Laurel Dr | 0.24mi | 3/1.0 | 1,089 (-5%) | 3mo | $179,000 | $164 | 78 |
| 192 Hunter St | 0.13mi | 3/2.0 | 1,250 (+9%) | 2mo | $185,000 | $148 | 73 |
| 30 East Ave N | 0.29mi | 3/1.0 | 1,054 (-8%) | 3mo | $89,900 | $85 | 71 |
| 54 Maple Ter | 0.23mi | 2/1.0 (-1) | 1,000 (-13%) | 2mo | $139,000 | $139 | 62 |
| 80 Magnolia Ave | 0.46mi | 2/1.5 (-1) | 1,216 (+6%) | 1mo | $133,000 | $109 | 60 |
| 83 Magnolia Ave | 0.49mi | 3/1.0 | 1,260 (+10%) | 2mo | $142,500 | $113 | 58 |
| 611 E Roosevelt Ave E | 0.66mi | 3/1.0 | 1,213 (+6%) | 2mo | $165,000 | $136 | 57 |
| 167 Sharon Ave | 0.70mi | 3/2.5 | 1,186 (+4%) | 2mo | $130,000 | $110 | 54 |
| 168 Yale St | 0.56mi | 3/1.0 | 1,312 (+15%) | 1mo | $118,000 | $90 | 48 |
| 31 Oxford St | 0.60mi | 2/1.0 (-1) | 996 (-13%) | 2mo | $105,000 | $105 | 44 |
Match score weights: distance 35% · size 25% · config 20% · recency 20%. Top-matched comps best support the ARV.
Projected returns pro-forma
-3.0% appreciation · 3.0% rent growth · sell at horizon
- IRR
- -4.2%
- Equity multiple
- 0.84×
- Total profit
- $-4,822
- Equity at exit
- $16,252
- IRR
- 5.5%
- Equity multiple
- 1.41×
- Total profit
- $12,377
- Equity at exit
- $9,424
Cash invested: $30,520 (down + closing). Projections, not guarantees.
Landlord ↔ Tenant lean methodology
- Overall (STATE)
- 62 Landlord-Friendly
- State Michigan
- 62 Landlord-Friendly · EVEN
- County
- — inherits STATE
- City
- — inherits STATE
ZIP-level market 49017
- Home prices YoY
- -32.2%
- Active inventory
- 148
- Price-to-rent
- 7.6×
Monthly cashflow live
- Estimated rent
- $1,202 high interval (Pro) →
- Mortgage (P&I)
- −$572
- Tax from tax record
- −$131 /mo · $1,572/yr
- Insurance
- −$45
- HOA
- −$0
- Vacancy / Maint / Mgmt
- −$252
- Net cashflow
- $201
Break-even live
UW: 25.0% down · 7.5% · 30yr · 1.5% tax · 5.0% vac · 8.0% maint · 8.0% mgmt
Financing live
Cash to close
- Down payment
- $27,250
- Closing costs
- $3,270
- Reserves months
- —
- Total cash needed
- —
Loan-product check · same deal, 3 products live
Conventional
25% down · 7.5% · 30yr
- Down + closing
- —
- Monthly P&I
- —
- Monthly cashflow
- —
- DSCR
- —
- Eligible?
- —
Personal DTI + credit; lowest rate.
DSCR
20% down · 8.5% · 30yr
- Down + closing
- —
- Monthly P&I
- —
- Monthly cashflow
- —
- DSCR
- —
- Eligible?
- —
No personal income docs; deal must DSCR.
Hard money
10% down · 12.0% · 12mo
- Down + closing
- —
- Monthly P&I
- —
- Monthly cashflow
- —
- DSCR
- —
- Eligible?
- —
Short-term bridge; refi at stabilization.
Rent comps 6 comps
| Address | Beds | Baths | Sqft | Rent | $/sqft | DOM | Units | Dist |
|---|---|---|---|---|---|---|---|---|
| 138 Yale St Battle Creek, MI | 2.0 | 1.0 | 877 | $1,275 | $1.45 | 44d | 1 | 0.56mi |
| 775 Wagner Dr Battle Creek, MI | 1.0–2.0 | 1.0 | 772 | $1,085 | $1.40 | 44d | 6 | 0.59mi |
| 98 Van Buren St E Battle Creek, MI | 2.0 | 1.0 | 1118 | $950 | $0.85 | 44d | 1 | 0.88mi |
| 115 West St Battle Creek, MI | 2.0–3.0 | 1.0–2.0 | 1090 | $1,500 | $1.38 | 44d | 3 | 0.96mi |
| 54 Springview Dr Battle Creek, MI | 1.0–3.0 | 1.0–2.0 | 900 | $1,050 | $1.17 | 21d | 3 | 1.05mi |
| 744 E Michigan Ave Unit 11 Battle Creek, MI | 2.0 | 1.0 | 800 | $1,050 | $1.31 | 44d | 1 | 1.32mi |
Listing history 50 events
-
2026-06-19days on market $109,000 Active 42 DOM
-
2026-06-18days on market $109,000 Active 41 DOM
-
2026-06-17days on market $109,000 Active 40 DOM
-
2026-06-16days on market $109,000 Active 39 DOM
-
2026-06-15days on market $109,000 Active 38 DOM
-
2026-06-14days on market $109,000 Active 36 DOM
-
2026-06-13days on market $109,000 Active 35 DOM
-
2026-06-10days on market $109,000 Active 33 DOM
-
2026-06-09days on market $109,000 Active 32 DOM
-
2026-06-08days on market $109,000 Active 31 DOM
-
2026-06-07days on market $109,000 Active 30 DOM
-
2026-06-05days on market $109,000 Active 27 DOM
-
2026-06-02days on market $109,000 Active 25 DOM
-
2026-06-01days on market $109,000 Active 24 DOM
-
2026-05-31days on market $109,000 Active 23 DOM
-
2026-05-30days on market $109,000 Active 22 DOM
-
2026-05-08$109,000 Active 469-char remark
Show marketing remark (470 chars)
This is a lot of house for the money. according to previous listings Roof shingles and siding replaced 2019. Hardwood flooring throughout. Rooms are generously sized. Front porch enclosed, full basement for plenty of storage. For more information and to place a bid go to hudhomestore. gov HUD Case#263-685809. Equal H/O For more information on how to buy a HUD Home go to rainecompanies.com Equal H/O This home is close to the college, hospital, and elementary school.
-
2026-05-08$109,000 Active 470-char remark
Show marketing remark (470 chars)
This is a lot of house for the money. according to previous listings Roof shingles and siding replaced 2019. Hardwood flooring throughout. Rooms are generously sized. Front porch enclosed, full basement for plenty of storage. For more information and to place a bid go to hudhomestore. gov HUD Case#263-685809. Equal H/O For more information on how to buy a HUD Home go to rainecompanies.com Equal H/O This home is close to the college, hospital, and elementary school.
-
2026-05-08$109,000 Active
Show marketing remark (470 chars)
This is a lot of house for the money. according to previous listings Roof shingles and siding replaced 2019. Hardwood flooring throughout. Rooms are generously sized. Front porch enclosed, full basement for plenty of storage. For more information and to place a bid go to hudhomestore. gov HUD Case#263-685809. Equal H/O For more information on how to buy a HUD Home go to rainecompanies.com Equal H/O This home is close to the college, hospital, and elementary school.
-
2025-08-22status Pending
-
2025-08-22status Pending
-
2025-08-17historical
-
2025-08-17historical
-
2025-08-12$118,000 Active
-
2025-08-12$118,000 Active
-
2022-03-24soldstatus $188,000
-
2022-03-16soldstatus $88,000 Sold
-
2022-03-16soldstatus $88,000 Sold
-
2021-12-23status Pending
-
2021-12-23status Pending
-
2021-12-19$92,500 Active
-
2021-12-19$92,500 Active
-
2021-12-19$92,500
-
2021-01-15soldstatus $71,000
-
2021-01-08soldstatus $71,000 Sold
-
2021-01-08soldstatus $71,000 Sold
-
2020-11-25status Pending
-
2020-11-25historical
-
2020-10-20historical Active Backup
-
2020-09-15$67,900
-
2020-09-15$67,900 Active
-
2020-09-15$67,900
-
2014-09-26historical
-
2014-09-25historical
-
2014-09-25historical
-
2014-09-25historical
-
2014-09-17historical
-
2014-09-17historical
-
2014-09-15historical
-
2013-10-15soldstatus $18,900
ⓘ Source: listings_history table (triggers on properties + properties_extension) + one-shot
backfill from property_details.listing_events for pre-trigger history.
Tax reassessment forecast MI · Partial reset (capped growth)
- Current annual tax
- $1,572 · $131/mo
- Projected year-2 tax
- $1,625 · $135/mo
- Expected delta
- +$53/yr (+$4/mo · 3.4%)
ⓘ Screening estimate from a state-policy table — verify with the county assessor before closing.
Climate risk First Street
- Flood 1/10 Low FEMA zone X (unshaded) · 0% chance over 30 yrs
- Wildfire 1/10 Low
- Heat 3/10 Moderate 7 d/yr ≥97°F today · 16 d/yr by 30 yrs out
- Wind 2/10 Low
- Air quality 3/10 Moderate 2 unhealthy d/yr today · 3 by 30 yrs out
Nearby sold comps map
Loading sold comps map…
Walkable amenities ~0.75 mi
Loading nearby amenities…
Taxation est. · year 1
- Rental income
- $14,422
- − Mortgage interest
- −$6,106
- − Property taxes
- −$1,572
- − Insurance
- −$545
- − Repairs & maintenance
- −$1,154
- − Management
- −$1,154
- − Depreciation
- −$3,171
- Taxable income
- $720
- Est. tax owed @ 24.0%
- −$173
- After-tax cash flow
- $2,244/yr
For passive investors: Depreciation is non-cash, so a rental often shows a tax loss while cash-flowing — sheltering income. Rental losses are passive: they offset passive income freely, and up to $25,000/yr can offset ordinary (W-2) income if you actively participate and your MAGI is under $100k (phasing out to $0 by $150k); unused losses carry forward. On sale, claimed depreciation is recaptured at up to 25%, and gains may owe capital-gains tax (a 1031 exchange can defer both). Figures are a year-1 estimate at your 24.0% rate — not tax advice; consult a CPA.
Schools (NCES district)
- District
- Battle Creek Public Schools
- NCES district ID
- 2600005
- Math proficiency
- 8% ▼ -2.00%
- Reading proficiency
- 19% ▬ 0.00%
- Median HH income
- $31,697
- Composite
- 10.73/100
- National rank
- #9769
- State rank
- #510 of 540 in MI
Livability — Battle Creek
- Score
- 73/100
- State rank
- #198
- US rank
- #5031
Category grades
Schools grade is shown separately in the Schools card above.
Census & demographics
- Census place
- Battle Creek, MI
- County
- Calhoun County · 91,590 people
- City population
- 91,590
- Metro
- Battle Creek, MI
- Population (ZIP)
- 21,295
- Household income
- $60,885
- Rent vs Own
- Severe rent burden
- 697.0
Population outlook (Calhoun County) Hauer SSP2
- Today (2025)
- 130,157 people
- By 2030
- 126,691 · -2.7%
- By 2040
- 118,517 · -8.9%
- By 2050
- 109,855 · -15.6%
- By 2075
- 90,486 · -30.5%
- By 2100
- 70,766 · -45.6%
Race, ethnicity, and origin ACS 2023
- Neighborhood character
- Predominantly White (78%)
- Race & ethnicity
- White 78% Black 9% Two or more races 8% Hispanic / Latino 6%
- Hispanic origin (detail)
- Mexican 4%
- Common ancestry
- Slovak 3% Iranian 3% Romanian 2%
- Foreign-born
- 3% · Canada, Philippines
- Languages at home
- 95% English-only · Spanish 2% Other Asian/Pacific 1% Arabic 1%
Political lean MEDSL · Calhoun
- 2024 margin
- R (+14.1) · D 42.3% · R 56.4% · Other 1.3%
- 2008→2024 swing
- -23.4pp toward R · 2008: 9.4pp · 2024: -14.1pp
- All cycles
- 2024: R+14.1 2020: R+11.1 2016: R+12.5 2012: D+1.6 2008: D+9.4
Not yet ingested
- Civics
- —
Market trends
- HPI YoY
- ▼ -115.68%
- Current HPI
- 243.5008
- Rent YoY
- —
- Metro
- Battle Creek, MI
- State GDP YoY
- ▲ 1.37%
- F500 in state
- 28
Industry mix (Fortune 500 HQ in MI)
| Industry | F500 HQs | Revenue |
|---|---|---|
| Automotive Parts | 3 | $48B |
|
||
| Automotive | 2 | $372B |
|
||
| Chemicals | 1 | $45B |
|
||
| Automotive Retail | 1 | $29B |
|
||
| Healthcare / Medical Devices | 1 | $23B |
|
||
| Automotive Technology | 1 | $20B |
|
||
Price history
+172.5% since first listed71 events — show timeline
- 2026-05-08 Listed $109,000 SW Michigan MLS
- 2026-05-08 Listed $109,000 REALCOMP
- 2026-05-08 Listed $109,000 MiRealSource-MiMLS
- 2025-08-22 Pending — REALCOMP
- 2025-08-22 Pending — MiRealSource-MiMLS
- 2025-08-17 Listing Removed — MiRealSource-MiMLS
- 2025-08-17 Listing Removed — REALCOMP
- 2025-08-12 Listed $118,000 MiRealSource-MiMLS
- 2025-08-12 Listed $118,000 REALCOMP
- 2022-03-24 Sold (Public Records) $188,000 Public Records
- 2022-03-16 Sold (MLS) $88,000 SW Michigan MLS
- 2022-03-16 Sold (MLS) $88,000 REALCOMP
- 2021-12-23 Pending — SW Michigan MLS
- 2021-12-23 Pending — REALCOMP
- 2021-12-19 Listed $92,500 MiRealSource-MiMLS
- 2021-12-19 Listed $92,500 SW Michigan MLS
- 2021-12-19 Listed $92,500 REALCOMP
- 2021-01-15 Sold (Public Records) $71,000 Public Records
- 2021-01-08 Sold (MLS) $71,000 SW Michigan MLS
- 2021-01-08 Sold (MLS) $71,000 REALCOMP
- 2020-11-25 Pending — SW Michigan MLS
- 2020-11-25 Listing Removed — REALCOMP
- 2020-10-20 Contingent — SW Michigan MLS
- 2020-09-15 Listed $67,900 MiRealSource-MiMLS
- 2020-09-15 Listed $67,900 SW Michigan MLS
- 2020-09-15 Listed $67,900 REALCOMP
- 2014-09-26 Listing Removed — SW Michigan MLS
- 2014-09-25 Listing Removed — SW Michigan MLS
- 2014-09-25 Listing Removed — SW Michigan MLS
- 2014-09-25 Listing Removed — SW Michigan MLS
- 2014-09-17 Listing Removed — SW Michigan MLS
- 2014-09-17 Listing Removed — SW Michigan MLS
- 2014-09-15 Listing Removed — SW Michigan MLS
- 2013-10-15 Sold (MLS) $18,900 REALCOMP
- 2013-10-15 Sold (MLS) $18,900 SW Michigan MLS
- 2013-08-08 Listed $18,900 REALCOMP
- 2013-08-08 Listed $18,900 SW Michigan MLS
- 2013-03-28 Listing Removed — REALCOMP
- 2012-09-24 Listed $33,000 REALCOMP
- 2012-09-24 Listed $33,000 SW Michigan MLS
- 2012-07-02 Listing Removed — REALCOMP
- 2012-02-02 Listed $50,000 REALCOMP
- 2012-02-02 Listed $50,000 SW Michigan MLS
- 2009-08-07 Listing Removed — REALCOMP
- 2008-08-07 Listed $66,900 REALCOMP
- 2008-08-07 Listed $66,900 SW Michigan MLS
- 2008-08-04 Listing Removed — SW Michigan MLS
- 2008-08-04 Listing Removed — REALCOMP
- 2008-02-20 Listed $66,900 SW Michigan MLS
- 2008-02-20 Listed $66,900 REALCOMP
- 2005-07-14 Sold (Public Records) $69,500 Public Records
- 2005-05-10 Listing Removed — REALCOMP
- 2005-05-10 Listing Removed — SW Michigan MLS
- 2005-03-04 Listed $69,900 REALCOMP
- 2005-03-04 Listed $69,900 SW Michigan MLS
- 2005-02-18 Listing Removed — REALCOMP
- 2004-10-18 Listed $69,900 REALCOMP
- 2004-10-18 Listed $69,900 SW Michigan MLS
- 2004-10-16 Listing Removed — REALCOMP
- 2004-09-13 Listed $69,900 REALCOMP
- 2004-09-13 Listed $69,900 SW Michigan MLS
- 2004-09-12 Listing Removed — REALCOMP
- 2004-05-12 Listed $74,900 REALCOMP
- 2004-05-12 Listed $74,900 SW Michigan MLS
- 2004-03-30 Listing Removed — REALCOMP
- 2003-10-09 Listed $84,900 REALCOMP
- 2003-10-09 Listed $84,900 SW Michigan MLS
- 2001-04-18 Listing Removed — REALCOMP
- 2001-04-18 Listing Removed — SW Michigan MLS
- 2000-08-28 Listed $40,000 REALCOMP
- 2000-08-28 Listed $40,000 SW Michigan MLS
Property tax history
+3.8%/yrLatest (2025): $1,572 · -25.2% YoY. Source: county tax records.
Cash-flow waterfall
monthlySold comps — $/sqft
last 12 mo · ≤1 miLoading sold comps…