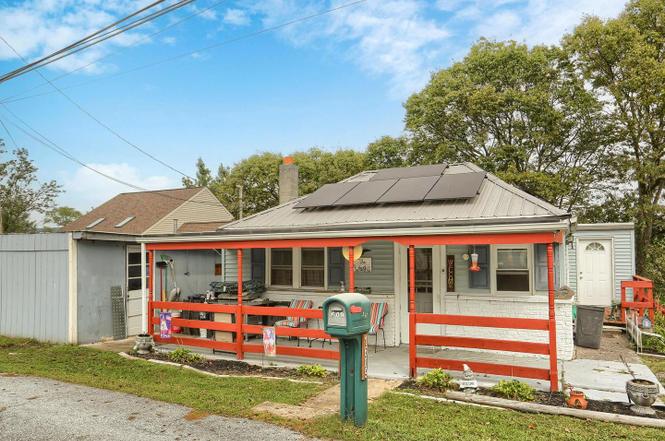
1609 High St · West Fairview, PA
Flood risk 1/10 · Minimal
- FEMA flood zone
- X (unshaded)
- Chance of flooding over 30 yrs
- 0.0%
- Est. flood insurance / yr
- $507 – $1,088
Fire risk 1/10 · Minimal
- Est. fire insurance / yr
- $511 – $949
Heat risk 5/10 · Moderate
- Hot days now (above 101°F)
- 7 days/yr
- Hot days in 30 yrs
- 14 days/yr
Wind risk 3/10 · Minor
- Chance of severe wind over 30 yrs
- 5.0%
Air-quality risk 2/10 · Minimal
- Unhealthy air days now
- 1 days/yr
- Unhealthy air days in 30 yrs
- 3 days/yr
Risk factors via First Street. Map © Google.
Why this score? — see what drove the B grade
The composite is a weighted blend of 9 inputs, each scored 0–100. Each bar is that input's sub-score; the figure is the points it added to the 100-point composite (weight × sub-score).
- Cash flow +27.0/30.0
- ARV discount +15.0/15.0
- DSCR +9.3/10.0
- 1% rule +7.5/10.0
- Rent growth +4.1/5.0
- Livability +3.9/5.0
- Schools +3.8/10.0
- Condition / age +2.5/5.0
- Appreciation +0.0/10.0
$110,000
🖨 Deal sheet 📄 Offer letter ✓ Due diligence
Listing remarks MLS
Lovely one floor living. Completely redone - new kitchen, flooring, paint, windows, patio door, deck, new appliances included -refrigerator, electric range, washer & dryer. Live in country setting with view of river in fall/winter. Public access at point. Own your own home instead of renting. Yard with pavilion, shed/garage has electric & AC wall unit. Take a look at all the new living features.
Key facts
- 9,148 sq ft lot
- 3 parking spots
- Built 1900
Neighborhood map
What this means for you Summary
Snapshot
- This is a 2-bed/1.0-bath single-family listed at $110k.
Deal economics
- At list price, monthly cash flow is $308 ($4k/yr) — positive.
- The deal already cash-flows at list — no discount required.
- Meets the 1% rule at list price ($1k rent vs $110k).
- Recommended offer: $97k (12.0% below list) — sets the bar for market timing.
Location & tenants
- Location reads 77/100 on livability (#344 in PA, #3,029 nationally) — a middle-class / working-renter tenant base. Strengths: crime A+, cost of living A+, housing A+; Watch: employment D+, amenities F.
- East Pennsboro Area SD (suburban): math 30% / reading 57% proficiency, ranked #275 of 539 in PA (top 51%) — families likely to look elsewhere, expect single-tenant / working-renter base with shorter leases.
- Zoned schools: East Pennsboro Area Shs (math 82% / reading 72%, grade A-, #22 of 437 statewide, top 5%, 761 students, 36% FRL).
- Zoned-school proficiency averages 77% at this address vs 44% district-wide (+34 pts) — the actual schools serving this property are materially stronger than the East Pennsboro Area SD average implies; a family-tenant draw the district grade alone would hide.
- Market conditions: Rents rising fast (+6.5%/yr); 126 active listings in the ZIP; 21 comparable units currently listed for rent nearby; rentals at typical pace (median 24d on market — plan ~3-4 weeks tenant-placement turnaround); solid renter incomes; 1,052 units permitted in Cumberland County in 2024 (310 in 5+ unit buildings).
Forward outlook
- Local home prices are declining (-3.0%/yr); year-one equity from $761 of loan paydown is wiped out by about $3k of value loss. Plan a longer hold.
- Cumberland County population projected at +17% by 2050 — long-run rental-demand tailwind backs the buy-and-hold thesis.
- At projected returns (-3.0% appreciation + 6.5% rent growth), your $31k cash investment doubles in ~8 years — after that, you're playing with house money.
Negotiation context
- It's been on market 137 days — a 12% lower offer ($97k) is reasonable based on typical stale-listing flexibility.
- 2 sale attempts since 10y ago; this cycle's ask has dropped $80k (42%) from the opening price — seller is motivated, your offer sets the floor, not the list.
Risks & watch-outs
- Watch-outs: built in 1900 — expect roof / HVAC / electrical / plumbing capex.
- Climate carrying-cost: extreme-heat days projected 7→14/yr by 2055 (HVAC capex compounding) — expect insurance premiums to compound above CPI over the hold.
Questions for the listing agent
- It's been on market 137 days. Have you received any prior offers? Is the seller open to a 12% concession, seller financing, or rate buy-down credit?
- Built in 1900 — when were the roof, HVAC, electrical panel, plumbing, and water heater last replaced?
- Why hasn't it sold? Are there any deal-killer items the seller is aware of (foundation, flood, title, zoning, code violations)?
- Is there a deadline driving the sale (1031 exchange, divorce, estate, relocation)? That informs how much negotiation room exists.
- Schools are F-rated, which usually means shorter tenancies and higher turnover. Who's the typical renter profile here, and what's been the actual vacancy rate?
- What's the average days-on-market for RENTAL listings here right now (not sales)? A rising rental-DOM trend means longer vacancies and softer asking-rent achievability than the comps imply.
- What's the recent tenant-quality profile in this submarket — average credit score on applications, eviction rate, late-payment / NSF rate, and stable-employment percentage? A property-management company in the area should have these aggregated.
- How much new for-sale + rental construction is in the pipeline within 1–3 miles? Heavy new supply typically softens prices + rents 12–24 months out; constrained supply supports both.
Investment metrics
- 1% rule
- 1.25% ✓
- Cap rate
- 9.65%
- Cash-on-cash
- 11.99%
- DSCR
- 1.53
- GRM
- 6.6
CMA / ARV
- ARV (on-the-fly)
- $163,800
- Comps found
- 9
Show comp detail 9 sales within ~0.75 mi
| Address | Dist | Beds/Ba | Sqft | Sold | Price | $/sf | Match |
|---|---|---|---|---|---|---|---|
| 1 E Locust St | 0.32mi | 2/1.0 | 915 (-2%) | 8mo | $200,000 | $219 | 74 |
| 1208 Locust St | 0.25mi | 3/1.0 (+1) | 874 (-7%) | 19mo | $110,000 | $126 | 56 |
| 13 W Locust St | 0.44mi | 3/2.0 (+1) | 970 (+4%) | 10mo | $170,000 | $175 | 56 |
| 13 W Beale Ave | 0.62mi | 2/1.0 | 928 (-1%) | 22mo | $157,000 | $169 | 52 |
| 8 W Locust St | 0.42mi | 2/1.5 | 1,024 (+9%) | 23mo | $160,150 | $156 | 44 |
| 19 W Pine St | 0.52mi | 3/1.0 (+1) | 1,008 (+8%) | 18mo | $260,000 | $258 | 43 |
| 122 Creekside Dr | 0.68mi | 2/1.0 | 1,056 (+13%) | 10mo | $200,000 | $189 | 39 |
| 309 Lincoln St | 0.38mi | 3/1.0 (+1) | 1,056 (+13%) | 22mo | $150,000 | $142 | 38 |
| 939 S Humer St | 0.71mi | 3/1.0 (+1) | 1,008 (+8%) | 21mo | $220,000 | $218 | 32 |
Match score weights: distance 35% · size 25% · config 20% · recency 20%. Top-matched comps best support the ARV.
Projected returns pro-forma
-3.0% appreciation · 6.46% rent growth · sell at horizon
- IRR
- 5.5%
- Equity multiple
- 1.22×
- Total profit
- $6,785
- Equity at exit
- $16,401
- IRR
- 17.9%
- Equity multiple
- 2.73×
- Total profit
- $53,185
- Equity at exit
- $9,511
Cash invested: $30,800 (down + closing). Projections, not guarantees.
Landlord ↔ Tenant lean methodology
- Overall (STATE)
- 62 Landlord-Friendly
- State Pennsylvania
- 62 Landlord-Friendly · EVEN
- County
- — inherits STATE
- City
- — inherits STATE
ZIP-level market 17025
- Home prices YoY
- -25.3%
- Rents YoY
- 6.5%
- Active inventory
- 126
- Price-to-rent
- 6.6×
Monthly cashflow live
- Estimated rent
- $1,379 high interval (Pro) →
- Mortgage (P&I)
- −$577
- Tax from tax record
- −$159 /mo · $1,908/yr
- Insurance
- −$46
- HOA
- −$0
- Vacancy / Maint / Mgmt
- −$290
- Net cashflow
- $308
Break-even live
UW: 25.0% down · 7.5% · 30yr · 1.5% tax · 5.0% vac · 8.0% maint · 8.0% mgmt
Financing live
Cash to close
- Down payment
- $27,500
- Closing costs
- $3,300
- Reserves months
- —
- Total cash needed
- —
Loan-product check · same deal, 3 products live
Conventional
25% down · 7.5% · 30yr
- Down + closing
- —
- Monthly P&I
- —
- Monthly cashflow
- —
- DSCR
- —
- Eligible?
- —
Personal DTI + credit; lowest rate.
DSCR
20% down · 8.5% · 30yr
- Down + closing
- —
- Monthly P&I
- —
- Monthly cashflow
- —
- DSCR
- —
- Eligible?
- —
No personal income docs; deal must DSCR.
Hard money
10% down · 12.0% · 12mo
- Down + closing
- —
- Monthly P&I
- —
- Monthly cashflow
- —
- DSCR
- —
- Eligible?
- —
Short-term bridge; refi at stabilization.
Rent comps 21 comps
| Address | Beds | Baths | Sqft | Rent | $/sqft | DOM | Units | Dist |
|---|---|---|---|---|---|---|---|---|
| 7 Adams St Unit 08 Enola, PA | 2.0 | 1.0 | 700 | $1,300 | $1.86 | 23d | 1 | 0.52mi |
| 400 W Crestwood Dr Camp Hill, PA | 1.0–3.0 | 1.0–2.0 | 1042 | $1,634 | $1.57 | 14d | 14 | 0.94mi |
| 2311 N Front St Harrisburg, PA | 1.0 | 1.0 | 463 | $995 | $2.15 | 14d | 5 | 1.05mi |
| 150 Erford Rd Camp Hill, PA | 1.0–2.0 | 1.5–2.0 | 879 | $1,680 | $1.91 | 14d | 38 | 1.31mi |
| 2312 Orange St Harrisburg, PA | 2.0 | 1.0 | 754 | $1,230 | $1.63 | 44d | 1 | 1.31mi |
| 2020 N 3rd St Apt 1 Harrisburg, PA | 1.0 | 1.0 | 850 | $1,095 | $1.29 | 23d | 1 | 1.36mi |
| 2020 N 3rd St Apt 7 Harrisburg, PA | 1.0 | 1.0 | 600 | $1,045 | $1.74 | 44d | 1 | 1.36mi |
| 420 Wiconisco St Apt 5 Harrisburg, PA | 2.0 | 1.0 | 628 | $995 | $1.58 | 44d | 1 | 1.36mi |
| 269 Peffer St Harrisburg, PA | 2.0 | 1.0 | 1000 | $1,195 | $1.20 | 44d | 1 | 1.39mi |
| 2609 N 5th St Harrisburg, PA | 2.0 | 1.0 | 809 | $1,525 | $1.89 | 23d | 1 | 1.39mi |
| 1823 N 2nd St Unit 1 Harrisburg, PA | 1.0 | 1.0 | 800 | $1,150 | $1.44 | 23d | 1 | 1.39mi |
| 1823 N 2nd St Unit 1 Harrisburg, PA | 1.0 | 1.0 | 1000 | $1,150 | $1.15 | 44d | 1 | 1.39mi |
| 1821 N 2nd St Unit 2 Harrisburg, PA | 2.0 | 1.0 | 1000 | $1,299 | $1.30 | 14d | 1 | 1.40mi |
| 2042 N 4th St Harrisburg, PA | 3.0 | 1.0 | 1090 | $1,400 | $1.28 | 44d | 1 | 1.44mi |
| 1839 Green St Harrisburg, PA | 1.0–2.0 | 1.0 | 815 | $1,595 | $1.96 | 14d | 1 | 1.44mi |
| 1701 N Front St Unit 1R Harrisburg, PA | 1.0 | 1.0 | 600 | $1,545 | $2.58 | 44d | 1 | 1.46mi |
| 1700 N 2nd St Apt 28 Harrisburg, PA | 2.0 | 1.0 | 720 | $1,095 | $1.52 | 44d | 1 | 1.48mi |
| 1700 N 2nd St Apt 4 Harrisburg, PA | 1.0 | 1.0 | 555 | $985 | $1.77 | 14d | 1 | 1.48mi |
| 1700 N 2nd St Apt 3 Harrisburg, PA | 1.0 | 1.0 | 565 | $1,095 | $1.94 | 23d | 1 | 1.48mi |
| 1700 N 2nd St Apt 6 Harrisburg, PA | 2.0 | 1.0 | 725 | $1,145 | $1.58 | 14d | 1 | 1.48mi |
| 1800 Green St Unit 5 Harrisburg, PA | 1.0 | 1.0 | 803 | $1,395 | $1.74 | 23d | 1 | 1.48mi |
Listing history 9 events
-
2026-03-20price $110,000
-
2026-02-14status Pending
-
2025-11-05price $175,000
-
2025-10-21price $185,000
-
2025-10-01$190,000 Active
-
2025-09-22historical $190,000
-
2017-04-24soldstatus $110,000
-
2017-04-21soldstatus $110,000 410-char remark
Show marketing remark (410 chars)
Lovely one floor living. Completely redone - new kitchen, flooring, paint, windows, patio door, deck, new appliances included -refrigerator, electric range, washer & dryer. Live in country setting with view of river in fall/winter. Public access at point. Own your own home instead of renting. Yard with pavilion, shed/garage has electric & AC wall unit. Take a look at all the new living features.
-
2016-10-16$110,000 410-char remark
Show marketing remark (410 chars)
Lovely one floor living. Completely redone - new kitchen, flooring, paint, windows, patio door, deck, new appliances included -refrigerator, electric range, washer & dryer. Live in country setting with view of river in fall/winter. Public access at point. Own your own home instead of renting. Yard with pavilion, shed/garage has electric & AC wall unit. Take a look at all the new living features.
ⓘ Source: listings_history table (triggers on properties + properties_extension) + one-shot
backfill from property_details.listing_events for pre-trigger history.
Tax reassessment forecast PA · Partial reset (capped growth)
- Current annual tax
- $1,908 · $159/mo
- Projected year-2 tax
- $1,908 · $159/mo
- Expected delta
- $0/yr ($0/mo · 0.0%)
ⓘ Screening estimate from a state-policy table — verify with the county assessor before closing.
Climate risk First Street
- Flood 1/10 Low FEMA zone X (unshaded) · 0% chance over 30 yrs
- Wildfire 1/10 Low
- Heat 5/10 Major 7 d/yr ≥101°F today · 14 d/yr by 30 yrs out
- Wind 3/10 Moderate 5% chance of damaging wind over 30 yrs
- Air quality 2/10 Low 1 unhealthy d/yr today · 3 by 30 yrs out
Nearby sold comps map
Loading sold comps map…
Walkable amenities ~0.75 mi
Loading nearby amenities…
Taxation est. · year 1
- Rental income
- $16,550
- − Mortgage interest
- −$6,162
- − Property taxes
- −$1,908
- − Insurance
- −$550
- − Repairs & maintenance
- −$1,324
- − Management
- −$1,324
- − Depreciation
- −$3,200
- Taxable income
- $2,082
- Est. tax owed @ 24.0%
- −$500
- After-tax cash flow
- $3,195/yr
For passive investors: Depreciation is non-cash, so a rental often shows a tax loss while cash-flowing — sheltering income. Rental losses are passive: they offset passive income freely, and up to $25,000/yr can offset ordinary (W-2) income if you actively participate and your MAGI is under $100k (phasing out to $0 by $150k); unused losses carry forward. On sale, claimed depreciation is recaptured at up to 25%, and gains may owe capital-gains tax (a 1031 exchange can defer both). Figures are a year-1 estimate at your 24.0% rate — not tax advice; consult a CPA.
Schools (NCES district)
- District
- East Pennsboro Area SD
- NCES district ID
- 4208580
- Math proficiency
- 30% ▼ -16.00%
- Reading proficiency
- 57% ▼ -8.00%
- Median HH income
- $60,120
- Composite
- 38.26/100
- National rank
- #4239
- State rank
- #275 of 539 in PA
Livability — West Fairview
- Score
- 77/100
- State rank
- #344
- US rank
- #3029
Category grades
Schools grade is shown separately in the Schools card above.
Census & demographics
- Census place
- West Fairview, PA
- County
- Cumberland County · 257,673 people
- Metro
- Harrisburg-Carlisle, PA
- Population (ZIP)
- 17,648
- Household income
- $91,285
- Rent vs Own
- Severe rent burden
- 317.0
Population outlook (Cumberland County) Hauer SSP2
- Today (2025)
- 267,950 people
- By 2030
- 278,105 · +3.8%
- By 2040
- 296,552 · +10.7%
- By 2050
- 312,937 · +16.8%
- By 2075
- 349,233 · +30.3%
- By 2100
- 361,875 · +35.1%
Race, ethnicity, and origin ACS 2023
- Neighborhood character
- Predominantly White (79%)
- Race & ethnicity
- White 79% Hispanic / Latino 6% Asian 6% Two or more races 6% Black 3%
- Hispanic origin (detail)
- Puerto Rican 2% Dominican 2%
- Common ancestry
- Romanian 3% Italian 2% Slovak 2%
- Foreign-born
- 8% · Canada, South Korea, Vietnam
- Languages at home
- 88% English-only · Other Indo-European 5% Spanish 4% Tagalog/Filipino 1%
Political lean MEDSL · Cumberland
- 2024 margin
- Lean R (+9.4) · D 44.6% · R 54.1% · Other 1.3%
- 2008→2024 swing
- +4.2pp toward D · 2008: -13.6pp · 2024: -9.4pp
- All cycles
- 2024: R+9.4 2020: R+10.6 2016: R+18.6 2012: R+18.5 2008: R+13.6
Not yet ingested
- Civics
- —
Market trends
- HPI YoY
- ▼ -85.21%
- Current HPI
- 251.939
- Rent YoY
- ▲ 6.46%
- Metro
- Harrisburg-Carlisle, PA
- State GDP YoY
- ▲ 1.68%
- F500 in state
- 34
Industry mix (Fortune 500 HQ in PA)
| Industry | F500 HQs | Revenue |
|---|---|---|
| Healthcare | 2 | $309B |
|
||
| Insurance | 2 | $27B |
|
||
| Telecommunications / Media | 1 | $124B |
|
||
| Industrial Distribution | 1 | $22B |
|
||
| Financial Services | 1 | $20B |
|
||
| Chemicals / Materials | 1 | $18B |
|
||
Price history
+0.0% since first listed9 events — show timeline
- 2026-03-20 Price Changed $110,000 BRIGHT MLS
- 2026-02-14 Pending — BRIGHT MLS
- 2025-11-05 Price Changed $175,000 BRIGHT MLS
- 2025-10-21 Price Changed $185,000 BRIGHT MLS
- 2025-10-01 Listed $190,000 BRIGHT MLS
- 2025-09-22 Coming Soon $190,000 BRIGHT MLS
- 2017-04-24 Sold (Public Records) $110,000 Public Records
- 2017-04-21 Sold (MLS) $110,000 BRIGHT MLS
- 2016-10-16 Listed $110,000 BRIGHT MLS
Property tax history
+22.1%/yrLatest (2026): $1,908 · +1.8% YoY. Source: county tax records.
Cash-flow waterfall
monthlySold comps — $/sqft
last 12 mo · ≤1 miLoading sold comps…