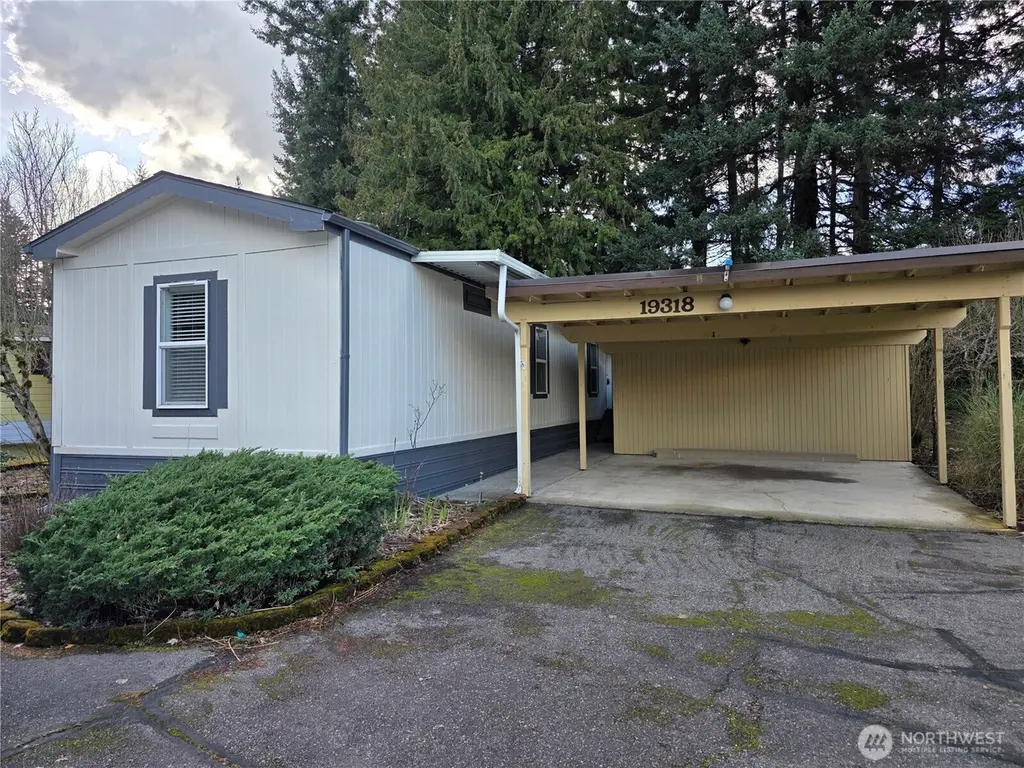
19318 99th Avenue Ct E #5 · South Hill, WA
Flood risk No data
- FEMA flood zone
- —
- Chance of flooding over 30 yrs
- —
- Est. flood insurance / yr
- —
Fire risk No data
- Est. fire insurance / yr
- —
Heat risk No data
- Hot days now (above threshold)
- —
- Hot days in 30 yrs
- —
Wind risk No data
- Chance of severe wind over 30 yrs
- —
Air-quality risk No data
- Unhealthy air days now
- —
- Unhealthy air days in 30 yrs
- —
Risk factors via First Street. Map © Google.
Why this score? — see what drove the B+ grade
The composite is a weighted blend of 9 inputs, each scored 0–100. Each bar is that input's sub-score; the figure is the points it added to the 100-point composite (weight × sub-score).
- Cash flow +30.0/30.0
- ARV discount +15.0/15.0
- 1% rule +10.0/10.0
- DSCR +10.0/10.0
- Schools +4.9/10.0
- Livability +4.0/5.0
- Rent growth +3.3/5.0
- Condition / age +2.5/5.0
- Appreciation +0.0/10.0
$79,950
🖨 Deal sheet 📄 Offer letter ✓ Due diligence
Listing remarks
UPDATED! MORDERN STYLE! MOVE IN READY! WARM/COZY home has 2 bedroom, 1.75 Bath, 2 Car Carport, located in wonderful Meridian Terrace 55+ Community. New Paint Exterior/Interior, New Laminate Floor (water proof) Kitchen update with Paint Cabinets and Beautiful Countertop in kitchen and Vanities. New Shower with Sliding Glass Door, Nice lot, big back yard and located at quite dead end Street. Home is set ready for Generator Electric, Closed to Shopping and all other services.
Key facts
- New paint exterior
- Kitchen update
- Beautiful countertop
Tags
Property features AI
Finance
- Other: Calculated building area: 980 (source: title)
- Financial info: Land lease: $980/month; Acceptable financing: Cash, Conventional
- HOA & community: Senior community; Manufactured home park with common area; Park approved for sale
Exterior
- Parking: Details not provided
- Security: Details not provided
- Utilities: Electric service
- Home design: Manufactured home (single wide); One story; Entry-level tie down foundation
- Construction: Wood construction; Composition roof; Manufactured house
- Exterior features: Wood exterior; Patio/Porch/Deck
Interior
- Kitchen: Dishwasher; Refrigerator; Stove/Range
- Bedrooms: 2 bedrooms
- Flooring: Laminate
- Bathrooms: 1 full bath; 1 three-quarter bath
- Heating & cooling: Ductless heating; Forced air heating; Cooling (type not specified)
- Interior features: Ceiling fans; Double pane windows; Patio/Porch/Deck; Tie down foundation
- Laundry & utility: Washer; Dryer; 1 storage space
Neighborhood map
What this means for you Summary
Snapshot
- This is a 2-bed/2.0-bath manufactured listed at $80k.
Deal economics
- At list price, monthly cash flow is $1k ($14k/yr) — positive.
- The deal already cash-flows at list — no discount required.
- Meets the 1% rule at list price ($2k rent vs $80k).
- Recommended offer: $73k (9.0% below list) — sets the bar for market timing.
- Cap rate 24.0% vs local median 3.0% in South Hill — top-decile yield for the area; either an underpriced asset or a hidden risk that comps aren't pricing in. Stress-test before assuming the spread holds.
Location & tenants
- Location reads 80/100 on livability (#84 in WA, #1,620 nationally) — a professional / high-income tenant draw. Strengths: employment A+, housing A+, health & safety A+; Watch: crime C-, schools D+, cost of living F.
- Bethel School District (suburban): math 47% / reading 59% proficiency, ranked #103 of 291 in WA (top 35%) — acceptable for families but not a draw, mixed tenant base, ~2y average lease.
- Market conditions: Rents rising (+3.3%/yr); 232 active listings in the ZIP; 7 comparable units currently listed for rent nearby; rentals leasing fast (median 2d on market — plan ~1-2 weeks tenant-placement turnaround); high-income renter base; 3,209 units permitted in Pierce County in 2024 (1,269 in 5+ unit buildings).
Forward outlook
- Local home prices are declining (-3.0%/yr); year-one equity from $552 of loan paydown is wiped out by about $2k of value loss. Plan a longer hold.
- Pierce County population projected at +26% by 2050 — long-run rental-demand tailwind backs the buy-and-hold thesis.
- At projected returns (-3.0% appreciation + 3.3% rent growth), your $22k cash investment doubles in ~2 years — after that, you're playing with house money.
Negotiation context
- It's been on market 95 days — a 9% lower offer ($73k) is reasonable based on typical stale-listing flexibility.
- 5 sale attempts since 10y ago; this cycle's ask has dropped $15k (16%) from the opening price — seller is motivated, your offer sets the floor, not the list.
- Current owner paid $42k; list at $80k implies a 93% gain — meaningful room to come down on a strong offer.
Questions for the listing agent
- It's been on market 95 days. Have you received any prior offers? Is the seller open to a 9% concession, seller financing, or rate buy-down credit?
- Why hasn't it sold? Are there any deal-killer items the seller is aware of (foundation, flood, title, zoning, code violations)?
- Is there a deadline driving the sale (1031 exchange, divorce, estate, relocation)? That informs how much negotiation room exists.
- Schools are D-rated, which usually means shorter tenancies and higher turnover. Who's the typical renter profile here, and what's been the actual vacancy rate?
- What's the average days-on-market for RENTAL listings here right now (not sales)? A rising rental-DOM trend means longer vacancies and softer asking-rent achievability than the comps imply.
- What's the recent tenant-quality profile in this submarket — average credit score on applications, eviction rate, late-payment / NSF rate, and stable-employment percentage? A property-management company in the area should have these aggregated.
- How much new for-sale + rental construction is in the pipeline within 1–3 miles? Heavy new supply typically softens prices + rents 12–24 months out; constrained supply supports both.
Investment metrics
- 1% rule
- 2.69% ✓
- Cap rate
- 24.03%
- Cash-on-cash
- 63.36%
- DSCR
- 3.82
- GRM
- 3.1
CMA / ARV
- ARV (on-the-fly)
- $105,336
- Comps found
- 1
Show comp detail 1 sale within ~0.75 mi
| Address | Dist | Beds/Ba | Sqft | Sold | Price | $/sf | Match |
|---|---|---|---|---|---|---|---|
| 19316 99th Avenue Ct E | 0.04mi | 2/2.0 | 1,012 (+10%) | 23mo | $115,000 | $114 | 63 |
Match score weights: distance 35% · size 25% · config 20% · recency 20%. Top-matched comps best support the ARV.
Projected returns pro-forma
-3.0% appreciation · 3.32% rent growth · sell at horizon
- IRR
- 62.7%
- Equity multiple
- 3.82×
- Total profit
- $63,028
- Equity at exit
- $11,921
- IRR
- 67.3%
- Equity multiple
- 7.91×
- Total profit
- $154,735
- Equity at exit
- $6,913
Cash invested: $22,386 (down + closing). Projections, not guarantees.
Landlord ↔ Tenant lean methodology
- Overall (STATE)
- 28 Tenant-Leaning
- State Washington
- 28 Tenant-Leaning · D+8
- County
- — inherits STATE
- City
- — inherits STATE
ZIP-level market 98338
- Rents YoY
- 3.3%
- Active inventory
- 232
- Price-to-rent
- 3.1×
Monthly cashflow live
- Estimated rent
- $2,153 high interval (Pro) →
- Mortgage (P&I)
- −$419
- Tax from tax record
- −$66 /mo · $798/yr
- Insurance
- −$33
- HOA
- −$0
- Vacancy / Maint / Mgmt
- −$452
- Net cashflow
- $1,182
Break-even live
UW: 25.0% down · 7.5% · 30yr · 1.5% tax · 5.0% vac · 8.0% maint · 8.0% mgmt
Financing live
Cash to close
- Down payment
- $19,988
- Closing costs
- $2,398
- Reserves months
- —
- Total cash needed
- —
Loan-product check · same deal, 3 products live
Conventional
25% down · 7.5% · 30yr
- Down + closing
- —
- Monthly P&I
- —
- Monthly cashflow
- —
- DSCR
- —
- Eligible?
- —
Personal DTI + credit; lowest rate.
DSCR
20% down · 8.5% · 30yr
- Down + closing
- —
- Monthly P&I
- —
- Monthly cashflow
- —
- DSCR
- —
- Eligible?
- —
No personal income docs; deal must DSCR.
Hard money
10% down · 12.0% · 12mo
- Down + closing
- —
- Monthly P&I
- —
- Monthly cashflow
- —
- DSCR
- —
- Eligible?
- —
Short-term bridge; refi at stabilization.
Rent comps 7 comps
| Address | Beds | Baths | Sqft | Rent | $/sqft | DOM | Units | Dist |
|---|---|---|---|---|---|---|---|---|
| 10234 194th St E Graham, WA | 2.0 | 1.0–2.5 | 1231 | $2,252 | $1.83 | 1d | 17 | 0.29mi |
| 10007 186th St E #234 Puyallup, WA | 2.0 | 2.0 | 1019 | $2,300 | $2.26 | 2d | 1 | 0.43mi |
| 18527 101st Ave Ct E Puyallup, WA | 2.0 | 2.0 | 1026 | $1,600 | $1.56 | 43d | 1 | 0.48mi |
| 10423 Rainier Ridge Blvd E Puyallup, WA | 1.0–3.0 | 1.0–2.0 | 1035 | $2,506 | $2.42 | 1d | 27 | 0.65mi |
| 9202 176th St E Puyallup, WA | 1.0–2.0 | 1.0–2.0 | 824 | $1,960 | $2.38 | 1d | 7 | 1.05mi |
| 17516 93rd Avenue Ct E Puyallup, WA | 1.0 | 1.0 | 917 | $900 | $0.98 | 43d | 1 | 1.16mi |
| 17718 85th Avenue Ct E Unit 17718-C Puyallup, WA | 2.0 | 1.5 | 916 | $1,525 | $1.66 | 21d | 1 | 1.27mi |
Listing history 29 events
-
2026-06-18days on market $79,950 Active 95 DOM
-
2026-06-17days on market $79,950 Active 94 DOM
-
2026-06-16days on market $79,950 Active 93 DOM
-
2026-06-15pricedays on market $79,950 Active 92 DOM
-
2026-06-13days on market $89,950 Active 90 DOM
-
2026-06-13days on market $89,950 Active 89 DOM
-
2026-06-09days on market $89,950 Active 86 DOM
-
2026-06-08days on market $89,950 Active 85 DOM
-
2026-06-07days on market $89,950 Active 84 DOM
-
2026-06-04days on market $89,950 Active 81 DOM
-
2026-06-03days on market $89,950 Active 80 DOM
-
2026-06-02days on market $89,950 Active 79 DOM
-
2026-06-01days on market $89,950 Active 78 DOM
-
2026-05-31days on market $89,950 Active 77 DOM
-
2026-05-24price $89,950
-
2026-03-15$94,950 Active
-
2020-05-13soldstatus $41,500 Sold
-
2020-04-19status Pending
-
2020-03-10$43,500 Active
-
2016-09-16historical
-
2016-09-13soldstatus $28,000 Sold
-
2016-08-31status Pending
-
2016-08-13status Pending Inspection
-
2016-08-05status Active
-
2016-08-04status Pending Inspection
-
2016-07-13price $28,000
-
2016-07-11status Active
-
2016-06-09status Pending Inspection
-
2016-05-11$32,500 Active
ⓘ Source: listings_history table (triggers on properties + properties_extension) + one-shot
backfill from property_details.listing_events for pre-trigger history.
Tax reassessment forecast WA · Resets to sale price
- Current annual tax
- $798 · $66/mo
- Projected year-2 tax
- $798 · $66/mo
- Expected delta
- $0/yr ($0/mo · 0.0%)
ⓘ Screening estimate from a state-policy table — verify with the county assessor before closing.
Nearby sold comps map
Loading sold comps map…
Walkable amenities ~0.75 mi
Loading nearby amenities…
Taxation est. · year 1
- Rental income
- $25,837
- − Mortgage interest
- −$4,478
- − Property taxes
- −$798
- − Insurance
- −$400
- − Repairs & maintenance
- −$2,067
- − Management
- −$2,067
- − Depreciation
- −$2,326
- Taxable income
- $13,702
- Est. tax owed @ 24.0%
- −$3,288
- After-tax cash flow
- $10,894/yr
For passive investors: Depreciation is non-cash, so a rental often shows a tax loss while cash-flowing — sheltering income. Rental losses are passive: they offset passive income freely, and up to $25,000/yr can offset ordinary (W-2) income if you actively participate and your MAGI is under $100k (phasing out to $0 by $150k); unused losses carry forward. On sale, claimed depreciation is recaptured at up to 25%, and gains may owe capital-gains tax (a 1031 exchange can defer both). Figures are a year-1 estimate at your 24.0% rate — not tax advice; consult a CPA.
Schools (NCES district)
- District
- Bethel School District
- NCES district ID
- 5300480
- Math proficiency
- 47% ▬ 0.00%
- Reading proficiency
- 59% ▲ 2.00%
- Median HH income
- $65,872
- Composite
- 48.66/100
- National rank
- #4568
- State rank
- #103 of 291 in WA
Livability — South Hill
- Score
- 80/100
- State rank
- #84
- US rank
- #1620
Category grades
Schools grade is shown separately in the Schools card above.
Census & demographics
- Census place
- South Hill, WA
- County
- Pierce County · 788,257 people
- City population
- 76,707
- Metro
- Seattle-Tacoma-Bellevue, WA
- Population (ZIP)
- 32,687
- Household income
- $114,819
- Rent vs Own
- Severe rent burden
- 236.0
Population outlook (Pierce County) Hauer SSP2
- Today (2025)
- 956,648 people
- By 2030
- 1,010,862 · +5.7%
- By 2040
- 1,113,170 · +16.4%
- By 2050
- 1,206,524 · +26.1%
- By 2075
- 1,436,425 · +50.2%
- By 2100
- 1,563,654 · +63.5%
Race, ethnicity, and origin ACS 2023
- Neighborhood character
- Predominantly White (71%)
- Race & ethnicity
- White 71% Two or more races 15% Hispanic / Latino 12% Asian 3% Black 3% Pacific Islander 2% Native American 1%
- Hispanic origin (detail)
- Mexican 7%
- Common ancestry
- Italian 4% Portuguese 4% Iranian 3%
- Foreign-born
- 7% · Canada, South Korea, China
- Languages at home
- 88% English-only · Spanish 5% Russian/Polish/Slavic 2% Other Asian/Pacific 1%
Political lean MEDSL · Pierce
- 2024 margin
- D (+10.8) · D 53.9% · R 43.1% · Other 3.0%
- 2008→2024 swing
- -1.4pp toward R · 2008: 12.2pp · 2024: 10.8pp
- All cycles
- 2024: D+10.8 2020: D+11.2 2016: D+7.5 2012: D+11.0 2008: D+12.2
Not yet ingested
- Civics
- —
Market trends
- HPI YoY
- ▼ -501.28%
- Current HPI
- 304.4241
- Rent YoY
- ▲ 3.32%
- Metro
- Seattle-Tacoma-Bellevue, WA
- State GDP YoY
- ▲ 4.65%
- F500 in state
- 22
Industry mix (Fortune 500 HQ in WA)
| Industry | F500 HQs | Revenue |
|---|---|---|
| Retail | 2 | $269B |
|
||
| Technology / Retail | 1 | $638B |
|
||
| Technology | 1 | $245B |
|
||
| Telecommunications | 1 | $38B |
|
||
| Food / Beverage | 1 | $36B |
|
||
| Automotive / Trucks | 1 | $34B |
|
||
Price history
+176.8% since first listed15 events — show timeline
- 2026-05-24 Price Changed $89,950 NWMLS as Distributed by MLS Grid
- 2026-03-15 Listed $94,950 NWMLS as Distributed by MLS Grid
- 2020-05-13 Sold (MLS) $41,500 NWMLS as Distributed by MLS Grid
- 2020-04-19 Pending — NWMLS as Distributed by MLS Grid
- 2020-03-10 Listed $43,500 NWMLS as Distributed by MLS Grid
- 2016-09-16 Delisted — NWMLS as Distributed by MLS Grid
- 2016-09-13 Sold (MLS) $28,000 NWMLS as Distributed by MLS Grid
- 2016-08-31 Pending — NWMLS as Distributed by MLS Grid
- 2016-08-13 Pending — NWMLS as Distributed by MLS Grid
- 2016-08-05 Relisted — NWMLS as Distributed by MLS Grid
- 2016-08-04 Pending — NWMLS as Distributed by MLS Grid
- 2016-07-13 Price Changed $28,000 NWMLS as Distributed by MLS Grid
- 2016-07-11 Relisted — NWMLS as Distributed by MLS Grid
- 2016-06-09 Pending — NWMLS as Distributed by MLS Grid
- 2016-05-11 Listed $32,500 NWMLS as Distributed by MLS Grid
Property tax history
+47.7%/yrLatest (2026): $798 · +13560.1% YoY. Source: county tax records.
Cash-flow waterfall
monthlySold comps — $/sqft
last 12 mo · ≤1 miLoading sold comps…