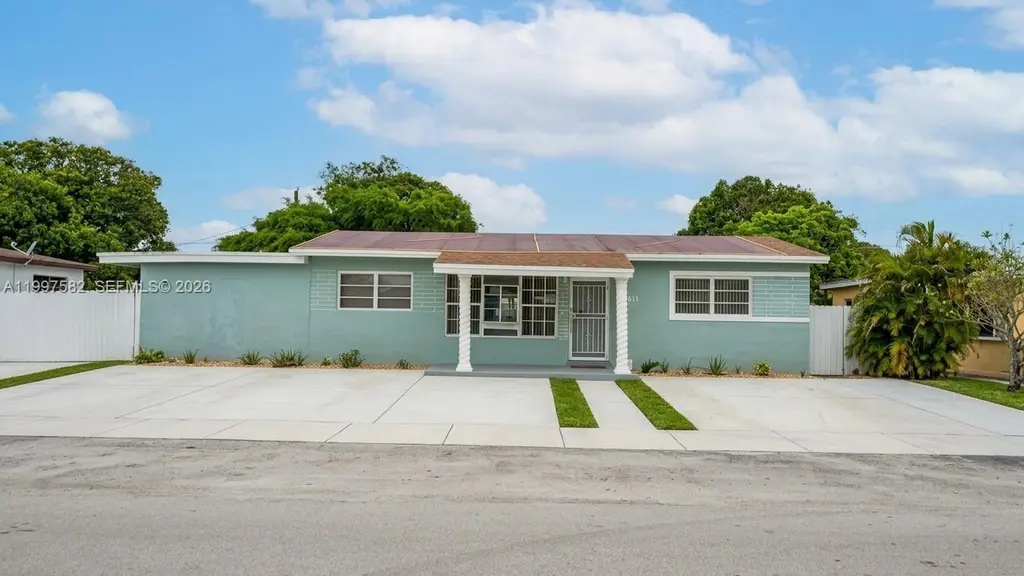
3421 NW 176th St · Miami Gardens, FL
Flood risk 6/10 · Moderate
- FEMA flood zone
- AE
- Chance of flooding over 30 yrs
- 0.92%
- Est. flood insurance / yr
- $1,737 – $8,500
Fire risk 1/10 · Minimal
- Est. fire insurance / yr
- $947 – $1,759
Heat risk 10/10 · Severe
- Hot days now (above 105°F)
- 7 days/yr
- Hot days in 30 yrs
- 27 days/yr
Wind risk 10/10 · Severe
- Chance of severe wind over 30 yrs
- 99.0%
Air-quality risk 2/10 · Minimal
- Unhealthy air days now
- 1 days/yr
- Unhealthy air days in 30 yrs
- 2 days/yr
Risk factors via First Street. Map © Google.
Why this score? — see what drove the C- grade
The composite is a weighted blend of 9 inputs, each scored 0–100. Each bar is that input's sub-score; the figure is the points it added to the 100-point composite (weight × sub-score).
- Cash flow +18.8/30.0
- ARV discount +7.5/15.0
- 1% rule +7.1/10.0
- DSCR +5.9/10.0
- Schools +4.2/10.0
- Rent growth +3.8/5.0
- Livability +3.6/5.0
- Condition / age +2.5/5.0
- Appreciation +0.0/10.0
$280,000
🖨 Deal sheet (PDF) 📄 Offer letter ✓ Due diligence
Listing remarks
Spacious 4-bedroom, 3-bathroom home located in a prime Miami Gardens location! This property offers great potential for customization and value enhancement, featuring a generous layout with ample living space. Perfectly situated near major roads, shopping, and dining, this home combines convenience with opportunity, ideal for homeowners or investors alike. The seller does not accept blind offers or escalation clauses.
Key facts
- 8,250 sq ft lot
- Garage
- Built 1956
Neighborhood map
What this means for you Summary
Snapshot
- This is a 4-bed/2.0-bath single-family listed at $280k.
Deal economics
- At list price, monthly cash flow is $-145 ($-2k/yr) — negative.
- To cash-flow at today's rent, offer at most $254k (9.1% below list).
- Meets the 1% rule at list price ($3k rent vs $280k).
- Recommended offer: $254k (9.1% below list) — sets the bar for cash-flow.
- Cap rate 7.5% vs local median 3.1% in Miami Gardens — top-decile yield for the area; either an underpriced asset or a hidden risk that comps aren't pricing in. Stress-test before assuming the spread holds.
Location & tenants
- Location reads 72/100 on livability (#338 in FL) — a middle-class / working-renter tenant base. Strengths: commute A+, housing A+, health & safety A+; Watch: employment D+, crime D-, amenities F.
- Miami-Dade (suburban): math 45% / reading 54% proficiency, ranked #40 of 73 in FL (top 55%) — families likely to look elsewhere, expect single-tenant / working-renter base with shorter leases; 64% free/reduced lunch — lower-income household profile, screen leases tightly.
- Zoned schools: Myrtle Grove K-8 Center (math 46% / reading 25%, grade F, #1,684 of 2,144 statewide, top 79%, 296 students, 85% FRL); Carol City Middle School (math 32% / reading 34%, grade F, #437 of 571 statewide, top 77%, 453 students, 76% FRL); Miami Carol City Senior High (math 8% / reading 16%, grade F, #622 of 667 statewide, top 93%, 804 students, 80% FRL) — zoned schools average 80% FRL vs 64% district-wide (16 pts higher); higher-poverty schools than district average — tighter screening recommended.
- Zoned-school proficiency averages 27% at this address vs 50% district-wide (-23 pts) — the specific schools serving this property underperform the Miami-Dade average; the district grade overstates school quality for this exact location.
- Market conditions: Rents rising fast (+5.3%/yr); 113 active listings in the ZIP; 10,051 units permitted in Miami-Dade County in 2024 (7,758 in 5+ unit buildings).
Forward outlook
- Local home prices are declining (-3.0%/yr); year-one equity from $2k of loan paydown is wiped out by about $8k of value loss. Plan a longer hold.
- Miami-Dade County population projected at +28% by 2050 — long-run rental-demand tailwind backs the buy-and-hold thesis.
Negotiation context
- Only 13 days on market — expect competitive offers; lowballing is unlikely to land.
- 11 sale attempts since 2y ago with the ask held roughly flat each time — persistent listings suggest the price (not the market) is what's stuck; bring a comps-based counter.
- Current owner paid $31k; list at $280k implies a 803% gain — meaningful room to come down on a strong offer.
Risks & watch-outs
- Watch-outs: property tax is 3.5% of price; flood insurance adds $427/mo; built in 1956 — expect roof / HVAC / electrical / plumbing capex.
- Climate carrying-cost: in FEMA flood zone AE (mandatory federal flood insurance); severe wind risk, 99% chance of damaging wind over 30y; extreme-heat days projected 7→27/yr by 2055 (HVAC capex compounding) — expect insurance premiums to compound above CPI over the hold.
Questions for the listing agent
- What do current leases actually rent for vs. the listed asking? Can we see a recent rent roll and the last 12 months of T-12 income?
- Built in 1956 — when were the roof, HVAC, electrical panel, plumbing, and water heater last replaced?
- Property tax is high relative to price — has the assessment been appealed recently, and will the sale trigger a re-assessment?
- What's the actual annual flood-insurance premium (NFIP or private), and is the property in a SFHA with mandatory coverage?
- Is there a deadline driving the sale (1031 exchange, divorce, estate, relocation)? That informs how much negotiation room exists.
- Crime grade is D in this area — have there been break-ins, vandalism, or insurance claims at this property in the last 3 years? What carrier currently insures it and at what premium?
- What's the average days-on-market for RENTAL listings here right now (not sales)? A rising rental-DOM trend means longer vacancies and softer asking-rent achievability than the comps imply.
- What's the recent tenant-quality profile in this submarket — average credit score on applications, eviction rate, late-payment / NSF rate, and stable-employment percentage? A property-management company in the area should have these aggregated.
- How much new for-sale + rental construction is in the pipeline within 1–3 miles? Heavy new supply typically softens prices + rents 12–24 months out; constrained supply supports both.
Investment metrics
- 1% rule
- 1.21% ✓
- Cap rate
- 7.50%
- Cash-on-cash
- 4.32%
- DSCR
- 1.19
- GRM
- 6.9
CMA / ARV
- ARV (on-the-fly)
- $590,196
- Comps found
- 6
Show comp detail 6 sales within ~0.75 mi
| Address | Dist | Beds/Ba | Sqft | Sold | Price | $/sf | Match |
|---|---|---|---|---|---|---|---|
| 3950 NW 175th St | 0.54mi | 4/2.0 | 1,750 (+6%) | 15mo | $550,000 | $314 | 52 |
| 17721 NW 37th Ct | 0.26mi | 4/3.5 | 1,518 (-8%) | 24mo | $565,000 | $372 | 49 |
| 3081 NW 183rd St | 0.56mi | 4/2.0 | 1,701 (+4%) | 23mo | $595,000 | $350 | 49 |
| 17201 NW 42nd Ave | 0.70mi | 3/2.0 (-1) | 1,502 (-9%) | 2mo | $615,000 | $409 | 46 |
| 2910 NW 175th St | 0.57mi | 3/1.0 (-1) | 1,472 (-10%) | 2mo | $400,000 | $272 | 46 |
| 17720 Myrtle Lake Dr | 0.68mi | 4/2.0 | 1,813 (+10%) | 12mo | $650,000 | $359 | 41 |
Match score weights: distance 35% · size 25% · config 20% · recency 20%. Top-matched comps best support the ARV.
Projected returns pro-forma
-3.0% appreciation · 5.29% rent growth · sell at horizon
- IRR
- -16.0%
- Equity multiple
- 0.41×
- Total profit
- $-45,969
- Equity at exit
- $41,749
- IRR
- -2.5%
- Equity multiple
- 0.81×
- Total profit
- $-15,007
- Equity at exit
- $24,209
Cash invested: $78,400 (down + closing). Projections, not guarantees.
Landlord ↔ Tenant lean methodology
- Overall (STATE)
- 87 Strongly Landlord-Friendly
- State Florida
- 87 Strongly Landlord-Friendly · R+3
- County
- — inherits STATE
- City
- — inherits STATE
ZIP-level market 33056
- Home prices YoY
- -19.0%
- Rents YoY
- 5.3%
- Active inventory
- 113
- Price-to-rent
- 6.9×
Monthly cashflow live
- Estimated rent
- $3,398 medium interval (Pro) →
- Mortgage (P&I)
- −$1,468
- Tax from tax record
- −$817 /mo · $9,805/yr
- Insurance
- −$117
- Flood insurance flood zone
- −$427 /mo · $5,118/yr
- HOA
- −$0
- Vacancy / Maint / Mgmt
- −$713
- Net cashflow
- $-145
Break-even live
Sensitivity live
| Price | -10% $14 | -5% $-65 | +0% $-145 | +5% $-224 | +10% $-303 |
|---|---|---|---|---|---|
| Rent | -10% $-413 | -5% $-279 | +0% $-145 | +5% $-10 | +10% $124 |
| Rate | -1.0pp $-4 | -0.5pp $-73 | base $-145 | +0.5pp $-217 | +1.0pp $-291 |
UW: 25.0% down · 7.5% · 30yr · 1.5% tax · 5.0% vac · 8.0% maint · 8.0% mgmt
Financing live
Cash to close
- Down payment
- $70,000
- Closing costs
- $8,400
- Reserves months
- —
- Total cash needed
- —
Loan-product check · same deal, 3 products live
Conventional
25% down · 7.5% · 30yr
- Down + closing
- —
- Monthly P&I
- —
- Monthly cashflow
- —
- DSCR
- —
- Eligible?
- —
Personal DTI + credit; lowest rate.
DSCR
20% down · 8.5% · 30yr
- Down + closing
- —
- Monthly P&I
- —
- Monthly cashflow
- —
- DSCR
- —
- Eligible?
- —
No personal income docs; deal must DSCR.
Hard money
10% down · 12.0% · 12mo
- Down + closing
- —
- Monthly P&I
- —
- Monthly cashflow
- —
- DSCR
- —
- Eligible?
- —
Short-term bridge; refi at stabilization.
Listing history 16 events
-
2026-04-21status Pending
-
2026-04-08$280,000 Active
-
2025-01-14historical
-
2025-01-14historical
-
2024-12-23status Active
-
2024-11-25status Active
-
2024-10-31status Active
-
2024-09-22status Active
-
2024-08-12status Active
-
2024-07-29status Active
-
2024-07-12status Active
-
2024-06-30status Active
-
2024-06-10price $495,000
-
2024-04-29$605,000 Active
-
2024-04-08$173,850
-
1977-07-01soldstatus $31,000
ⓘ Source: listings_history table (triggers on properties + properties_extension) + one-shot
backfill from property_details.listing_events for pre-trigger history.
Tax reassessment forecast FL · Resets to sale price
- Current annual tax
- $9,805 · $817/mo
- Projected year-2 tax
- $9,805 · $817/mo
- Expected delta
- $0/yr ($0/mo · 0.0%)
ⓘ Screening estimate from a state-policy table — verify with the county assessor before closing.
Climate risk First Street
- Flood 6/10 Major FEMA zone AE · 92% chance over 30 yrs
- Wildfire 1/10 Low
- Heat 10/10 Extreme 7 d/yr ≥105°F today · 27 d/yr by 30 yrs out
- Wind 10/10 Extreme 99% chance of damaging wind over 30 yrs
- Air quality 2/10 Low 1 unhealthy d/yr today · 2 by 30 yrs out
Nearby sold comps map
Loading sold comps map…
Walkable amenities ~0.75 mi
Loading nearby amenities…
Taxation est. · year 1
- Rental income
- $40,771
- − Mortgage interest
- −$15,684
- − Property taxes
- −$9,805
- − Insurance
- −$6,518
- − Repairs & maintenance
- −$3,262
- − Management
- −$3,262
- − Depreciation
- −$8,145
- Taxable loss
- −$5,905
- Est. tax savings @ 24.0%
- +$1,417
- After-tax cash flow
- $-317/yr
For passive investors: Depreciation is non-cash, so a rental often shows a tax loss while cash-flowing — sheltering income. Rental losses are passive: they offset passive income freely, and up to $25,000/yr can offset ordinary (W-2) income if you actively participate and your MAGI is under $100k (phasing out to $0 by $150k); unused losses carry forward. On sale, claimed depreciation is recaptured at up to 25%, and gains may owe capital-gains tax (a 1031 exchange can defer both). Figures are a year-1 estimate at your 24.0% rate — not tax advice; consult a CPA.
Schools (NCES district)
- District
- Miami-Dade
- NCES district ID
- 1200390
- Math proficiency
- 45% ▼ -16.00%
- Reading proficiency
- 54% ▼ -5.00%
- Median HH income
- $43,928
- Composite
- 41.76/100
- National rank
- #3397
- State rank
- #40 of 73 in FL
Livability — Miami Gardens
- Score
- 72/100
- State rank
- #338
- US rank
- #5854
Category grades
Schools grade is shown separately in the Schools card above.
Census & demographics
- Census place
- Miami Gardens, FL
- County
- Miami-Dade County · 2,697,751 people
- City population
- 81,592
- Metro
- Miami-Fort Lauderdale-Pompano Beach, FL
- Population (ZIP)
- 37,890
- Household income
- $68,583
- Rent vs Own
- Severe rent burden
- 1192.0
Population outlook (Miami-Dade County) Hauer SSP2
- Today (2025)
- 3,126,439 people
- By 2030
- 3,325,765 · +6.4%
- By 2040
- 3,697,561 · +18.3%
- By 2050
- 4,012,134 · +28.3%
- By 2075
- 4,605,612 · +47.3%
- By 2100
- 4,866,598 · +55.7%
Race, ethnicity, and origin ACS 2023
- Neighborhood character
- Majority Black (65%)
- Race & ethnicity
- Black 65% Hispanic / Latino 31% Two or more races 20% White 1%
- Hispanic origin (detail)
- Puerto Rican 3% Cuban 15% Dominican 3%
- Common ancestry
- Hispanic 7%
- Foreign-born
- 33% · Canada, Jamaica
- Languages at home
- 62% English-only · Spanish 30% French/Haitian/Cajun 7% Arabic 1%
Political lean MEDSL · Miami-Dade
- 2024 margin
- R (+11.4) · D 43.9% · R 55.4%
- 2008→2024 swing
- -27.6pp toward R · 2008: 16.1pp · 2024: -11.4pp
- All cycles
- 2024: R+11.4 2020: D+7.3 2016: D+29.6 2012: D+23.7 2008: D+16.1
Not yet ingested
- Civics
- —
Market trends
- HPI YoY
- ▼ -143.19%
- Current HPI
- 609.9947
- Rent YoY
- ▲ 5.29%
- Metro
- Miami-Fort Lauderdale-Pompano Beach, FL
- State GDP YoY
- ▲ 3.28%
- F500 in state
- 36
Industry mix (Fortune 500 HQ in FL)
| Industry | F500 HQs | Revenue |
|---|---|---|
| Industrial Technology | 2 | $29B |
|
||
| Insurance | 2 | $17B |
|
||
| Retail | 1 | $60B |
|
||
| Technology Distribution | 1 | $58B |
|
||
| Homebuilding | 1 | $35B |
|
||
| Technology Manufacturing | 1 | $35B |
|
||
Price history
+803.2% since first listed16 events — show timeline
- 2026-04-21 Pending — MARMLS
- 2026-04-08 Listed $280,000 MARMLS
- 2025-01-14 Listing Removed — MARMLS
- 2025-01-14 Listing Removed — MARMLS
- 2024-12-23 Relisted — MARMLS
- 2024-11-25 Relisted — MARMLS
- 2024-10-31 Relisted — MARMLS
- 2024-09-22 Relisted — MARMLS
- 2024-08-12 Relisted — MARMLS
- 2024-07-29 Relisted — MARMLS
- 2024-07-12 Relisted — MARMLS
- 2024-06-30 Relisted — MARMLS
- 2024-06-10 Price Changed $495,000 MARMLS
- 2024-04-29 Listed $605,000 MARMLS
- 2024-04-08 Listed $173,850 MARMLS
- 1977-07-01 Sold (Public Records) $31,000 Public Records
Property tax history
+17.6%/yrLatest (2025): $9,805 · +2.2% YoY. Source: county tax records.
Cash-flow waterfall
monthlySold comps — $/sqft
last 12 mo · ≤1 miLoading sold comps…