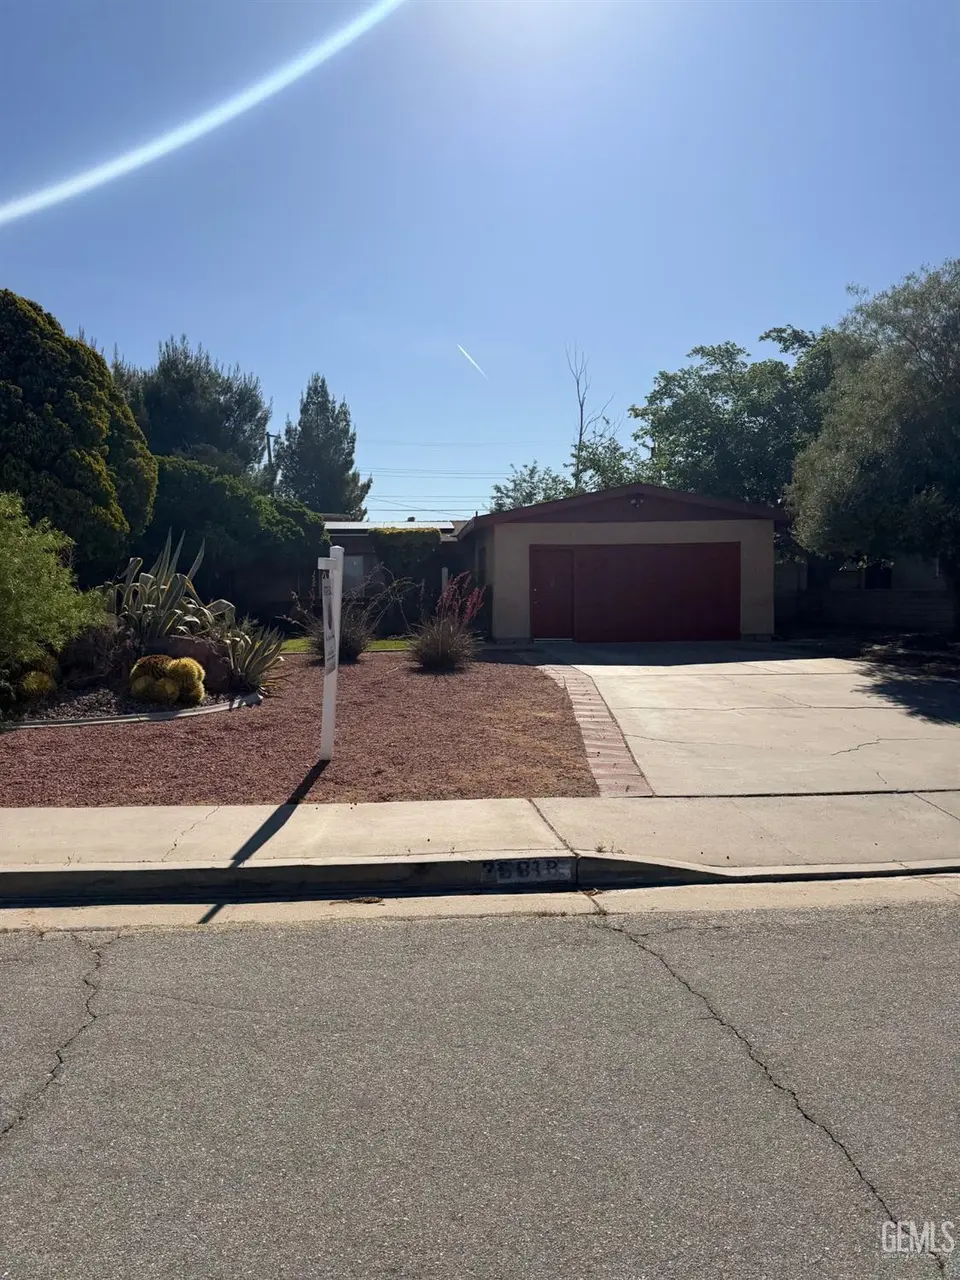
25918 Cherryhill Dr · Boron, CA
Flood risk 1/10 · Minimal
- FEMA flood zone
- X (unshaded)
- Chance of flooding over 30 yrs
- 0.0%
- Est. flood insurance / yr
- $507 – $1,088
Fire risk 4/10 · Minor
- Est. fire insurance / yr
- $659 – $1,223
Heat risk 8/10 · Major
- Hot days now (above 101°F)
- 7 days/yr
- Hot days in 30 yrs
- 19 days/yr
Wind risk 1/10 · Minimal
- Chance of severe wind over 30 yrs
- —
Air-quality risk 6/10 · Moderate
- Unhealthy air days now
- 9 days/yr
- Unhealthy air days in 30 yrs
- 12 days/yr
Risk factors via First Street. Map © Google.
Why this score? — see what drove the C- grade
The composite is a weighted blend of 9 inputs, each scored 0–100. Each bar is that input's sub-score; the figure is the points it added to the 100-point composite (weight × sub-score).
- Cash flow +16.3/30.0
- ARV discount +14.2/15.0
- DSCR +5.1/10.0
- 1% rule +3.6/10.0
- Appreciation +3.3/10.0
- Livability +2.8/5.0
- Schools +2.6/10.0
- Rent growth +2.5/5.0
- Condition / age +2.5/5.0
$210,000
🖨 Deal sheet 📄 Offer letter ✓ Due diligence
Listing remarks
Charming 3 bedroom, 2 bath home located in a great neighborhood in Boron! Featuring an open floor plan with plenty of space to make it your own, this home offers a spacious layout, updated layout, a bonus room perfect for an office, playroom, or additional living area, and a large backyard with endless possibilities for entertaining, gardening, or relaxing. While it could use some updating, it's full of potential and ready for your personal touch. Great opportunity to create your dream home!
Key facts
- Open floor plan
- Large backyard
- Bonus room
Tags
Property features AI
Finance
- Other: Property occupied by owner; Cross street: Park Knolls Blvd; Lot size about 0.3 acres
- HOA & community: HOA fee $60 monthly; HOA name: TBD
Exterior
- Utilities: Sewer service
- Home design: Single-family zoning (R1)
- Construction: Composition roof; Slab foundation; Leased solar
- Exterior features: Covered patio; Accessory unit; Community pool
Interior
- Kitchen: Dishwasher
- Bathrooms: 2 full bathrooms
- Heating & cooling: Central heating; Central air conditioning
- Interior features: Formal living room; Great room; Breakfast area; Bonus room; One fireplace
Neighborhood map
What this means for you Summary
Snapshot
- This is a 3-bed/2.0-bath single-family listed at $210k.
Deal economics
- At list price, monthly cash flow is $117 ($1k/yr) — positive.
- The deal already cash-flows at list — no discount required.
- To meet the 1% rule (rent ≥ 1% of price), the offer needs to be $181k (13.7% below list).
- Recommended offer: $181k (13.7% below list) — sets the bar for 1% rule.
Location & tenants
- Location reads 55/100 on livability (#857 in CA) — a working-class tenant base; expect higher turnover. Strengths: housing A+, cost of living A; Watch: schools F, amenities F, commute F.
- Muroc Joint Unified (rural): math 22% / reading 39% proficiency, ranked #340 of 517 in CA (top 66%) — families likely to look elsewhere, expect single-tenant / working-renter base with shorter leases.
- Market conditions: 104 active listings in the ZIP; 3,244 units permitted in Kern County in 2024 (73 in 5+ unit buildings).
Forward outlook
- Local home prices are declining (-3.0%/yr); year-one equity from $1k of loan paydown is wiped out by about $6k of value loss. Plan a longer hold.
- Kern County population projected at +17% by 2050 — long-run rental-demand tailwind backs the buy-and-hold thesis.
Negotiation context
- It's been on market 34 days — a 3% lower offer ($204k) is reasonable based on typical stale-listing flexibility.
Risks & watch-outs
- Watch-outs: built in 1958 — expect roof / HVAC / electrical / plumbing capex.
- Climate carrying-cost: extreme-heat days projected 7→19/yr by 2055 (HVAC capex compounding) — expect insurance premiums to compound above CPI over the hold.
Questions for the listing agent
- It's been on market 34 days. Have you received any prior offers? Is the seller open to a 14% concession, seller financing, or rate buy-down credit?
- Built in 1958 — when were the roof, HVAC, electrical panel, plumbing, and water heater last replaced?
- What does the HOA fee cover, when was the last increase, and are there any pending special assessments or reserve-fund shortfalls?
- Is there a deadline driving the sale (1031 exchange, divorce, estate, relocation)? That informs how much negotiation room exists.
- Schools are F-rated, which usually means shorter tenancies and higher turnover. Who's the typical renter profile here, and what's been the actual vacancy rate?
- What's the average days-on-market for RENTAL listings here right now (not sales)? A rising rental-DOM trend means longer vacancies and softer asking-rent achievability than the comps imply.
- What's the recent tenant-quality profile in this submarket — average credit score on applications, eviction rate, late-payment / NSF rate, and stable-employment percentage? A property-management company in the area should have these aggregated.
- How much new for-sale + rental construction is in the pipeline within 1–3 miles? Heavy new supply typically softens prices + rents 12–24 months out; constrained supply supports both.
Investment metrics
- 1% rule
- 0.86% ✗
- Cap rate
- 6.96%
- Cash-on-cash
- 2.39%
- DSCR
- 1.11
- GRM
- 9.7
CMA / ARV
- ARV (median comp)
- $247,000
- List price
- $210,000
- Delta
- -14.98%
- Verdict
- UNDERPRICED
- Comps
- 3 within 1.0 mi
Show comp detail 1 sale within ~0.75 mi
| Address | Dist | Beds/Ba | Sqft | Sold | Price | $/sf | Match |
|---|---|---|---|---|---|---|---|
| 25807 Cherryhill Dr | 0.27mi | 3/2.0 | 1,377 (-14%) | 4mo | $247,000 | $179 | 61 |
Match score weights: distance 35% · size 25% · config 20% · recency 20%. Top-matched comps best support the ARV.
Projected returns pro-forma
-3.0% appreciation · 3.0% rent growth · sell at horizon
- IRR
- -12.5%
- Equity multiple
- 0.55×
- Total profit
- $-26,621
- Equity at exit
- $31,312
- IRR
- -3.5%
- Equity multiple
- 0.77×
- Total profit
- $-13,799
- Equity at exit
- $18,157
Cash invested: $58,800 (down + closing). Projections, not guarantees.
Landlord ↔ Tenant lean methodology
- Overall (STATE)
- 18 Strongly Tenant-Friendly
- State California
- 18 Strongly Tenant-Friendly · D+13
- County
- — inherits STATE
- City
- — inherits STATE
ZIP-level market 93516
- Home prices YoY
- -1.2%
- Active inventory
- 104
- Price-to-rent
- 9.7×
Monthly cashflow live
- Estimated rent
- $1,813 medium interval (Pro) →
- Mortgage (P&I)
- −$1,101
- Tax from tax record
- −$66 /mo · $793/yr
- Insurance
- −$88
- HOA
- −$60
- Vacancy / Maint / Mgmt
- −$381
- Net cashflow
- $117
Break-even live
UW: 25.0% down · 7.5% · 30yr · 1.5% tax · 5.0% vac · 8.0% maint · 8.0% mgmt
Financing live
Cash to close
- Down payment
- $52,500
- Closing costs
- $6,300
- Reserves months
- —
- Total cash needed
- —
Loan-product check · same deal, 3 products live
Conventional
25% down · 7.5% · 30yr
- Down + closing
- —
- Monthly P&I
- —
- Monthly cashflow
- —
- DSCR
- —
- Eligible?
- —
Personal DTI + credit; lowest rate.
DSCR
20% down · 8.5% · 30yr
- Down + closing
- —
- Monthly P&I
- —
- Monthly cashflow
- —
- DSCR
- —
- Eligible?
- —
No personal income docs; deal must DSCR.
Hard money
10% down · 12.0% · 12mo
- Down + closing
- —
- Monthly P&I
- —
- Monthly cashflow
- —
- DSCR
- —
- Eligible?
- —
Short-term bridge; refi at stabilization.
HOA detail
- Monthly dues
- $60 · $720/yr
Listing history 10 events
-
2026-06-13statusdays on market $210,000 Pending 34 DOM
-
2026-06-09days on market $210,000 Active 32 DOM
-
2026-06-08days on market $210,000 Active 31 DOM
-
2026-06-07pricedays on market $210,000 Active 30 DOM
-
2026-06-04days on market $220,000 Active 27 DOM
-
2026-06-03days on market $220,000 Active 26 DOM
-
2026-06-02days on market $220,000 Active 25 DOM
-
2026-06-01days on market $220,000 Active 24 DOM
-
2026-05-31days on market $220,000 Active 23 DOM
-
2026-05-08$220,000 Active 496-char remark
ⓘ Source: listings_history table (triggers on properties + properties_extension) + one-shot
backfill from property_details.listing_events for pre-trigger history.
Tax reassessment forecast CA · Resets to sale price
- Current annual tax
- $793 · $66/mo
- Projected year-2 tax
- $1,596 · $133/mo
- Expected delta
- +$803/yr (+$67/mo · 101.3%)
ⓘ Screening estimate from a state-policy table — verify with the county assessor before closing.
Climate risk First Street
- Flood 1/10 Low FEMA zone X (unshaded) · 0% chance over 30 yrs
- Wildfire 4/10 Moderate
- Heat 8/10 Severe 7 d/yr ≥101°F today · 19 d/yr by 30 yrs out
- Wind 1/10 Low
- Air quality 6/10 Major 9 unhealthy d/yr today · 12 by 30 yrs out
Nearby sold comps map
Loading sold comps map…
Walkable amenities ~0.75 mi
Loading nearby amenities…
Taxation est. · year 1
- Rental income
- $21,753
- − Mortgage interest
- −$11,763
- − Property taxes
- −$793
- − Insurance
- −$1,050
- − Repairs & maintenance
- −$1,740
- − Management
- −$1,740
- − HOA
- −$720
- − Depreciation
- −$6,109
- Taxable loss
- −$2,163
- Est. tax savings @ 24.0%
- +$519
- After-tax cash flow
- $1,926/yr
For passive investors: Depreciation is non-cash, so a rental often shows a tax loss while cash-flowing — sheltering income. Rental losses are passive: they offset passive income freely, and up to $25,000/yr can offset ordinary (W-2) income if you actively participate and your MAGI is under $100k (phasing out to $0 by $150k); unused losses carry forward. On sale, claimed depreciation is recaptured at up to 25%, and gains may owe capital-gains tax (a 1031 exchange can defer both). Figures are a year-1 estimate at your 24.0% rate — not tax advice; consult a CPA.
Schools (NCES district)
- District
- Muroc Joint Unified
- NCES district ID
- 0626490
- Math proficiency
- 22% ▼ -13.00%
- Reading proficiency
- 39% ▼ -9.00%
- Median HH income
- $47,457
- Composite
- 26.31/100
- National rank
- #7241
- State rank
- #340 of 517 in CA
Livability — Boron
- Score
- 55/100
- State rank
- #857
- US rank
- #23452
Category grades
Schools grade is shown separately in the Schools card above.
Census & demographics
- Census place
- Boron, CA
- City population
- 2,742
- Population (ZIP)
- 2,742
Population outlook (Kern County) Hauer SSP2
- Today (2025)
- 947,286 people
- By 2030
- 978,984 · +3.3%
- By 2040
- 1,045,018 · +10.3%
- By 2050
- 1,105,232 · +16.7%
- By 2075
- 1,229,538 · +29.8%
- By 2100
- 1,238,059 · +30.7%
Race, ethnicity, and origin ACS 2023
- Neighborhood character
- Diverse neighborhood (Simpson 0.69)
- Race & ethnicity
- White 43% Hispanic / Latino 35% Two or more races 20% Black 5% Native American 4% Asian 4%
- Hispanic origin (detail)
- Mexican 23% Dominican 5%
- Common ancestry
- Italian 6% Iranian 2% Slovak 1%
- Foreign-born
- 8% · Canada
- Languages at home
- 71% English-only · Spanish 26% Tagalog/Filipino 2%
Political lean MEDSL · Kern
- 2024 margin
- Strong R (+21.1) · D 38.2% · R 59.3% · Other 2.5%
- 2008→2024 swing
- -3.3pp toward R · 2008: -17.8pp · 2024: -21.1pp
- All cycles
- 2024: R+21.1 2020: R+10.2 2016: R+15.0 2012: R+20.9 2008: R+17.8
Not yet ingested
- Civics
- —
Market trends
- HPI YoY
- ▼ -3.49%
- Current HPI
- 296.934
- Rent YoY
- —
- Metro
- —
- State GDP YoY
- ▲ 3.21%
- F500 in state
- 116
Industry mix (Fortune 500 HQ in CA)
| Industry | F500 HQs | Revenue |
|---|---|---|
| Technology | 27 | $1,492B |
|
||
| Financial Services | 3 | $174B |
|
||
| Retail | 3 | $44B |
|
||
| Insurance | 3 | $26B |
|
||
| Media / Entertainment | 2 | $115B |
|
||
| Pharmaceuticals / Biotech | 2 | $62B |
|
||
Price history
-4.5% since first listed3 events — show timeline
- 2026-06-11 Pending — GEMLS
- 2026-06-04 Price Changed $210,000 GEMLS
- 2026-05-08 Listed $220,000 GEMLS
Property tax history
+3.7%/yrLatest (2025): $793 · -0.4% YoY. Source: county tax records.
Cash-flow waterfall
monthlySold comps — $/sqft
last 12 mo · ≤1 miLoading sold comps…