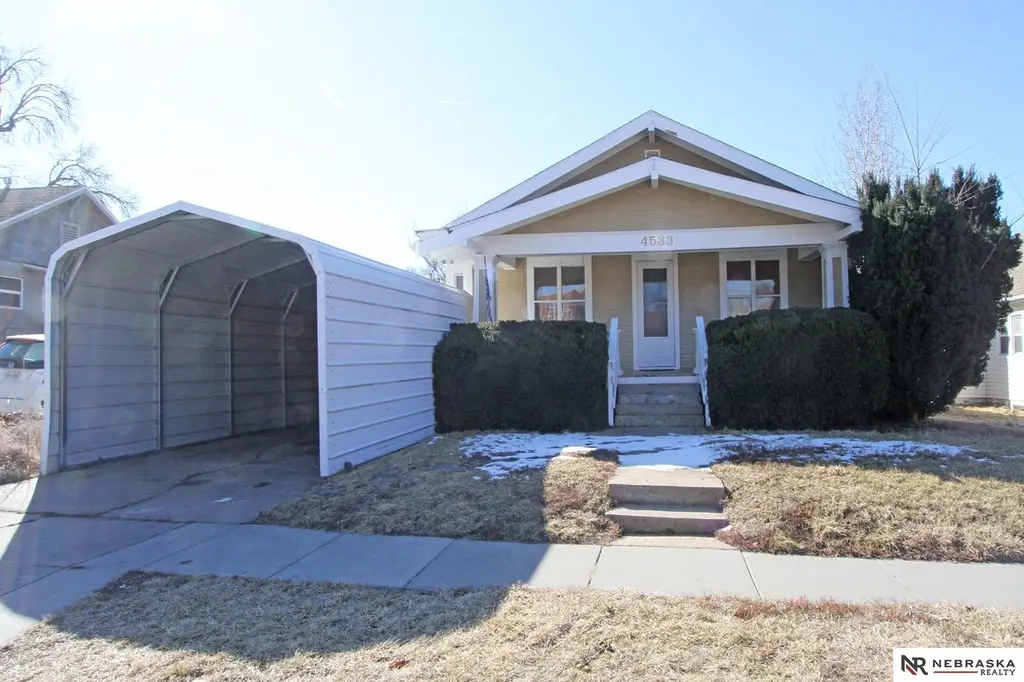
4533 Stockwell St · Lincoln, NE
Flood risk 1/10 · Minimal
- FEMA flood zone
- X (unshaded)
- Chance of flooding over 30 yrs
- 0.0%
- Est. flood insurance / yr
- $473 – $860
Fire risk 1/10 · Minimal
- Est. fire insurance / yr
- $1,161 – $2,155
Heat risk 3/10 · Minor
- Hot days now (above 104°F)
- 7 days/yr
- Hot days in 30 yrs
- 16 days/yr
Wind risk 2/10 · Minimal
- Chance of severe wind over 30 yrs
- —
Air-quality risk 1/10 · Minimal
- Unhealthy air days now
- 0 days/yr
- Unhealthy air days in 30 yrs
- 0 days/yr
Risk factors via First Street. Map © Google.
Why this score? — see what drove the D grade
The composite is a weighted blend of 9 inputs, each scored 0–100. Each bar is that input's sub-score; the figure is the points it added to the 100-point composite (weight × sub-score).
- ARV discount +15.0/15.0
- Cash flow +9.9/30.0
- Schools +4.4/10.0
- Livability +4.2/5.0
- Rent growth +3.4/5.0
- DSCR +2.8/10.0
- 1% rule +2.6/10.0
- Condition / age +2.5/5.0
- Appreciation +0.0/10.0
$228,000
🖨 Deal sheet (PDF) 📄 Offer letter ✓ Due diligence
Listing remarks
Charming College View Craftsman with space, character, & an unbeatable location! This 3+3 bedroom, 2 bath 1926 home blends timeless charm with thoughtful updates. Step onto the covered front porch with swing & into a home filled with beautiful original woodwork, real hardwood floors, high ceilings, built-ins, & fresh paint throughout. The spacious living & dining rooms flow into a refreshed kitchen (2023). Main level offers 3 large bedrooms, remodeled bath (2021), and laundry for convenience. The lower level adds 3 non-conforming bedrooms, a second remodeled bath (2021), great storage, & flexible unfinished space for a gym or studio. Outside features a fully fenc
Key facts
- Covered front porch
- Original woodwork
- Remodeled bath
Tags
Property features AI
Exterior
- Parking: Carport (1 covered space); Extra parking slab / open parking (1 total parking space listed); Detached/attached garage not indicated (one garage space recorded)
- Utilities: Public water; Public sewer; Electricity available; Natural gas available
- Home design: Single-family residence; Residential property; Not new (built in 1926); Below-grade finished area (basement) and above-grade living area
- Construction: Frame construction; Block foundation; Composition roof; Year built 1926
- Exterior features: Front porch; Chain link fencing; Shed(s) on property; Level lot with alley access; Lot approximately 50 x 142 (about 0.16 acres)
Interior
- Kitchen: Range; Refrigerator; Freezer; Dishwasher; Garbage disposal; Microwave; Vinyl flooring; Ceiling fan
- Bedrooms: Master bedroom on main floor with wood floors, 9'+ ceiling, and ceiling fan; Bedroom 2 on main floor with wood floors, 9'+ ceiling, and ceiling fan; Bedroom 3 on main floor with wood floors, 9'+ ceiling, and ceiling fan
- Flooring: Wood flooring; Carpet; Vinyl; Concrete
- Bathrooms: Two bathrooms total (including one on the main level and one below grade)
- Heating & cooling: Natural gas forced-air heating; Central air conditioning
- Interior features: High ceilings; Ceiling fans; Formal dining room; Partially finished basement with windows
- Laundry & utility: Washer; Dryer
Neighborhood map
What this means for you Summary
Snapshot
- This is a 3-bed/2.0-bath single-family listed at $228k.
Deal economics
- At list price, monthly cash flow is $-141 ($-2k/yr) — negative.
- To cash-flow at today's rent, offer at most $203k (10.9% below list).
- To meet the 1% rule (rent ≥ 1% of price), the offer needs to be $173k (24.0% below list).
- Recommended offer: $173k (24.0% below list) — sets the bar for 1% rule.
- Cap rate 5.6% vs local median 3.0% in Lincoln — top-decile yield for the area; either an underpriced asset or a hidden risk that comps aren't pricing in. Stress-test before assuming the spread holds.
Location & tenants
- Location reads 85/100 on livability (#5 in NE, #545 nationally) — a professional / high-income tenant draw. Strengths: amenities A+, cost of living A+, housing A+; Watch: crime D+.
- Lincoln Public Schools (urban): math 50% / reading 53% proficiency, ranked #59 of 111 in NE (top 53%) — acceptable for families but not a draw, mixed tenant base, ~2y average lease.
- Zoned schools: Calvert Elementary School (math 32% / reading 47%, grade F, #346 of 502 statewide, top 74%, 312 students, 57% FRL); Pound Middle School (math 60% / reading 59%, grade B, #18 of 128 statewide, top 15%, 727 students, 39% FRL); Lincoln Southeast High School (math 51% / reading 52%, grade D+, #105 of 261 statewide, top 40%, 1,929 students, 16% FRL) — zoned schools at 38% FRL track the district average.
- Market conditions: Rents rising (+3.7%/yr); 156 active listings in the ZIP; 3 comparable units currently listed for rent nearby; rentals at typical pace (median 23d on market — plan ~3-4 weeks tenant-placement turnaround); 1,940 units permitted in Lancaster County in 2024 (895 in 5+ unit buildings).
Forward outlook
- Local home prices are declining (-3.0%/yr); year-one equity from $2k of loan paydown is wiped out by about $7k of value loss. Plan a longer hold.
- Lancaster County population projected at +37% by 2050 — long-run rental-demand tailwind backs the buy-and-hold thesis.
Negotiation context
- It's been on market 29 days — a 2% lower offer ($225k) is reasonable based on typical stale-listing flexibility.
- 7 sale attempts since 8y ago with the ask held roughly flat each time — persistent listings suggest the price (not the market) is what's stuck; bring a comps-based counter.
- Current owner paid $148k; list at $228k implies a 54% gain — meaningful room to come down on a strong offer.
Risks & watch-outs
- Watch-outs: built in 1926 — expect roof / HVAC / electrical / plumbing capex.
Questions for the listing agent
- What do current leases actually rent for vs. the listed asking? Can we see a recent rent roll and the last 12 months of T-12 income?
- Built in 1926 — when were the roof, HVAC, electrical panel, plumbing, and water heater last replaced?
- Is there a deadline driving the sale (1031 exchange, divorce, estate, relocation)? That informs how much negotiation room exists.
- Schools are A-rated — typically a magnet for longer-tenancy family renters. What's the average tenant stay here, and is there a school-zone premium baked into asking?
- Crime grade is D in this area — have there been break-ins, vandalism, or insurance claims at this property in the last 3 years? What carrier currently insures it and at what premium?
- The area grade is low — what's the realistic commute time and amenity access for the typical tenant pool here? Any planned neighborhood developments (good or bad) we should know about?
- What's the average days-on-market for RENTAL listings here right now (not sales)? A rising rental-DOM trend means longer vacancies and softer asking-rent achievability than the comps imply.
- What's the recent tenant-quality profile in this submarket — average credit score on applications, eviction rate, late-payment / NSF rate, and stable-employment percentage? A property-management company in the area should have these aggregated.
- How much new for-sale + rental construction is in the pipeline within 1–3 miles? Heavy new supply typically softens prices + rents 12–24 months out; constrained supply supports both.
Investment metrics
- 1% rule
- 0.76% ✗
- Cap rate
- 5.55%
- Cash-on-cash
- -2.65%
- DSCR
- 0.88
- GRM
- 11.0
CMA / ARV
- ARV (median comp)
- $283,018
- List price
- $228,000
- Delta
- -15.55%
- Verdict
- UNDERPRICED
- Comps
- 20 within 1.0 mi
Show comp detail 12 sales within ~0.75 mi
| Address | Dist | Beds/Ba | Sqft | Sold | Price | $/sf | Match |
|---|---|---|---|---|---|---|---|
| 4341 S 45th St | 0.41mi | 3/2.0 | 1,705 (+1%) | 2mo | $298,000 | $175 | 78 |
| 2815 S 42nd St | 0.67mi | 3/2.0 | 1,699 (+0%) | 4mo | $250,000 | $147 | 65 |
| 4210 Van Dorn St | 0.70mi | 3/2.0 | 1,684 (-0%) | 2mo | $236,000 | $140 | 65 |
| 4513 Meredeth St | 0.29mi | 2/2.0 (-1) | 1,500 (-11%) | 1mo | $259,900 | $173 | 62 |
| 2905 S 41st St | 0.65mi | 2/2.0 (-1) | 1,721 (+2%) | 2mo | $253,500 | $147 | 60 |
| 4041 S 37th St | 0.52mi | 3/2.0 | 1,525 (-10%) | 2mo | $290,000 | $190 | 58 |
| 3100 S 54th St | 0.71mi | 3/2.0 | 1,798 (+6%) | 2mo | $300,000 | $167 | 55 |
| 5320 Spruce St | 0.74mi | 3/3.0 | 1,762 (+4%) | 3mo | $275,500 | $156 | 52 |
| 4815 South Haven Dr | 0.72mi | 4/2.5 (+1) | 1,786 (+6%) | 2mo | $290,000 | $162 | 49 |
| 3720 S 56th St | 0.70mi | 3/1.5 | 1,490 (-12%) | 0mo | $150,000 | $101 | 45 |
| 3751 Spruce St | 0.69mi | 3/2.5 | 1,940 (+15%) | 1mo | $290,000 | $149 | 41 |
| 2831 S 47th St | 0.63mi | 2/2.0 (-1) | 1,456 (-14%) | 4mo | $232,500 | $160 | 39 |
Match score weights: distance 35% · size 25% · config 20% · recency 20%. Top-matched comps best support the ARV.
Projected returns pro-forma
-3.0% appreciation · 3.67% rent growth · sell at horizon
- IRR
- -20.0%
- Equity multiple
- 0.30×
- Total profit
- $-44,774
- Equity at exit
- $33,996
- IRR
- -11.7%
- Equity multiple
- 0.28×
- Total profit
- $-45,733
- Equity at exit
- $19,713
Cash invested: $63,840 (down + closing). Projections, not guarantees.
Landlord ↔ Tenant lean methodology
- Overall (STATE)
- 83 Strongly Landlord-Friendly
- State Nebraska
- 83 Strongly Landlord-Friendly · R+13
- County
- — inherits STATE
- City
- — inherits STATE
ZIP-level market 68506
- Rents YoY
- 3.7%
- Active inventory
- 156
- Price-to-rent
- 11.0×
Monthly cashflow live
- Estimated rent
- $1,732 medium interval (Pro) →
- Mortgage (P&I)
- −$1,196
- Tax from tax record
- −$219 /mo · $2,628/yr
- Insurance
- −$95
- HOA
- −$0
- Vacancy / Maint / Mgmt
- −$364
- Net cashflow
- $-141
Break-even live
Sensitivity live
| Price | -10% $-12 | -5% $-77 | +0% $-141 | +5% $-206 | +10% $-270 |
|---|---|---|---|---|---|
| Rent | -10% $-278 | -5% $-210 | +0% $-141 | +5% $-73 | +10% $-4 |
| Rate | -1.0pp $-26 | -0.5pp $-83 | base $-141 | +0.5pp $-200 | +1.0pp $-260 |
UW: 25.0% down · 7.5% · 30yr · 1.5% tax · 5.0% vac · 8.0% maint · 8.0% mgmt
Financing live
Cash to close
- Down payment
- $57,000
- Closing costs
- $6,840
- Reserves months
- —
- Total cash needed
- —
Loan-product check · same deal, 3 products live
Conventional
25% down · 7.5% · 30yr
- Down + closing
- —
- Monthly P&I
- —
- Monthly cashflow
- —
- DSCR
- —
- Eligible?
- —
Personal DTI + credit; lowest rate.
DSCR
20% down · 8.5% · 30yr
- Down + closing
- —
- Monthly P&I
- —
- Monthly cashflow
- —
- DSCR
- —
- Eligible?
- —
No personal income docs; deal must DSCR.
Hard money
10% down · 12.0% · 12mo
- Down + closing
- —
- Monthly P&I
- —
- Monthly cashflow
- —
- DSCR
- —
- Eligible?
- —
Short-term bridge; refi at stabilization.
Rent comps 3 comps
| Address | Beds | Baths | Sqft | Rent | $/sqft | DOM | Units | Dist |
|---|---|---|---|---|---|---|---|---|
| 4125 High St Lincoln, NE | 3.0 | 1.5 | 1600 | $1,950 | $1.22 | 23d | 1 | 0.45mi |
| 5218 High St Lincoln, NE | 4.0 | 1.5 | 1769 | $1,899 | $1.07 | 45d | 1 | 0.57mi |
| 2800 Woods Blvd Lincoln, NE | 2.0 | 2.0 | 1118 | $1,152 | $1.03 | 15d | 5 | 1.22mi |
Listing history 31 events
-
2026-06-21days on market $228,000 Active 29 DOM
-
2026-06-18days on market $228,000 Active 26 DOM
-
2026-06-17days on market $228,000 Active 25 DOM
-
2026-06-16days on market $228,000 Active 24 DOM
-
2026-06-15days on market $228,000 Active 23 DOM
-
2026-06-14days on market $228,000 Active 21 DOM
-
2026-06-10days on market $228,000 Active 18 DOM
-
2026-06-09days on market $228,000 Active 17 DOM
-
2026-06-08days on market $228,000 Active 16 DOM
-
2026-06-07days on market $228,000 Active 15 DOM
-
2026-06-05days on market $228,000 Active 12 DOM
-
2026-06-03days on market $228,000 Active 11 DOM
-
2026-06-02days on market $228,000 Active 10 DOM
-
2026-06-01days on market $228,000 Active 9 DOM
-
2026-05-31days on market $228,000 Active 8 DOM
-
2026-05-30days on market $228,000 Active 7 DOM
-
2026-05-15price $228,000 977-char remark
-
2026-02-27$239,000 New 977-char remark
-
2023-10-16historical
-
2023-10-10$249,000 New
-
2023-10-10historical
-
2023-09-07$249,000 New
-
2023-09-07historical
-
2023-08-25$261,965 New
-
2018-09-17soldstatus $148,000
-
2018-09-13soldstatus $148,000
-
2018-08-01historical
-
2018-07-31$149,900
-
2018-07-27historical
-
2018-07-09$149,900
-
2012-02-17soldstatus $88,000
ⓘ Source: listings_history table (triggers on properties + properties_extension) + one-shot
backfill from property_details.listing_events for pre-trigger history.
Tax reassessment forecast NE · Resets to sale price
- Current annual tax
- $2,628 · $219/mo
- Projected year-2 tax
- $3,944 · $329/mo
- Expected delta
- +$1,317/yr (+$110/mo · 50.1%)
ⓘ Screening estimate from a state-policy table — verify with the county assessor before closing.
Climate risk First Street
- Flood 1/10 Low FEMA zone X (unshaded) · 0% chance over 30 yrs
- Wildfire 1/10 Low
- Heat 3/10 Moderate 7 d/yr ≥104°F today · 16 d/yr by 30 yrs out
- Wind 2/10 Low
- Air quality 1/10 Low 0 unhealthy d/yr today · 0 by 30 yrs out
Nearby sold comps map
Loading sold comps map…
Walkable amenities ~0.75 mi
Loading nearby amenities…
Taxation est. · year 1
- Rental income
- $20,787
- − Mortgage interest
- −$12,772
- − Property taxes
- −$2,628
- − Insurance
- −$1,140
- − Repairs & maintenance
- −$1,663
- − Management
- −$1,663
- − Depreciation
- −$6,633
- Taxable loss
- −$5,711
- Est. tax savings @ 24.0%
- +$1,371
- After-tax cash flow
- $-323/yr
For passive investors: Depreciation is non-cash, so a rental often shows a tax loss while cash-flowing — sheltering income. Rental losses are passive: they offset passive income freely, and up to $25,000/yr can offset ordinary (W-2) income if you actively participate and your MAGI is under $100k (phasing out to $0 by $150k); unused losses carry forward. On sale, claimed depreciation is recaptured at up to 25%, and gains may owe capital-gains tax (a 1031 exchange can defer both). Figures are a year-1 estimate at your 24.0% rate — not tax advice; consult a CPA.
Schools (NCES district)
- District
- Lincoln Public Schools
- NCES district ID
- 3172840
- Math proficiency
- 50% ▼ -6.00%
- Reading proficiency
- 53% ▼ -3.00%
- Median HH income
- $50,273
- Composite
- 44.05/100
- National rank
- #2880
- State rank
- #59 of 111 in NE
Livability — Lincoln
- Score
- 85/100
- State rank
- #5
- US rank
- #545
Category grades
Schools grade is shown separately in the Schools card above.
Census & demographics
- Census place
- Lincoln, NE
- County
- Lancaster County · 291,509 people
- City population
- 291,509
- Metro
- Lincoln, NE
- Population (ZIP)
- 27,531
- Household income
- $72,637
- Rent vs Own
- Severe rent burden
- 1150.0
Population outlook (Lancaster County) Hauer SSP2
- Today (2025)
- 352,806 people
- By 2030
- 377,899 · +7.1%
- By 2040
- 428,582 · +21.5%
- By 2050
- 483,103 · +36.9%
- By 2075
- 632,390 · +79.2%
- By 2100
- 759,513 · +115.3%
Race, ethnicity, and origin ACS 2023
- Neighborhood character
- Predominantly White (81%)
- Race & ethnicity
- White 81% Hispanic / Latino 8% Two or more races 6% Asian 3% Black 1% Native American 1%
- Hispanic origin (detail)
- Mexican 5%
- Common ancestry
- Lithuanian 2% Portuguese 2% Italian 2%
- Foreign-born
- 7% · Canada, China, Philippines
- Languages at home
- 89% English-only · Spanish 4% Other Asian/Pacific 1% Chinese 1%
Political lean MEDSL · Lancaster
- 2024 margin
- Toss-up / Even · D 51.4% · R 47.1% · Other 1.5%
- 2008→2024 swing
- -0.7pp no change · 2008: 5.0pp · 2024: 4.3pp
- All cycles
- 2024: D+4.3 2020: D+7.8 2016: D+0.1 2012: R+1.0 2008: D+5.0
Not yet ingested
- Civics
- —
Market trends
- HPI YoY
- ▼ -253.20%
- Current HPI
- 234.2428
- Rent YoY
- ▲ 3.67%
- Metro
- Lincoln, NE
- State GDP YoY
- ▲ 0.68%
- F500 in state
- 2
Industry mix (Fortune 500 HQ in NE)
| Industry | F500 HQs | Revenue |
|---|---|---|
| Conglomerate | 1 | $371B |
|
||
Price history
+159.1% since first listed17 events — show timeline
- 2026-05-23 Listed $228,000 GPRMLS
- 2026-05-22 Listing Removed — GPRMLS
- 2026-05-15 Price Changed $228,000 GPRMLS
- 2026-02-27 Listed $239,000 GPRMLS
- 2023-10-16 Listing Removed — GPRMLS
- 2023-10-10 Listing Removed — GPRMLS
- 2023-10-10 Listed $249,000 GPRMLS
- 2023-09-07 Listing Removed — GPRMLS
- 2023-09-07 Listed $249,000 GPRMLS
- 2023-08-25 Listed $261,965 GPRMLS
- 2018-09-17 Sold (Public Records) $148,000 Public Records
- 2018-09-13 Sold (MLS) $148,000 GPRMLS
- 2018-08-01 Listing Removed — GPRMLS
- 2018-07-31 Listed $149,900 GPRMLS
- 2018-07-27 Listing Removed — GPRMLS
- 2018-07-09 Listed $149,900 GPRMLS
- 2012-02-17 Sold (Public Records) $88,000 Public Records
Property tax history
+4.5%/yrLatest (2025): $2,628 · +0.5% YoY. Source: county tax records.
Cash-flow waterfall
monthlySold comps — $/sqft
last 12 mo · ≤1 miLoading sold comps…