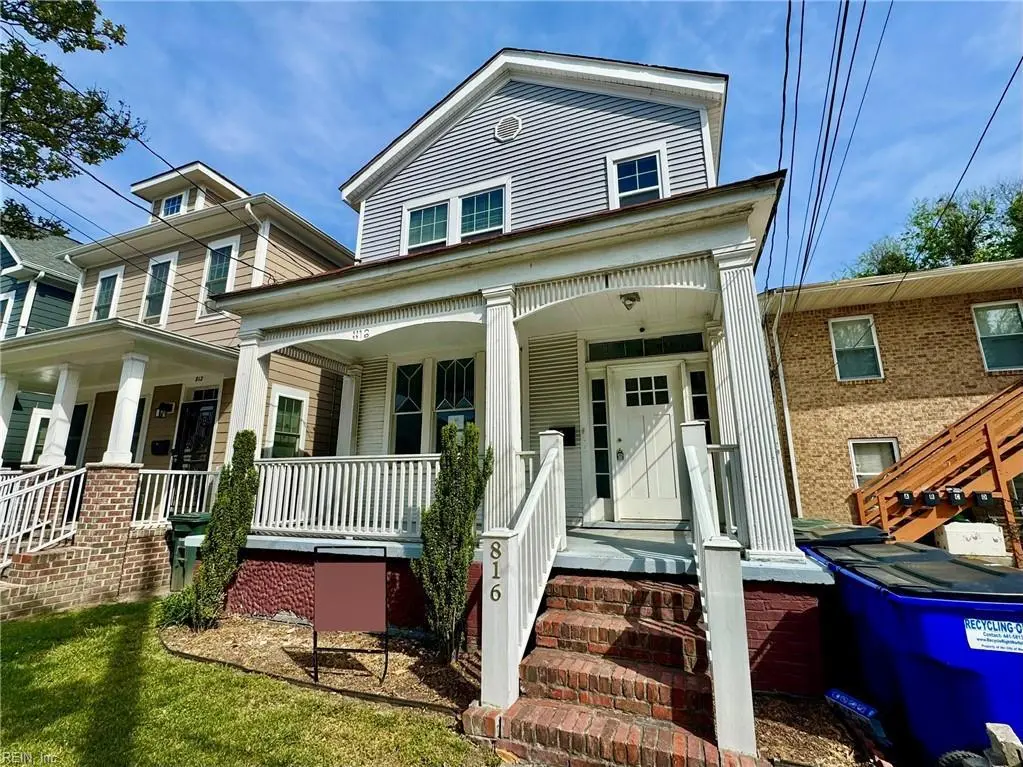
816 Lexington St · Norfolk, VA
Flood risk 3/10 · Minor
- FEMA flood zone
- X (unshaded)
- Chance of flooding over 30 yrs
- 0.1%
- Est. flood insurance / yr
- $507 – $1,088
Fire risk 1/10 · Minimal
- Est. fire insurance / yr
- $666 – $1,236
Heat risk 9/10 · Severe
- Hot days now (above 106°F)
- 7 days/yr
- Hot days in 30 yrs
- 16 days/yr
Wind risk 8/10 · Major
- Chance of severe wind over 30 yrs
- 80.0%
Air-quality risk 3/10 · Minor
- Unhealthy air days now
- 2 days/yr
- Unhealthy air days in 30 yrs
- 5 days/yr
Risk factors via First Street. Map © Google.
Why this score? — see what drove the B- grade
The composite is a weighted blend of 9 inputs, each scored 0–100. Each bar is that input's sub-score; the figure is the points it added to the 100-point composite (weight × sub-score).
- Cash flow +23.2/30.0
- ARV discount +15.0/15.0
- DSCR +7.4/10.0
- 1% rule +6.2/10.0
- Livability +4.2/5.0
- Rent growth +4.0/5.0
- Schools +3.5/10.0
- Condition / age +2.5/5.0
- Appreciation +0.0/10.0
$185,000
🖨 Deal sheet 📄 Offer letter ✓ Due diligence
Listing remarks MLS
Bring your vision and make it your own! Conveniently located in the heart of Norfolk, this 4-bedroom, 3-bath home offers around 1,700 square feet of potential-filled living space. The functional layout provides a great start for customization, whether you're looking to update, renovate, or create your dream home from the ground up. The possibilities here are endless. A little TLC will truly make this home shine! Call today for more information and to schedule your tour!
Key facts
- 2,578 sq ft lot
- Built 1914
- Listed 23 days
Neighborhood map
What this means for you Summary
Snapshot
- This is a 4-bed/3.0-bath single-family listed at $185k.
Deal economics
- At list price, monthly cash flow is $335 ($4k/yr) — positive.
- The deal already cash-flows at list — no discount required.
- Meets the 1% rule at list price ($2k rent vs $185k).
- Recommended offer: $182k (1.5% below list) — sets the bar for market timing.
- Cap rate 8.5% vs local median 4.0% in Norfolk — top-decile yield for the area; either an underpriced asset or a hidden risk that comps aren't pricing in. Stress-test before assuming the spread holds.
Location & tenants
- Location reads 83/100 on livability (#43 in VA, #1,026 nationally) — a professional / high-income tenant draw. Strengths: amenities A+, commute A+, health & safety A+; Watch: employment C-, crime F.
- Norfolk City Public School District (urban): math 27% / reading 56% proficiency, ranked #118 of 131 in VA (top 90%) — families likely to look elsewhere, expect single-tenant / working-renter base with shorter leases.
- Market conditions: Rents rising fast (+6.1%/yr); 120 active listings in the ZIP; 40 comparable units currently listed for rent nearby; rentals at typical pace (median 24d on market — plan ~3-4 weeks tenant-placement turnaround); lower-income renter base — watch delinquency; 438 units permitted in Norfolk city in 2024 (273 in 5+ unit buildings).
- At $2,065/mo this rent would consume 55% of the median local household income ($45k/yr) (locally 1531% of renters already pay >50% of income on rent) — very limited rent-growth headroom before tenants either downsize or default.
Forward outlook
- Local home prices are declining (-3.0%/yr); year-one equity from $1k of loan paydown is wiped out by about $6k of value loss. Plan a longer hold.
- At projected returns (-3.0% appreciation + 6.1% rent growth), your $52k cash investment doubles in ~9 years — after that, you're playing with house money.
Negotiation context
- It's been on market 23 days — a 2% lower offer ($182k) is reasonable based on typical stale-listing flexibility.
- 3 sale attempts since 10y ago with the ask held roughly flat each time — persistent listings suggest the price (not the market) is what's stuck; bring a comps-based counter.
Risks & watch-outs
- Watch-outs: built in 1914 — expect roof / HVAC / electrical / plumbing capex.
- Climate carrying-cost: severe wind risk, 80% chance of damaging wind over 30y; extreme-heat days projected 7→16/yr by 2055 (HVAC capex compounding) — expect insurance premiums to compound above CPI over the hold.
Questions for the listing agent
- Built in 1914 — when were the roof, HVAC, electrical panel, plumbing, and water heater last replaced?
- Is there a deadline driving the sale (1031 exchange, divorce, estate, relocation)? That informs how much negotiation room exists.
- Schools are A-rated — typically a magnet for longer-tenancy family renters. What's the average tenant stay here, and is there a school-zone premium baked into asking?
- Crime grade is F in this area — have there been break-ins, vandalism, or insurance claims at this property in the last 3 years? What carrier currently insures it and at what premium?
- What's the average days-on-market for RENTAL listings here right now (not sales)? A rising rental-DOM trend means longer vacancies and softer asking-rent achievability than the comps imply.
- What's the recent tenant-quality profile in this submarket — average credit score on applications, eviction rate, late-payment / NSF rate, and stable-employment percentage? A property-management company in the area should have these aggregated.
- How much new for-sale + rental construction is in the pipeline within 1–3 miles? Heavy new supply typically softens prices + rents 12–24 months out; constrained supply supports both.
Investment metrics
- 1% rule
- 1.12% ✓
- Cap rate
- 8.46%
- Cash-on-cash
- 7.75%
- DSCR
- 1.34
- GRM
- 7.5
CMA / ARV
- ARV (median comp)
- $286,520
- List price
- $185,000
- Delta
- -35.43%
- Verdict
- UNDERPRICED
- Comps
- 20 within 1.0 mi
Show comp detail 12 sales within ~0.75 mi
| Address | Dist | Beds/Ba | Sqft | Sold | Price | $/sf | Match |
|---|---|---|---|---|---|---|---|
| 823 Lexington St | 0.03mi | 4/2.5 | 1,616 (-6%) | 2mo | $300,000 | $186 | 86 |
| 738 Fremont St | 0.09mi | 3/2.5 (-1) | 1,780 (+4%) | 0mo | $315,000 | $177 | 82 |
| 1815 Tidewater Dr | 0.27mi | 3/2.5 (-1) | 1,666 (-3%) | 1mo | $285,000 | $171 | 74 |
| 942 Sutton St | 0.18mi | 4/3.0 | 1,552 (-10%) | 3mo | $299,000 | $193 | 74 |
| 896 A Ave | 0.16mi | 3/2.5 (-1) | 1,589 (-7%) | 4mo | $266,500 | $168 | 70 |
| 1891 Barre St | 0.22mi | 4/3.0 | 1,520 (-11%) | 1mo | $325,000 | $214 | 70 |
| 714 Fremont St | 0.12mi | 3/2.5 (-1) | 1,520 (-11%) | 2mo | $295,000 | $194 | 67 |
| 912 Lindenwood Ave | 0.40mi | 3/2.5 (-1) | 1,628 (-5%) | 2mo | $301,500 | $185 | 64 |
| 822 Pollard St | 0.33mi | 3/2.0 (-1) | 1,494 (-13%) | 0mo | $290,600 | $195 | 54 |
| 1311 Cary Ave | 0.62mi | 5/3.0 (+1) | 1,900 (+11%) | 2mo | $310,000 | $163 | 46 |
| 2216 Courtney Ave | 0.51mi | 3/2.5 (-1) | 1,500 (-12%) | 4mo | $340,000 | $227 | 46 |
| 1347 Marshall Ave | 0.68mi | 5/3.0 (+1) | 1,900 (+11%) | 2mo | $359,000 | $189 | 43 |
Match score weights: distance 35% · size 25% · config 20% · recency 20%. Top-matched comps best support the ARV.
Projected returns pro-forma
-3.0% appreciation · 6.12% rent growth · sell at horizon
- IRR
- -1.0%
- Equity multiple
- 0.96×
- Total profit
- $-1,940
- Equity at exit
- $27,584
- IRR
- 11.8%
- Equity multiple
- 2.07×
- Total profit
- $55,177
- Equity at exit
- $15,995
Cash invested: $51,800 (down + closing). Projections, not guarantees.
Landlord ↔ Tenant lean methodology
- Overall (STATE)
- 55 Moderately Landlord-Leaning
- State Virginia
- 55 Moderately Landlord-Leaning · D+2
- County
- — inherits STATE
- City
- — inherits STATE
ZIP-level market 23504
- Home prices YoY
- -6.2%
- Rents YoY
- 6.1%
- Active inventory
- 120
- Price-to-rent
- 7.5×
Monthly cashflow live
- Estimated rent
- $2,065 high interval (Pro) →
- Mortgage (P&I)
- −$970
- Tax from tax record
- −$250 /mo · $2,998/yr
- Insurance
- −$77
- HOA
- −$0
- Vacancy / Maint / Mgmt
- −$434
- Net cashflow
- $335
Break-even live
UW: 25.0% down · 7.5% · 30yr · 1.5% tax · 5.0% vac · 8.0% maint · 8.0% mgmt
Financing live
Cash to close
- Down payment
- $46,250
- Closing costs
- $5,550
- Reserves months
- —
- Total cash needed
- —
Loan-product check · same deal, 3 products live
Conventional
25% down · 7.5% · 30yr
- Down + closing
- —
- Monthly P&I
- —
- Monthly cashflow
- —
- DSCR
- —
- Eligible?
- —
Personal DTI + credit; lowest rate.
DSCR
20% down · 8.5% · 30yr
- Down + closing
- —
- Monthly P&I
- —
- Monthly cashflow
- —
- DSCR
- —
- Eligible?
- —
No personal income docs; deal must DSCR.
Hard money
10% down · 12.0% · 12mo
- Down + closing
- —
- Monthly P&I
- —
- Monthly cashflow
- —
- DSCR
- —
- Eligible?
- —
Short-term bridge; refi at stabilization.
Rent comps 40 comps
| Address | Beds | Baths | Sqft | Rent | $/sqft | DOM | Units | Dist |
|---|---|---|---|---|---|---|---|---|
| 830 Lexington St Norfolk, VA | 3.0 | 2.5 | 1804 | $1,950 | $1.08 | 43d | 1 | 0.03mi |
| 766 A Ave Norfolk, VA | 5.0 | 2.0 | 1544 | $1,400 | $0.91 | 43d | 1 | 0.07mi |
| 764 B Ave Norfolk, VA | 3.0 | 2.5 | 1380 | $1,795 | $1.30 | 20d | 1 | 0.13mi |
| 1449 Proescher St Norfolk, VA | 3.0 | 1.5 | 1400 | $1,550 | $1.11 | 23d | 1 | 0.18mi |
| 907 Rugby St Norfolk, VA | 3.0 | 2.0 | 1515 | $2,200 | $1.45 | 43d | 1 | 0.30mi |
| 881 Rugby St Norfolk, VA | 3.0 | 2.0 | 1600 | $2,650 | $1.66 | 23d | 1 | 0.31mi |
| 2529 Tidewater Dr Norfolk, VA | 3.0 | 2.5 | 2025 | $2,370 | $1.17 | 23d | 1 | 0.51mi |
| 645 Church St Norfolk, VA | 1.0–3.0 | 1.0–2.0 | 881 | $1,845 | $2.09 | 7d | 1 | 0.75mi |
| 1403 Lead St Norfolk, VA | 4.0 | 2.5 | 1854 | $2,550 | $1.38 | 43d | 1 | 0.77mi |
| 2605 Bapaume Ave Norfolk, VA | 3.0 | 2.0 | 2004 | $2,295 | $1.15 | 43d | 1 | 0.77mi |
| 2729 Somme Ave Norfolk, VA | 3.0 | 2.5 | 1524 | $2,295 | $1.51 | 14d | 1 | 0.82mi |
| 820 Maltby Cres Norfolk, VA | 3.0 | 2.5 | 1850 | $2,395 | $1.29 | 23d | 1 | 0.93mi |
| 2660 Chesapeake Blvd Norfolk, VA | 3.0 | 2.0 | 1375 | $2,100 | $1.53 | 17d | 1 | 0.98mi |
| 1801 Saint Denis Ave Unit 3 Norfolk, VA | 4.0 | 2.0 | 1500 | $2,400 | $1.60 | 23d | 1 | 0.99mi |
| 417 W 27th St Unit F Norfolk, VA | 3.0 | 2.0 | 1200 | $1,600 | $1.33 | 14d | 1 | 1.00mi |
| 417 W 27th St Unit F Norfolk, VA | 3.0 | 2.0 | 1200 | $1,600 | $1.33 | 21d | 1 | 1.00mi |
| 817 Botetourt Gdns Norfolk, VA | 3.0 | 2.5 | 1900 | $3,150 | $1.66 | 14d | 1 | 1.01mi |
| 410 W 29th St Norfolk, VA | 4.0 | 2.0 | 2001 | $2,500 | $1.25 | 14d | 1 | 1.05mi |
| 1009 Colonial Ave #3 Norfolk, VA | 3.0 | 2.0 | 1276 | $2,400 | $1.88 | 23d | 1 | 1.05mi |
| 325 W 31st St Unit 6 Norfolk, VA | 3.0 | 1.0 | 1400 | $1,750 | $1.25 | 23d | 1 | 1.06mi |
| 400 W 30th St Norfolk, VA | 3.0 | 1.5 | 1120 | $1,985 | $1.77 | 43d | 1 | 1.06mi |
| 426 W 28th St Norfolk, VA | 3.0 | 3.0 | 2034 | $2,850 | $1.40 | 17d | 1 | 1.06mi |
| 2914 Peronne Ave Norfolk, VA | 4.0 | 2.0 | 1764 | $2,495 | $1.41 | 23d | 1 | 1.09mi |
| 819 Colonial Ave Norfolk, VA | 1.0–3.0 | 1.0–2.0 | 1092 | $2,450 | $2.24 | 1d | 11 | 1.10mi |
| 1714 Bellevue Ave Norfolk, VA | 3.0 | 1.5 | 1500 | $1,799 | $1.20 | 43d | 1 | 1.12mi |
| 1022 Kenton Ave Norfolk, VA | 3.0 | 2.0 | 1400 | $2,400 | $1.71 | 10d | 1 | 1.14mi |
| 625 W Princess Anne Rd Unit 6 Norfolk, VA | 3.0 | 1.5 | 1650 | $1,995 | $1.21 | 20d | 1 | 1.15mi |
| 622 Graydon Ave Unit 5 Norfolk, VA | 3.0 | 2.0 | 1500 | $1,700 | $1.13 | 16d | 1 | 1.15mi |
| 731 Shirley Ave Unit 1 Norfolk, VA | 3.0 | 1.0 | 1200 | $1,950 | $1.62 | 43d | 1 | 1.20mi |
| 726 W Princess Anne Rd Unit 2 Norfolk, VA | 3.0 | 2.0 | 1265 | $1,695 | $1.34 | 3d | 1 | 1.23mi |
| 1801 Lasalle Ave Norfolk, VA | 3.0 | 1.0 | 1102 | $1,880 | $1.71 | 44d | 1 | 1.24mi |
| 200 College Pl Norfolk, VA | 1.0–3.0 | 1.0–2.0 | 1047 | $2,533 | $2.42 | 1d | 12 | 1.25mi |
| 1751 Fontainebleau Cres Norfolk, VA | 3.0 | 2.0 | 1231 | $2,350 | $1.91 | 43d | 1 | 1.27mi |
| 3805 Granby St Unit D Norfolk, VA | 3.0 | 2.5 | 1911 | $2,500 | $1.31 | 23d | 1 | 1.28mi |
| 810 Brandon Ave Norfolk, VA | 3.0 | 1.0 | 1420 | $2,350 | $1.65 | 14d | 1 | 1.28mi |
| 2700 Myrtle Ave Norfolk, VA | 3.0 | 3.0 | 1888 | $2,600 | $1.38 | 43d | 1 | 1.30mi |
| 2531 Vincent Ave Norfolk, VA | 3.0 | 2.0 | 1600 | $2,195 | $1.37 | 43d | 1 | 1.32mi |
| 2815 Keller Ave Norfolk, VA | 3.0 | 2.0 | 1210 | $2,250 | $1.86 | 3d | 1 | 1.33mi |
| 829 Spotswood Ave Unit B Norfolk, VA | 3.0 | 2.0 | 1250 | $2,150 | $1.72 | 14d | 1 | 1.33mi |
| 810 W Princess Anne Rd #303 Norfolk, VA | 3.0 | 2.0 | 1483 | $2,300 | $1.55 | 23d | 1 | 1.33mi |
Listing history 8 events
-
2026-05-06status Under Contract 474-char remark
Show marketing remark (474 chars)
Bring your vision and make it your own! Conveniently located in the heart of Norfolk, this 4-bedroom, 3-bath home offers around 1,700 square feet of potential-filled living space. The functional layout provides a great start for customization, whether you're looking to update, renovate, or create your dream home from the ground up. The possibilities here are endless. A little TLC will truly make this home shine! Call today for more information and to schedule your tour!
-
2026-04-10$185,000 Active 474-char remark
Show marketing remark (474 chars)
Bring your vision and make it your own! Conveniently located in the heart of Norfolk, this 4-bedroom, 3-bath home offers around 1,700 square feet of potential-filled living space. The functional layout provides a great start for customization, whether you're looking to update, renovate, or create your dream home from the ground up. The possibilities here are endless. A little TLC will truly make this home shine! Call today for more information and to schedule your tour!
-
2019-10-01status Under Contract
-
2019-09-17historical Active Under Contract
-
2019-06-28price $199,900
-
2019-01-07$210,000 Active
-
2016-11-16status Under Contract
-
2016-10-11$35,000 Active
ⓘ Source: listings_history table (triggers on properties + properties_extension) + one-shot
backfill from property_details.listing_events for pre-trigger history.
Tax reassessment forecast VA · Resets to sale price
- Current annual tax
- $2,998 · $250/mo
- Projected year-2 tax
- $2,998 · $250/mo
- Expected delta
- $0/yr ($0/mo · 0.0%)
ⓘ Screening estimate from a state-policy table — verify with the county assessor before closing.
Climate risk First Street
- Flood 3/10 Moderate FEMA zone X (unshaded) · 10% chance over 30 yrs
- Wildfire 1/10 Low
- Heat 9/10 Extreme 7 d/yr ≥106°F today · 16 d/yr by 30 yrs out
- Wind 8/10 Severe 80% chance of damaging wind over 30 yrs
- Air quality 3/10 Moderate 2 unhealthy d/yr today · 5 by 30 yrs out
Nearby sold comps map
Loading sold comps map…
Walkable amenities ~0.75 mi
Loading nearby amenities…
Taxation est. · year 1
- Rental income
- $24,784
- − Mortgage interest
- −$10,363
- − Property taxes
- −$2,998
- − Insurance
- −$925
- − Repairs & maintenance
- −$1,983
- − Management
- −$1,983
- − Depreciation
- −$5,382
- Taxable income
- $1,151
- Est. tax owed @ 24.0%
- −$276
- After-tax cash flow
- $3,739/yr
For passive investors: Depreciation is non-cash, so a rental often shows a tax loss while cash-flowing — sheltering income. Rental losses are passive: they offset passive income freely, and up to $25,000/yr can offset ordinary (W-2) income if you actively participate and your MAGI is under $100k (phasing out to $0 by $150k); unused losses carry forward. On sale, claimed depreciation is recaptured at up to 25%, and gains may owe capital-gains tax (a 1031 exchange can defer both). Figures are a year-1 estimate at your 24.0% rate — not tax advice; consult a CPA.
Schools (NCES district)
- District
- Norfolk City Public School District
- NCES district ID
- 5102670
- Math proficiency
- 27% ▼ -44.00%
- Reading proficiency
- 56% ▼ -10.00%
- Median HH income
- $44,358
- Composite
- 35.08/100
- National rank
- #5026
- State rank
- #118 of 131 in VA
Livability — Norfolk
- Score
- 83/100
- State rank
- #43
- US rank
- #1026
Category grades
Schools grade is shown separately in the Schools card above.
Census & demographics
- Census place
- Norfolk, VA
- County
- Norfolk City · 214,042 people
- City population
- 214,042
- Metro
- Virginia Beach-Norfolk-Newport News, VA-NC
- Population (ZIP)
- 23,502
- Household income
- $44,659
- Rent vs Own
- Severe rent burden
- 1531.0
Population outlook (Norfolk County) Hauer SSP2
- Today (2025)
- 249,032 people
- By 2030
- 252,347 · +1.3%
- By 2040
- 253,644 · +1.9%
- By 2050
- 251,913 · +1.2%
- By 2075
- 245,281 · -1.5%
- By 2100
- 219,548 · -11.8%
Race, ethnicity, and origin ACS 2023
- Neighborhood character
- Predominantly Black (78%)
- Race & ethnicity
- Black 78% White 12% Two or more races 5% Hispanic / Latino 3%
- Common ancestry
- Lithuanian 1% Slovak 1%
- Foreign-born
- 3% · Canada
- Languages at home
- 94% English-only · Spanish 4% French/Haitian/Cajun 1%
Political lean MEDSL · Norfolk
- 2024 margin
- Solid D (+41.5) · D 70.0% · R 28.5% · Other 1.6%
- 2008→2024 swing
- -1.4pp toward R · 2008: 43.0pp · 2024: 41.5pp
- All cycles
- 2024: D+41.5 2020: D+45.6 2016: D+42.0 2012: D+44.0 2008: D+43.0
Not yet ingested
- Civics
- —
Market trends
- HPI YoY
- ▼ -21.60%
- Current HPI
- 327.2374
- Rent YoY
- ▲ 6.12%
- Metro
- Virginia Beach-Norfolk-Newport News, VA-NC
- State GDP YoY
- ▲ 2.40%
- F500 in state
- 50
Industry mix (Fortune 500 HQ in VA)
| Industry | F500 HQs | Revenue |
|---|---|---|
| Aerospace / Defense | 4 | $236B |
|
||
| Technology / Defense | 3 | $32B |
|
||
| Financial Services | 2 | $176B |
|
||
| Utilities | 2 | $27B |
|
||
| Insurance | 2 | $25B |
|
||
| Technology | 2 | $15B |
|
||
Price history
+428.6% since first listed8 events — show timeline
- 2026-05-06 Pending — REINMLS
- 2026-04-10 Listed $185,000 REINMLS
- 2019-10-01 Pending — REINMLS
- 2019-09-17 Contingent — REINMLS
- 2019-06-28 Price Changed $199,900 REINMLS
- 2019-01-07 Listed $210,000 REINMLS
- 2016-11-16 Pending — REINMLS
- 2016-10-11 Listed $35,000 REINMLS
Property tax history
+9.0%/yrLatest (2025): $2,998 · +4.9% YoY. Source: county tax records.
Cash-flow waterfall
monthlySold comps — $/sqft
last 12 mo · ≤1 miLoading sold comps…