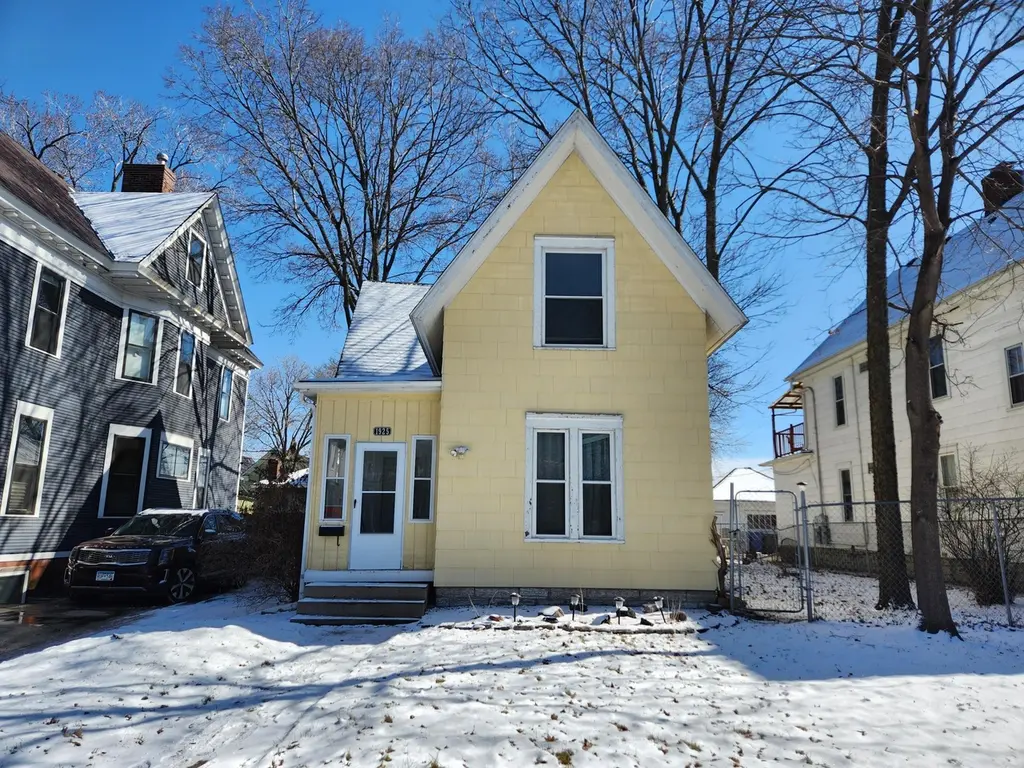
1925 Elliot Ave · Minneapolis, MN
Flood risk 1/10 · Minimal
- FEMA flood zone
- X (unshaded)
- Chance of flooding over 30 yrs
- 0.0%
- Est. flood insurance / yr
- $473 – $860
Fire risk 1/10 · Minimal
- Est. fire insurance / yr
- $888 – $1,650
Heat risk 2/10 · Minimal
- Hot days now (above 99°F)
- 7 days/yr
- Hot days in 30 yrs
- 14 days/yr
Wind risk 2/10 · Minimal
- Chance of severe wind over 30 yrs
- —
Air-quality risk 2/10 · Minimal
- Unhealthy air days now
- 1 days/yr
- Unhealthy air days in 30 yrs
- 1 days/yr
Risk factors via First Street. Map © Google.
Why this score? — see what drove the C- grade
The composite is a weighted blend of 9 inputs, each scored 0–100. Each bar is that input's sub-score; the figure is the points it added to the 100-point composite (weight × sub-score).
- Cash flow +15.7/30.0
- ARV discount +15.0/15.0
- DSCR +4.8/10.0
- 1% rule +4.4/10.0
- Livability +3.9/5.0
- Schools +3.5/10.0
- Rent growth +2.8/5.0
- Condition / age +2.5/5.0
- Appreciation +0.0/10.0
$219,900
🖨 Deal sheet 📄 Offer letter ✓ Due diligence
Listing remarks MLS
Wonderful home in Ventura Village. The home is much larger than it appears from the street. With generous room sizes, high ceilings, Hardwood floors and plenty of natural light. Enjoy the formal dining room, convenient 3-season porch and private backyard. Walk to shopping, restaurants, bus line, and more.
Key facts
- 6,969 sq ft lot
- 2 garage spots
- Built 1900
Neighborhood map
What this means for you Summary
Snapshot
- This is a 4-bed/1.0-bath single-family listed at $220k.
Deal economics
- At list price, monthly cash flow is $95 ($1k/yr) — positive.
- The deal already cash-flows at list — no discount required.
- To meet the 1% rule (rent ≥ 1% of price), the offer needs to be $207k (5.8% below list).
- Recommended offer: $200k (9.0% below list) — sets the bar for market timing.
- Cap rate 6.8% vs local median 3.1% in Minneapolis — top-decile yield for the area; either an underpriced asset or a hidden risk that comps aren't pricing in. Stress-test before assuming the spread holds.
Location & tenants
- Location reads 78/100 on livability (#110 in MN, #2,525 nationally) — a middle-class / working-renter tenant base. Strengths: amenities A+, commute A+, housing A+; Watch: cost of living C-, crime F.
- Minneapolis Public School District (urban): math 35% / reading 46% proficiency, ranked #217 of 301 in MN (top 72%) — families likely to look elsewhere, expect single-tenant / working-renter base with shorter leases.
- Market conditions: Rents rising (+1.0%/yr); 103 active listings in the ZIP; 26 comparable units currently listed for rent nearby; rentals at typical pace (median 14d on market — plan ~3-4 weeks tenant-placement turnaround); lower-income renter base — watch delinquency; 4,651 units permitted in Hennepin County in 2024 (2,443 in 5+ unit buildings).
- At $2,072/mo this rent would consume 59% of the median local household income ($42k/yr) (locally 2999% of renters already pay >50% of income on rent) — very limited rent-growth headroom before tenants either downsize or default.
Forward outlook
- Local home prices are declining (-3.0%/yr); year-one equity from $2k of loan paydown is wiped out by about $7k of value loss. Plan a longer hold.
- Hennepin County population projected at +30% by 2050 — long-run rental-demand tailwind backs the buy-and-hold thesis.
Negotiation context
- It's been on market 98 days — a 9% lower offer ($200k) is reasonable based on typical stale-listing flexibility.
- 3 sale attempts since 10y ago; this cycle's ask has dropped $40k (15%) from the opening price — seller is motivated, your offer sets the floor, not the list.
Risks & watch-outs
- Watch-outs: built in 1900 — expect roof / HVAC / electrical / plumbing capex.
Questions for the listing agent
- It's been on market 98 days. Have you received any prior offers? Is the seller open to a 9% concession, seller financing, or rate buy-down credit?
- Built in 1900 — when were the roof, HVAC, electrical panel, plumbing, and water heater last replaced?
- Why hasn't it sold? Are there any deal-killer items the seller is aware of (foundation, flood, title, zoning, code violations)?
- Is there a deadline driving the sale (1031 exchange, divorce, estate, relocation)? That informs how much negotiation room exists.
- Crime grade is F in this area — have there been break-ins, vandalism, or insurance claims at this property in the last 3 years? What carrier currently insures it and at what premium?
- What's the average days-on-market for RENTAL listings here right now (not sales)? A rising rental-DOM trend means longer vacancies and softer asking-rent achievability than the comps imply.
- What's the recent tenant-quality profile in this submarket — average credit score on applications, eviction rate, late-payment / NSF rate, and stable-employment percentage? A property-management company in the area should have these aggregated.
- How much new for-sale + rental construction is in the pipeline within 1–3 miles? Heavy new supply typically softens prices + rents 12–24 months out; constrained supply supports both.
Investment metrics
- 1% rule
- 0.94% ✗
- Cap rate
- 6.81%
- Cash-on-cash
- 1.85%
- DSCR
- 1.08
- GRM
- 8.8
CMA / ARV
- ARV (median comp)
- $352,790
- List price
- $219,900
- Delta
- -37.67%
- Verdict
- UNDERPRICED
- Comps
- 8 within 2.0 mi
Projected returns pro-forma
-3.0% appreciation · 1.0% rent growth · sell at horizon
- IRR
- -15.6%
- Equity multiple
- 0.45×
- Total profit
- $-33,643
- Equity at exit
- $32,788
- IRR
- -11.1%
- Equity multiple
- 0.39×
- Total profit
- $-37,460
- Equity at exit
- $19,013
Cash invested: $61,572 (down + closing). Projections, not guarantees.
Landlord ↔ Tenant lean methodology
- Overall (CITY)
- 34 Tenant-Leaning
- State Minnesota
- 46 Balanced · D+2
- County
- — inherits STATE
- City Minneapolis
- 34 Tenant-Leaning · D+50
ZIP-level market 55404
- Home prices YoY
- -33.3%
- Rents YoY
- 1.0%
- Active inventory
- 103
- Price-to-rent
- 8.8×
Monthly cashflow live
- Estimated rent
- $2,072 high interval (Pro) →
- Mortgage (P&I)
- −$1,153
- Tax from tax record
- −$298 /mo · $3,571/yr
- Insurance
- −$92
- HOA
- −$0
- Vacancy / Maint / Mgmt
- −$435
- Net cashflow
- $95
Break-even live
UW: 25.0% down · 7.5% · 30yr · 1.5% tax · 5.0% vac · 8.0% maint · 8.0% mgmt
Financing live
Cash to close
- Down payment
- $54,975
- Closing costs
- $6,597
- Reserves months
- —
- Total cash needed
- —
Loan-product check · same deal, 3 products live
Conventional
25% down · 7.5% · 30yr
- Down + closing
- —
- Monthly P&I
- —
- Monthly cashflow
- —
- DSCR
- —
- Eligible?
- —
Personal DTI + credit; lowest rate.
DSCR
20% down · 8.5% · 30yr
- Down + closing
- —
- Monthly P&I
- —
- Monthly cashflow
- —
- DSCR
- —
- Eligible?
- —
No personal income docs; deal must DSCR.
Hard money
10% down · 12.0% · 12mo
- Down + closing
- —
- Monthly P&I
- —
- Monthly cashflow
- —
- DSCR
- —
- Eligible?
- —
Short-term bridge; refi at stabilization.
Rent comps 26 comps
| Address | Beds | Baths | Sqft | Rent | $/sqft | DOM | Units | Dist |
|---|---|---|---|---|---|---|---|---|
| 2113 11th Ave S Minneapolis, MN | 3.0 | 1.0 | 900 | $2,100 | $2.33 | 17d | 1 | 0.19mi |
| 2121 11th Ave S Unit 2 Minneapolis, MN | 4.0 | 1.0 | 1800 | $2,450 | $1.36 | 4d | 1 | 0.20mi |
| 2121 13th Ave S Unit 4 Minneapolis, MN | 4.0 | 1.5 | 1100 | $1,825 | $1.66 | 43d | 1 | 0.29mi |
| 735 E 16th St #2 Minneapolis, MN | 3.0 | 1.0 | 1296 | $1,650 | $1.27 | 24d | 1 | 0.30mi |
| 1819 15th Ave S Minneapolis, MN | 3.0 | 1.5 | 1700 | $2,050 | $1.21 | 14d | 1 | 0.37mi |
| 1518 Park Ave Minneapolis, MN | 3.0 | 1.0 | 1200 | $1,850 | $1.54 | 10d | 1 | 0.38mi |
| 1518 Park Ave Minneapolis, MN | 3.0 | 1.0 | 1200 | $1,850 | $1.54 | 14d | 1 | 0.38mi |
| 2108 16th Ave S Unit 1 Minneapolis, MN | 3.0 | 1.0 | 1020 | $1,750 | $1.72 | 43d | 1 | 0.48mi |
| 2540 12th Ave S Apt 2 Minneapolis, MN | 5.0 | 2.0 | 1700 | $2,450 | $1.44 | 43d | 1 | 0.51mi |
| 739 E 27th St Unit 739 Minneapolis, MN | 4.0 | 1.0 | 1699 | $2,600 | $1.53 | 24d | 1 | 0.66mi |
| 2107 Cedar Ave S Minneapolis, MN | 3.0 | 1.0–2.0 | 792 | $1,717 | $2.17 | 1d | 26 | 0.69mi |
| 1111 3rd Ave S Unit 1511914P Minneapolis, MN | 4.0 | 1.0–2.0 | 1081 | $11,990 | $11.09 | 2d | 2 | 0.74mi |
| 2730 Portland Ave Minneapolis, MN | 1.0–3.0 | 1.0–2.0 | 940 | $1,755 | $1.87 | 7d | 3 | 0.80mi |
| 10 E 18th St Unit E626 Minneapolis, MN | 3.0 | 2.0 | 995 | $2,389 | $2.40 | 7d | 1 | 0.83mi |
| 1702 Nicollet Ave Minneapolis, MN | 3.0 | 1.0–2.0 | 685 | $2,276 | $3.32 | 24d | 23 | 0.87mi |
| 212 10th Ave S Minneapolis, MN | 3.0 | 1.0–2.5 | 1490 | $8,588 | $5.76 | 1d | 10 | 1.01mi |
| 1369 Spruce Pl Minneapolis, MN | 1.0–3.0 | 1.0–2.5 | 1396 | $6,750 | $4.83 | 2d | 24 | 1.03mi |
| 101 S 5th St Minneapolis, MN | 3.0 | 1.0–2.0 | 1249 | $4,049 | $3.24 | 2d | 35 | 1.10mi |
| 2821 1st Ave S Unit 2 Minneapolis, MN | 3.0 | 1.0 | 1743 | $1,600 | $0.92 | 2d | 1 | 1.11mi |
| 400 Marquette Ave Minneapolis, MN | 3.0 | 1.0–2.0 | 1103 | $5,615 | $5.09 | 2d | 14 | 1.18mi |
| 365 Nicollet Mall Minneapolis, MN | 3.0 | 1.0–3.5 | 1656 | $9,753 | $5.89 | 3d | 33 | 1.20mi |
| 2016 25th Ave S Minneapolis, MN | 4.0 | 2.0 | 1600 | $1,900 | $1.19 | 43d | 1 | 1.21mi |
| 2200 Harriet Ave Unit F Minneapolis, MN | 3.0 | 1.0 | 1100 | $1,750 | $1.59 | 43d | 1 | 1.23mi |
| 3015 19th Ave S Unit 1 Minneapolis, MN | 3.0 | 1.0 | 960 | $1,750 | $1.82 | 43d | 1 | 1.32mi |
| 270 Hennepin Ave Minneapolis, MN | 3.0 | 1.0–3.0 | 1505 | $9,421 | $6.26 | 2d | 54 | 1.36mi |
| 2535 Aldrich Ave S Unit 3 Minneapolis, MN | 3.0 | 1.5 | 1050 | $2,100 | $2.00 | 14d | 1 | 1.45mi |
Listing history 32 events
-
2026-06-18days on market $219,900 Active 98 DOM
-
2026-06-17days on market $219,900 Active 97 DOM
-
2026-06-16days on market $219,900 Active 96 DOM
-
2026-06-15days on market $219,900 Active 95 DOM
-
2026-06-13days on market $219,900 Active 93 DOM
-
2026-06-09days on market $219,900 Active 89 DOM
-
2026-06-08days on market $219,900 Active 88 DOM
-
2026-06-07days on market $219,900 Active 87 DOM
-
2026-06-04days on market $219,900 Active 84 DOM
-
2026-06-03days on market $219,900 Active 83 DOM
-
2026-06-02days on market $219,900 Active 82 DOM
-
2026-06-02price $219,900 Active 81 DOM
-
2026-06-01days on market $225,000 Active 81 DOM
-
2026-05-31days on market $225,000 Active 80 DOM
-
2026-05-04price $225,000 306-char remark
Show marketing remark (306 chars)
Wonderful home in Ventura Village. The home is much larger than it appears from the street. With generous room sizes, high ceilings, Hardwood floors and plenty of natural light. Enjoy the formal dining room, convenient 3-season porch and private backyard. Walk to shopping, restaurants, bus line, and more.
-
2026-04-14price $229,900 306-char remark
Show marketing remark (306 chars)
Wonderful home in Ventura Village. The home is much larger than it appears from the street. With generous room sizes, high ceilings, Hardwood floors and plenty of natural light. Enjoy the formal dining room, convenient 3-season porch and private backyard. Walk to shopping, restaurants, bus line, and more.
-
2026-03-13$259,900 Active 306-char remark
Show marketing remark (306 chars)
Wonderful home in Ventura Village. The home is much larger than it appears from the street. With generous room sizes, high ceilings, Hardwood floors and plenty of natural light. Enjoy the formal dining room, convenient 3-season porch and private backyard. Walk to shopping, restaurants, bus line, and more.
-
2026-03-12historical $259,900 306-char remark
Show marketing remark (306 chars)
Wonderful home in Ventura Village. The home is much larger than it appears from the street. With generous room sizes, high ceilings, Hardwood floors and plenty of natural light. Enjoy the formal dining room, convenient 3-season porch and private backyard. Walk to shopping, restaurants, bus line, and more.
-
2021-05-27soldstatus $246,000
-
2021-05-18soldstatus $248,000 Sold 391-char remark
Show marketing remark (391 chars)
New improvements ( pictured) include adding the doors & making a closet on the main floor for the 3rd bedroom- New concrete sidewalk to the front of the house - New kitchen floor- Beautiful lovingly maintained Ventura Village home, much larger than it looks- generous room sizes, high ceilings, Hardwood floors & plenty of natural light- walk to shopping, restaurants & bus line-
-
2021-02-26status Pending 391-char remark
Show marketing remark (391 chars)
New improvements ( pictured) include adding the doors & making a closet on the main floor for the 3rd bedroom- New concrete sidewalk to the front of the house - New kitchen floor- Beautiful lovingly maintained Ventura Village home, much larger than it looks- generous room sizes, high ceilings, Hardwood floors & plenty of natural light- walk to shopping, restaurants & bus line-
-
2021-02-17historical Contingent - Inspection 391-char remark
Show marketing remark (391 chars)
New improvements ( pictured) include adding the doors & making a closet on the main floor for the 3rd bedroom- New concrete sidewalk to the front of the house - New kitchen floor- Beautiful lovingly maintained Ventura Village home, much larger than it looks- generous room sizes, high ceilings, Hardwood floors & plenty of natural light- walk to shopping, restaurants & bus line-
-
2020-10-08price $248,000 391-char remark
Show marketing remark (391 chars)
New improvements ( pictured) include adding the doors & making a closet on the main floor for the 3rd bedroom- New concrete sidewalk to the front of the house - New kitchen floor- Beautiful lovingly maintained Ventura Village home, much larger than it looks- generous room sizes, high ceilings, Hardwood floors & plenty of natural light- walk to shopping, restaurants & bus line-
-
2020-08-31$250,000 Active 391-char remark
Show marketing remark (391 chars)
New improvements ( pictured) include adding the doors & making a closet on the main floor for the 3rd bedroom- New concrete sidewalk to the front of the house - New kitchen floor- Beautiful lovingly maintained Ventura Village home, much larger than it looks- generous room sizes, high ceilings, Hardwood floors & plenty of natural light- walk to shopping, restaurants & bus line-
-
2017-03-30soldstatus $145,000
-
2016-11-08soldstatus $145,000 Sold
-
2016-10-26status Pending
-
2016-09-13historical Contingent - Inspection
-
2016-09-01price $155,000
-
2016-08-24price $159,000
-
2016-08-21price $162,000
-
2016-08-10$178,000 Active
ⓘ Source: listings_history table (triggers on properties + properties_extension) + one-shot
backfill from property_details.listing_events for pre-trigger history.
Tax reassessment forecast MN · Partial reset (capped growth)
- Current annual tax
- $3,571 · $298/mo
- Projected year-2 tax
- $3,571 · $298/mo
- Expected delta
- $0/yr ($0/mo · 0.0%)
ⓘ Screening estimate from a state-policy table — verify with the county assessor before closing.
Climate risk First Street
- Flood 1/10 Low FEMA zone X (unshaded) · 0% chance over 30 yrs
- Wildfire 1/10 Low
- Heat 2/10 Low 7 d/yr ≥99°F today · 14 d/yr by 30 yrs out
- Wind 2/10 Low
- Air quality 2/10 Low 1 unhealthy d/yr today · 1 by 30 yrs out
Nearby sold comps map
Loading sold comps map…
Walkable amenities ~0.75 mi
Loading nearby amenities…
Taxation est. · year 1
- Rental income
- $24,868
- − Mortgage interest
- −$12,318
- − Property taxes
- −$3,571
- − Insurance
- −$1,100
- − Repairs & maintenance
- −$1,989
- − Management
- −$1,989
- − Depreciation
- −$6,397
- Taxable loss
- −$2,496
- Est. tax savings @ 24.0%
- +$599
- After-tax cash flow
- $1,736/yr
For passive investors: Depreciation is non-cash, so a rental often shows a tax loss while cash-flowing — sheltering income. Rental losses are passive: they offset passive income freely, and up to $25,000/yr can offset ordinary (W-2) income if you actively participate and your MAGI is under $100k (phasing out to $0 by $150k); unused losses carry forward. On sale, claimed depreciation is recaptured at up to 25%, and gains may owe capital-gains tax (a 1031 exchange can defer both). Figures are a year-1 estimate at your 24.0% rate — not tax advice; consult a CPA.
Schools (NCES district)
- District
- Minneapolis Public School District
- NCES district ID
- 2721240
- Math proficiency
- 35% ▼ -7.00%
- Reading proficiency
- 46% ▼ -1.00%
- Median HH income
- $50,521
- Composite
- 34.92/100
- National rank
- #5067
- State rank
- #217 of 301 in MN
Livability — Minneapolis
- Score
- 78/100
- State rank
- #110
- US rank
- #2525
Category grades
Schools grade is shown separately in the Schools card above.
Census & demographics
- Census place
- Minneapolis, MN
- County
- Hennepin County · 1,150,272 people
- City population
- 417,555
- Metro
- Minneapolis-St. Paul-Bloomington, MN-WI
- Population (ZIP)
- 28,920
- Household income
- $41,940
- Rent vs Own
- Severe rent burden
- 2999.0
Population outlook (Hennepin County) Hauer SSP2
- Today (2025)
- 1,405,227 people
- By 2030
- 1,492,650 · +6.2%
- By 2040
- 1,660,157 · +18.1%
- By 2050
- 1,823,498 · +29.8%
- By 2075
- 2,221,283 · +58.1%
- By 2100
- 2,509,976 · +78.6%
Race, ethnicity, and origin ACS 2023
- Neighborhood character
- Highly diverse neighborhood (Simpson 0.72)
- Race & ethnicity
- White 36% Black 32% Hispanic / Latino 20% Two or more races 10% Native American 5% Asian 4%
- Hispanic origin (detail)
- Mexican 8%
- Common ancestry
- Portuguese 5% Romanian 3% Lithuanian 3%
- Foreign-born
- 24% · Canada, China, United Kingdom
- Languages at home
- 63% English-only · Spanish 13% Other Asian/Pacific 2% French/Haitian/Cajun 1%
Political lean MEDSL · Hennepin
- 2024 margin
- Solid D (+42.6) · D 70.2% · R 27.5% · Other 2.3%
- 2008→2024 swing
- +14.0pp toward D · 2008: 28.6pp · 2024: 42.6pp
- All cycles
- 2024: D+42.6 2020: D+43.2 2016: D+35.3 2012: D+27.1 2008: D+28.6
Not yet ingested
- Civics
- —
Market trends
- HPI YoY
- ▼ -112.31%
- Current HPI
- 224.8886
- Rent YoY
- ▲ 1.00%
- Metro
- Minneapolis-St. Paul-Bloomington, MN-WI
- State GDP YoY
- ▲ 2.41%
- F500 in state
- 34
Industry mix (Fortune 500 HQ in MN)
| Industry | F500 HQs | Revenue |
|---|---|---|
| Healthcare | 2 | $407B |
|
||
| Retail | 2 | $150B |
|
||
| Consumer Goods | 2 | $32B |
|
||
| Industrial Machinery | 2 | $6B |
|
||
| Agriculture | 1 | $40B |
|
||
| Healthcare / Medical Devices | 1 | $32B |
|
||
Price history
+26.4% since first listed18 events — show timeline
- 2026-05-04 Price Changed $225,000 NORTHSTARMLS as Distributed by MLS Grid
- 2026-04-14 Price Changed $229,900 NORTHSTARMLS as Distributed by MLS Grid
- 2026-03-13 Listed $259,900 NORTHSTARMLS as Distributed by MLS Grid
- 2026-03-12 Coming Soon $259,900 NORTHSTARMLS as Distributed by MLS Grid
- 2021-05-27 Sold (Public Records) $246,000 Public Records
- 2021-05-18 Sold (MLS) $248,000 NORTHSTARMLS as Distributed by MLS Grid
- 2021-02-26 Pending — NORTHSTARMLS as Distributed by MLS Grid
- 2021-02-17 Contingent — NORTHSTARMLS as Distributed by MLS Grid
- 2020-10-08 Price Changed $248,000 NORTHSTARMLS as Distributed by MLS Grid
- 2020-08-31 Listed $250,000 NORTHSTARMLS as Distributed by MLS Grid
- 2017-03-30 Sold (Public Records) $145,000 Public Records
- 2016-11-08 Sold (MLS) $145,000 NORTHSTARMLS as Distributed by MLS Grid
- 2016-10-26 Pending — NORTHSTARMLS as Distributed by MLS Grid
- 2016-09-13 Contingent — NORTHSTARMLS as Distributed by MLS Grid
- 2016-09-01 Price Changed $155,000 NORTHSTARMLS as Distributed by MLS Grid
- 2016-08-24 Price Changed $159,000 NORTHSTARMLS as Distributed by MLS Grid
- 2016-08-21 Price Changed $162,000 NORTHSTARMLS as Distributed by MLS Grid
- 2016-08-10 Listed $178,000 NORTHSTARMLS as Distributed by MLS Grid
Property tax history
+1.9%/yrLatest (2025): $3,571 · +12.0% YoY. Source: county tax records.
Cash-flow waterfall
monthlySold comps — $/sqft
last 12 mo · ≤1 miLoading sold comps…