 Multi-family
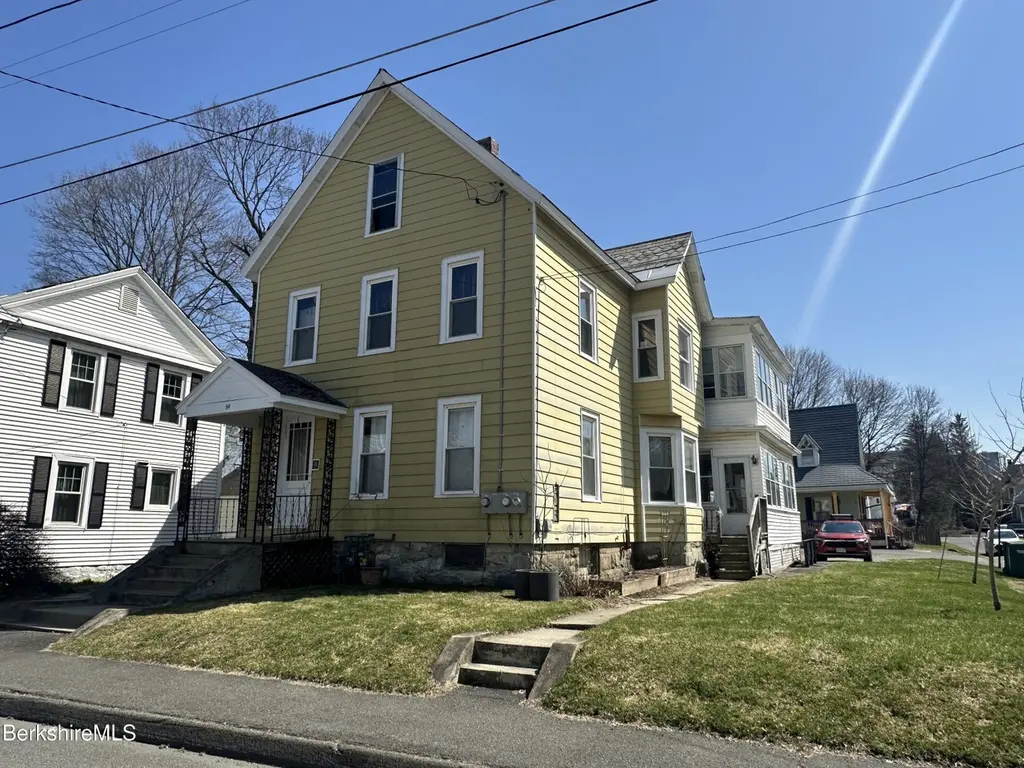
84 Washington Ave · North Adams, MA
Flood risk 6/10 · Moderate
- FEMA flood zone
- X
- Chance of flooding over 30 yrs
- 0.49%
- Est. flood insurance / yr
- $473 – $860
Fire risk 1/10 · Minimal
- Est. fire insurance / yr
- $915 – $1,699
Heat risk 3/10 · Minor
- Hot days now (above 92°F)
- 9 days/yr
- Hot days in 30 yrs
- 20 days/yr
Wind risk 4/10 · Minor
- Chance of severe wind over 30 yrs
- 8.0%
Air-quality risk 2/10 · Minimal
- Unhealthy air days now
- 0 days/yr
- Unhealthy air days in 30 yrs
- 1 days/yr
Risk factors via First Street. Map © Google.
Why this score? — see what drove the D grade
The composite is a weighted blend of 9 inputs, each scored 0–100. Each bar is that input's sub-score; the figure is the points it added to the 100-point composite (weight × sub-score).
- Cash flow +15.1/30.0
- ARV discount +6.1/15.0
- DSCR +4.6/10.0
- 1% rule +3.5/10.0
- Livability +2.8/5.0
- Rent growth +2.5/5.0
- Condition / age +2.5/5.0
- Appreciation +1.9/10.0
- Schools +1.8/10.0
$264,000
🖨 Deal sheet (PDF) 📄 Offer letter ✓ Due diligence
Multi-family units
County records classify this as Multi-Family (2-4 Unit). Listing-text estimate: 1 unit. estimate disagrees with records
Listing remarks MLS
Centrally located two family home situated on a corner lot. Short walk to downtown and MCLA. Each unit includes ample off street parking, laundry hookups, hardwood floors, and attached porches. Lower unit features a total of three bedrooms and two full bathrooms. Set up as a traditional two bedroom unit with an attached in-law suite with a separate entrance, bathroom, and kitchen that is currently used as a laundry room. Upper unit includes two bedrooms and one bathroom with a spacious living and formal dining room.
Key facts
- In-law suite
- Attached porches
- Corner lot
Tags
Neighborhood map
What this means for you Summary
Snapshot
- This is a 6-bed/3.0-bath multifamily listed at $264k.
Deal economics
- At list price, monthly cash flow is $87 ($1k/yr) — positive.
- The deal already cash-flows at list — no discount required.
- To meet the 1% rule (rent ≥ 1% of price), the offer needs to be $224k (15.2% below list).
- Recommended offer: $224k (15.2% below list) — sets the bar for 1% rule.
Location & tenants
- Location reads 55/100 on livability (#242 in MA) — a working-class tenant base; expect higher turnover. Strengths: housing A+, cost of living A-; Watch: employment C-, health & safety D, crime F.
- North Adams (town): math 14% / reading 29% proficiency, ranked #291 of 302 in MA (top 96%) — low school quality limits family demand, transient renter base, plan for 1-2y turnover.
- Zoned schools: Colegrove Park Elementary (math 8% / reading 37%, grade F, #753 of 938 statewide, top 81%, 235 students, 0% FRL); Drury High (math 16% / reading 24%, grade F, #308 of 343 statewide, top 91%, 493 students, 0% FRL) — zoned schools average 0% FRL vs 53% district-wide (53 pts lower); this property's tenant base skews higher-income than the district average.
- Market conditions: 99 active listings in the ZIP; 130 units permitted in Berkshire County in 2024 (10 in 5+ unit buildings).
Forward outlook
- Local home prices are declining (-3.0%/yr); year-one equity from $2k of loan paydown is wiped out by about $8k of value loss. Plan a longer hold.
- Berkshire County population projected at -24% by 2050 — secular population decline; favor cash flow + early exit over multi-decade hold.
Negotiation context
- It's been on market 70 days — a 6% lower offer ($248k) is reasonable based on typical stale-listing flexibility.
- 3 sale attempts since 11y ago; this cycle's ask has dropped $16k (6%) from the opening price — seller is motivated, your offer sets the floor, not the list.
- Current owner paid $126k; list at $264k implies a 109% gain — meaningful room to come down on a strong offer.
Risks & watch-outs
- Watch-outs: built in 1870 — expect roof / HVAC / electrical / plumbing capex.
- Climate carrying-cost: major flood risk — expect insurance premiums to compound above CPI over the hold.
Questions for the listing agent
- It's been on market 70 days. Have you received any prior offers? Is the seller open to a 15% concession, seller financing, or rate buy-down credit?
- Built in 1870 — when were the roof, HVAC, electrical panel, plumbing, and water heater last replaced?
- Why hasn't it sold? Are there any deal-killer items the seller is aware of (foundation, flood, title, zoning, code violations)?
- Is there a deadline driving the sale (1031 exchange, divorce, estate, relocation)? That informs how much negotiation room exists.
- Schools are F-rated, which usually means shorter tenancies and higher turnover. Who's the typical renter profile here, and what's been the actual vacancy rate?
- Crime grade is F in this area — have there been break-ins, vandalism, or insurance claims at this property in the last 3 years? What carrier currently insures it and at what premium?
- The area grade is low — what's the realistic commute time and amenity access for the typical tenant pool here? Any planned neighborhood developments (good or bad) we should know about?
- What's the average days-on-market for RENTAL listings here right now (not sales)? A rising rental-DOM trend means longer vacancies and softer asking-rent achievability than the comps imply.
- What's the recent tenant-quality profile in this submarket — average credit score on applications, eviction rate, late-payment / NSF rate, and stable-employment percentage? A property-management company in the area should have these aggregated.
- How much new apartment / multifamily construction is in the pipeline within 1–3 miles? Heavy new supply (>2% of stock underway) typically softens rents 12–24 months out; light construction supports rent growth.
Investment metrics
- 1% rule
- 0.85% ✗
- Cap rate
- 6.69%
- Cash-on-cash
- 1.41%
- DSCR
- 1.06
- GRM
- 9.8
CMA / ARV
- ARV (median comp)
- $255,835
- List price
- $264,000
- Delta
- 3.19%
- Verdict
- FAIR
- Comps
- 20 within 1.0 mi
Show comp detail 12 sales within ~0.75 mi
| Address | Dist | Beds/Ba | Sqft | Sold | Price | $/sf | Match |
|---|---|---|---|---|---|---|---|
| 152 Furnance St | 0.48mi | 6/3.0 | 2,282 (-8%) | 5mo | $325,000 | $142 | 60 |
| 62-64 Chase Ave | 0.68mi | 6/4.0 | 2,522 (+2%) | 2mo | $135,000 | $54 | 60 |
| 66-68 Bracewell Ave | 0.58mi | 6/2.0 | 2,544 (+3%) | 7mo | $111,500 | $44 | 59 |
| 164 - 166 Houghton St | 0.72mi | 6/2.5 | 2,550 (+3%) | 2mo | $130,000 | $51 | 58 |
| 33-35 Hall St | 0.63mi | 5/2.0 (-1) | 2,584 (+4%) | 2mo | $279,900 | $108 | 53 |
| 57 Beacon St | 0.57mi | 7/3.0 (+1) | 2,302 (-7%) | 8mo | $275,000 | $119 | 50 |
| 183 State St | 0.44mi | 5/3.0 (-1) | 2,672 (+8%) | 20mo | $200,000 | $75 | 45 |
| 93-95 Bracewell Ave | 0.62mi | 7/2.5 (+1) | 2,342 (-6%) | 15mo | $248,000 | $106 | 42 |
| 47-51 Franklin St | 0.74mi | 5/3.0 (-1) | 2,366 (-4%) | 13mo | $339,000 | $143 | 42 |
| 159 Eagle St | 0.53mi | 7/3.5 (+1) | 2,117 (-15%) | 6mo | $15,000 | $7 | 39 |
| 86 W Main St | 0.68mi | 5/3.0 (-1) | 2,567 (+4%) | 22mo | $182,000 | $71 | 38 |
| 17-17 1/2 Jackson St | 0.54mi | 6/3.0 | 2,132 (-14%) | 20mo | $200,000 | $94 | 34 |
Match score weights: distance 35% · size 25% · config 20% · recency 20%. Top-matched comps best support the ARV.
Projected returns pro-forma
-3.0% appreciation · 3.0% rent growth · sell at horizon
- IRR
- -14.1%
- Equity multiple
- 0.50×
- Total profit
- $-37,289
- Equity at exit
- $39,363
- IRR
- -5.3%
- Equity multiple
- 0.65×
- Total profit
- $-25,551
- Equity at exit
- $22,826
Cash invested: $73,920 (down + closing). Projections, not guarantees.
Landlord ↔ Tenant lean methodology
- Overall (STATE)
- 20 Strongly Tenant-Friendly
- State Massachusetts
- 20 Strongly Tenant-Friendly · D+15
- County
- — inherits STATE
- City
- — inherits STATE
ZIP-level market 01247
- Home prices YoY
- -2.0%
- Active inventory
- 99
- Price-to-rent
- 9.8×
Monthly cashflow live
- Estimated rent
- $2,239 medium interval (Pro) →
- Mortgage (P&I)
- −$1,384
- Tax from tax record
- −$188 /mo · $2,251/yr
- Insurance
- −$110
- HOA
- −$0
- Lot rent
- −$0
- Vacancy / Maint / Mgmt
- −$470
- Net cashflow
- $87
Break-even live
Sensitivity live
| Price | -10% $236 | -5% $162 | +0% $87 | +5% $12 | +10% $-62 |
|---|---|---|---|---|---|
| Rent | -10% $-90 | -5% $-1 | +0% $87 | +5% $175 | +10% $264 |
| Rate | -1.0pp $220 | -0.5pp $154 | base $87 | +0.5pp $19 | +1.0pp $-51 |
UW: 25.0% down · 7.5% · 30yr · 1.5% tax · 5.0% vac · 8.0% maint · 8.0% mgmt
Financing live
Cash to close
- Down payment
- $66,000
- Closing costs
- $7,920
- Reserves months
- —
- Total cash needed
- —
Loan-product check · same deal, 3 products live
Conventional
25% down · 7.5% · 30yr
- Down + closing
- —
- Monthly P&I
- —
- Monthly cashflow
- —
- DSCR
- —
- Eligible?
- —
Personal DTI + credit; lowest rate.
DSCR
20% down · 8.5% · 30yr
- Down + closing
- —
- Monthly P&I
- —
- Monthly cashflow
- —
- DSCR
- —
- Eligible?
- —
No personal income docs; deal must DSCR.
Hard money
10% down · 12.0% · 12mo
- Down + closing
- —
- Monthly P&I
- —
- Monthly cashflow
- —
- DSCR
- —
- Eligible?
- —
Short-term bridge; refi at stabilization.
Listing history 25 events
-
2026-06-22days on market $264,000 Active 70 DOM
-
2026-06-21days on market $264,000 Active 69 DOM
-
2026-06-21days on market $264,000 Active 68 DOM
-
2026-06-18remarks 699-char remark
-
2026-06-18pricedays on market $264,000 Active 66 DOM
-
2026-06-17days on market $269,000 Active 65 DOM
-
2026-06-16days on market $269,000 Active 64 DOM
-
2026-06-15days on market $269,000 Active 63 DOM
-
2026-06-13days on market $269,000 Active 61 DOM
-
2026-06-12days on market $269,000 Active 60 DOM
-
2026-06-09days on market $269,000 Active 57 DOM
-
2026-06-08days on market $269,000 Active 56 DOM
-
2026-06-07days on market $269,000 Active 55 DOM
-
2026-06-07days on market $269,000 Active 54 DOM
-
2026-06-04days on market $269,000 Active 51 DOM
-
2026-06-02days on market $269,000 Active 50 DOM
-
2026-06-01days on market $269,000 Active 49 DOM
-
2026-05-31days on market $269,000 Active 48 DOM
-
2026-05-31days on market $269,000 Active 47 DOM
-
2026-05-12price $269,000 522-char remark
Show marketing remark (522 chars)
Centrally located two family home situated on a corner lot. Short walk to downtown and MCLA. Each unit includes ample off street parking, laundry hookups, hardwood floors, and attached porches. Lower unit features a total of three bedrooms and two full bathrooms. Set up as a traditional two bedroom unit with an attached in-law suite with a separate entrance, bathroom, and kitchen that is currently used as a laundry room. Upper unit includes two bedrooms and one bathroom with a spacious living and formal dining room.
-
2026-04-13$279,900 Active 522-char remark
Show marketing remark (522 chars)
Centrally located two family home situated on a corner lot. Short walk to downtown and MCLA. Each unit includes ample off street parking, laundry hookups, hardwood floors, and attached porches. Lower unit features a total of three bedrooms and two full bathrooms. Set up as a traditional two bedroom unit with an attached in-law suite with a separate entrance, bathroom, and kitchen that is currently used as a laundry room. Upper unit includes two bedrooms and one bathroom with a spacious living and formal dining room.
-
2019-07-18soldstatus $126,189
-
2019-07-18$126,189
-
2016-04-19soldstatus $45,000
-
2015-11-18$69,900
ⓘ Source: listings_history table (triggers on properties + properties_extension) + one-shot
backfill from property_details.listing_events for pre-trigger history.
Tax reassessment forecast MA · Partial reset (capped growth)
- Current annual tax
- $2,251 · $188/mo
- Projected year-2 tax
- $2,749 · $229/mo
- Expected delta
- +$498/yr (+$42/mo · 22.1%)
ⓘ Screening estimate from a state-policy table — verify with the county assessor before closing.
Climate risk First Street
- Flood 6/10 Major FEMA zone X · 49% chance over 30 yrs
- Wildfire 1/10 Low
- Heat 3/10 Moderate 9 d/yr ≥92°F today · 20 d/yr by 30 yrs out
- Wind 4/10 Moderate 8% chance of damaging wind over 30 yrs
- Air quality 2/10 Low 0 unhealthy d/yr today · 1 by 30 yrs out
Nearby sold comps map
Loading sold comps map…
Walkable amenities ~0.75 mi
Loading nearby amenities…
Taxation est. · year 1
- Rental income
- $26,872
- − Mortgage interest
- −$14,788
- − Property taxes
- −$2,251
- − Insurance
- −$1,320
- − Repairs & maintenance
- −$2,150
- − Management
- −$2,150
- − Depreciation
- −$7,680
- Taxable loss
- −$3,467
- Est. tax savings @ 24.0%
- +$832
- After-tax cash flow
- $1,877/yr
For passive investors: Depreciation is non-cash, so a rental often shows a tax loss while cash-flowing — sheltering income. Rental losses are passive: they offset passive income freely, and up to $25,000/yr can offset ordinary (W-2) income if you actively participate and your MAGI is under $100k (phasing out to $0 by $150k); unused losses carry forward. On sale, claimed depreciation is recaptured at up to 25%, and gains may owe capital-gains tax (a 1031 exchange can defer both). Figures are a year-1 estimate at your 24.0% rate — not tax advice; consult a CPA.
Schools (NCES district)
- District
- North Adams
- NCES district ID
- 2508670
- Math proficiency
- 14% ▼ -13.00%
- Reading proficiency
- 29% ▼ -11.00%
- Median HH income
- $36,746
- Composite
- 17.83/100
- National rank
- #9006
- State rank
- #291 of 302 in MA
Livability — North Adams
- Score
- 55/100
- State rank
- #242
- US rank
- #23506
Category grades
Schools grade is shown separately in the Schools card above.
Census & demographics
- Census place
- North Adams, MA
- City population
- 14,967
- Population (ZIP)
- 14,967
Population outlook (Berkshire County) Hauer SSP2
- Today (2025)
- 119,723 people
- By 2030
- 114,608 · -4.3%
- By 2040
- 102,806 · -14.1%
- By 2050
- 91,305 · -23.7%
- By 2075
- 71,517 · -40.3%
- By 2100
- 57,988 · -51.6%
Race, ethnicity, and origin ACS 2023
- Neighborhood character
- Predominantly White (88%)
- Race & ethnicity
- White 88% Hispanic / Latino 5% Two or more races 4% Asian 3%
- Hispanic origin (detail)
- Puerto Rican 1%
- Common ancestry
- Lithuanian 15% Romanian 4% German 2%
- Foreign-born
- 5% · Canada
- Languages at home
- 95% English-only · Other Indo-European 2% Spanish 2% French/Haitian/Cajun 0%
Political lean MEDSL · Berkshire
- 2024 margin
- Solid D (+39.9) · D 68.9% · R 29.0% · Other 2.1%
- 2008→2024 swing
- -12.5pp toward R · 2008: 52.4pp · 2024: 39.9pp
- All cycles
- 2024: D+39.9 2020: D+47.1 2016: D+41.5 2012: D+53.7 2008: D+52.4
Not yet ingested
- Civics
- —
Market trends
- HPI YoY
- ▼ -6.22%
- Current HPI
- 298.8949
- Rent YoY
- —
- Metro
- —
- State GDP YoY
- ▲ 2.28%
- F500 in state
- 38
Industry mix (Fortune 500 HQ in MA)
| Industry | F500 HQs | Revenue |
|---|---|---|
| Technology | 3 | $17B |
|
||
| Insurance | 2 | $84B |
|
||
| Retail | 2 | $76B |
|
||
| Life Sciences | 1 | $43B |
|
||
| Energy Technology | 1 | $31B |
|
||
| Aerospace / Defense | 1 | $18B |
|
||
Price history
+284.8% since first listed6 events — show timeline
- 2026-05-12 Price Changed $269,000 BCMLS
- 2026-04-13 Listed $279,900 BCMLS
- 2019-07-18 Listed $126,189 BCMLS
- 2019-07-18 Sold (MLS) $126,189 BCMLS
- 2016-04-19 Sold (MLS) $45,000 BCMLS
- 2015-11-18 Listed $69,900 BCMLS
Property tax history
+1.6%/yrLatest (2023): $2,251 · +2.4% YoY. Source: county tax records.
Cash-flow waterfall
monthlySold comps — $/sqft
last 12 mo · ≤1 miLoading sold comps…