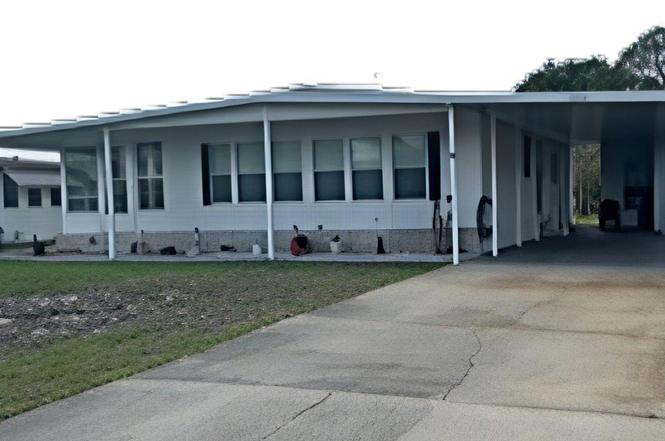
1211 Apache Cir · Tavares, FL
Flood risk 1/10 · Minimal
- FEMA flood zone
- X (unshaded)
- Chance of flooding over 30 yrs
- 0.0%
- Est. flood insurance / yr
- $507 – $1,088
Fire risk 1/10 · Minimal
- Est. fire insurance / yr
- $947 – $1,759
Heat risk 8/10 · Major
- Hot days now (above 108°F)
- 7 days/yr
- Hot days in 30 yrs
- 20 days/yr
Wind risk 9/10 · Severe
- Chance of severe wind over 30 yrs
- 99.0%
Air-quality risk 2/10 · Minimal
- Unhealthy air days now
- 1 days/yr
- Unhealthy air days in 30 yrs
- 1 days/yr
Risk factors via First Street. Map © Google.
Why this score? — see what drove the B+ grade
The composite is a weighted blend of 9 inputs, each scored 0–100. Each bar is that input's sub-score; the figure is the points it added to the 100-point composite (weight × sub-score).
- Cash flow +30.0/30.0
- ARV discount +15.0/15.0
- DSCR +10.0/10.0
- 1% rule +8.6/10.0
- Schools +4.2/10.0
- Livability +3.8/5.0
- Rent growth +3.5/5.0
- Condition / age +2.5/5.0
- Appreciation +0.0/10.0
$129,000
🖨 Deal sheet 📄 Offer letter ✓ Due diligence
Listing remarks
Under contract-accepting backup offers. 55+ community. Desirable community with indoor and outdoor pools, a spacious clubhouse hosting frequent social events. The home offers 2 bedrooms, 2 baths, walk-in closets, a large living room with bay windows, a big Florida room, and a carport with a new roof. Lovely wood floors in most rooms. Open floor plan offers a great lifestyle. The lanai is spacious - perfect for a hobby room - plants will love it.
Key facts
- Walk-in closets
- Big florida room
- Spacious clubhouse
Tags
Property features AI
Finance
- Other: Partially furnished; No lease restrictions indicated; Direction faces: East
- Financial info: Annual taxes listed (2025): $400; Total monthly fees shown as $52 (total annual fees $624)
- HOA & community: Has HOA (monthly fee $52, association approval required); Association name: Harold Barkdull; Community clubhouse and pool; Senior community; Pets allowed
Exterior
- Parking: Carport (1 space)
- Utilities: Electricity connected; Public water not listed; Public sewer; Sewer connected
- Home design: Manufactured double wide home; Residential property; One story; East-facing
- Construction: Metal frame construction; Metal roof; Roof over; Crawlspace foundation; Building area listed as 2,010 sq ft (public records)
- Exterior features: Paved road access; Lot approximately 0.14 acres; Lot about 0 to less than 1/4 acre
Interior
- Kitchen: Range; Refrigerator
- Bedrooms: 2 bedrooms
- Flooring: Carpet; Laminate; Wood
- Bathrooms: 2 full bathrooms
- Heating & cooling: Central heating; Central air conditioning
- Interior features: Walk-in closet(s); Florida room
- Laundry & utility: Laundry room; Outdoor laundry access; Electric water heater
Neighborhood map
What this means for you Summary
Snapshot
- This is a 2-bed/2.0-bath manufactured listed at $129k.
Deal economics
- At list price, monthly cash flow is $572 ($7k/yr) — positive.
- The deal already cash-flows at list — no discount required.
- Meets the 1% rule at list price ($2k rent vs $129k).
- Recommended offer: $121k (6.0% below list) — sets the bar for market timing.
- Cap rate 11.6% vs local median 4.5% in Tavares — top-decile yield for the area; either an underpriced asset or a hidden risk that comps aren't pricing in. Stress-test before assuming the spread holds.
Location & tenants
- Location reads 76/100 on livability (#220 in FL, #3,464 nationally) — a middle-class / working-renter tenant base. Strengths: crime A+, cost of living A+, housing A+; Watch: employment D, amenities F, commute F.
- Lake (suburban): math 49% / reading 50% proficiency, ranked #37 of 73 in FL (top 51%) — families likely to look elsewhere, expect single-tenant / working-renter base with shorter leases.
- Market conditions: Rents rising fast (+4.0%/yr); 501 active listings in the ZIP; 13 comparable units currently listed for rent nearby; rentals at typical pace (median 18d on market — plan ~3-4 weeks tenant-placement turnaround); 4,799 units permitted in Lake County in 2024 (814 in 5+ unit buildings).
- This rent runs 33% of the median local income ($63k/yr) — at the standard rent-burdened threshold; future hikes will face affordability resistance.
Forward outlook
- Local home prices are declining (-3.0%/yr); year-one equity from $892 of loan paydown is wiped out by about $4k of value loss. Plan a longer hold.
- Lake County population projected at +37% by 2050 — long-run rental-demand tailwind backs the buy-and-hold thesis.
- At projected returns (-3.0% appreciation + 4.0% rent growth), your $36k cash investment doubles in ~6 years — after that, you're playing with house money.
Negotiation context
- It's been on market 73 days — a 6% lower offer ($121k) is reasonable based on typical stale-listing flexibility.
- Current owner paid $44k; list at $129k implies a 193% gain — meaningful room to come down on a strong offer.
Risks & watch-outs
- Climate carrying-cost: severe wind risk, 99% chance of damaging wind over 30y; extreme-heat days projected 7→20/yr by 2055 (HVAC capex compounding) — expect insurance premiums to compound above CPI over the hold.
Questions for the listing agent
- It's been on market 73 days. Have you received any prior offers? Is the seller open to a 6% concession, seller financing, or rate buy-down credit?
- What does the HOA fee cover, when was the last increase, and are there any pending special assessments or reserve-fund shortfalls?
- Why hasn't it sold? Are there any deal-killer items the seller is aware of (foundation, flood, title, zoning, code violations)?
- Is there a deadline driving the sale (1031 exchange, divorce, estate, relocation)? That informs how much negotiation room exists.
- What's the average days-on-market for RENTAL listings here right now (not sales)? A rising rental-DOM trend means longer vacancies and softer asking-rent achievability than the comps imply.
- What's the recent tenant-quality profile in this submarket — average credit score on applications, eviction rate, late-payment / NSF rate, and stable-employment percentage? A property-management company in the area should have these aggregated.
- How much new for-sale + rental construction is in the pipeline within 1–3 miles? Heavy new supply typically softens prices + rents 12–24 months out; constrained supply supports both.
Investment metrics
- 1% rule
- 1.36% ✓
- Cap rate
- 11.62%
- Cash-on-cash
- 19.01%
- DSCR
- 1.85
- GRM
- 6.1
CMA / ARV
- ARV (on-the-fly)
- $154,836
- Comps found
- 6
Show comp detail 6 sales within ~0.75 mi
| Address | Dist | Beds/Ba | Sqft | Sold | Price | $/sf | Match |
|---|---|---|---|---|---|---|---|
| 1687 Elkhart Cir | 0.32mi | 2/2.0 | 1,000 (-1%) | 6mo | $160,000 | $160 | 78 |
| 1024 Capella Dr | 0.16mi | 2/2.0 | 1,104 (+9%) | 4mo | $55,000 | $50 | 74 |
| 1209 Apache Cir | 0.01mi | 2/2.0 | 1,152 (+14%) | 9mo | $128,000 | $111 | 69 |
| 1424 Mohawk Cir | 0.12mi | 2/2.0 | 1,160 (+15%) | 2mo | $195,000 | $168 | 69 |
| 1408 Skyline Ct | 0.11mi | 2/2.0 | 1,144 (+13%) | 8mo | $92,000 | $80 | 67 |
| 1681 Elkhart Cir | 0.31mi | 2/2.0 | 1,125 (+11%) | 7mo | $172,000 | $153 | 61 |
Match score weights: distance 35% · size 25% · config 20% · recency 20%. Top-matched comps best support the ARV.
Projected returns pro-forma
-3.0% appreciation · 4.05% rent growth · sell at horizon
- IRR
- 12.0%
- Equity multiple
- 1.48×
- Total profit
- $17,392
- Equity at exit
- $19,234
- IRR
- 21.7%
- Equity multiple
- 2.93×
- Total profit
- $69,847
- Equity at exit
- $11,154
Cash invested: $36,120 (down + closing). Projections, not guarantees.
Landlord ↔ Tenant lean methodology
- Overall (STATE)
- 87 Strongly Landlord-Friendly
- State Florida
- 87 Strongly Landlord-Friendly · R+3
- County
- — inherits STATE
- City
- — inherits STATE
ZIP-level market 32778
- Home prices YoY
- -23.4%
- Rents YoY
- 4.0%
- Active inventory
- 501
- Price-to-rent
- 6.1×
Monthly cashflow live
- Estimated rent
- $1,757 high interval (Pro) →
- Mortgage (P&I)
- −$676
- Tax from tax record
- −$33 /mo · $400/yr
- Insurance
- −$54
- HOA
- −$52
- Vacancy / Maint / Mgmt
- −$369
- Net cashflow
- $572
Break-even live
UW: 25.0% down · 7.5% · 30yr · 1.5% tax · 5.0% vac · 8.0% maint · 8.0% mgmt
Financing live
Cash to close
- Down payment
- $32,250
- Closing costs
- $3,870
- Reserves months
- —
- Total cash needed
- —
Loan-product check · same deal, 3 products live
Conventional
25% down · 7.5% · 30yr
- Down + closing
- —
- Monthly P&I
- —
- Monthly cashflow
- —
- DSCR
- —
- Eligible?
- —
Personal DTI + credit; lowest rate.
DSCR
20% down · 8.5% · 30yr
- Down + closing
- —
- Monthly P&I
- —
- Monthly cashflow
- —
- DSCR
- —
- Eligible?
- —
No personal income docs; deal must DSCR.
Hard money
10% down · 12.0% · 12mo
- Down + closing
- —
- Monthly P&I
- —
- Monthly cashflow
- —
- DSCR
- —
- Eligible?
- —
Short-term bridge; refi at stabilization.
Rent comps 13 comps
| Address | Beds | Baths | Sqft | Rent | $/sqft | DOM | Units | Dist |
|---|---|---|---|---|---|---|---|---|
| 807 McLain Ct Tavares, FL | 2.0 | 2.0 | 1104 | $1,700 | $1.54 | 16d | 1 | 0.37mi |
| 1105 N Rockingham Ave Tavares, FL | 2.0 | 2.0 | 806 | $1,650 | $2.05 | 5d | 1 | 0.44mi |
| 743 E Alfred St Tavares, FL | 2.0 | 1.0 | 1000 | $1,450 | $1.45 | 24d | 1 | 0.57mi |
| 380 Dora Ave Tavares, FL | 2.0 | 1.0 | 750 | $1,399 | $1.87 | 15d | 1 | 0.57mi |
| 542 E Caroline St Tavares, FL | 2.0 | 1.0 | 812 | $1,400 | $1.72 | 24d | 1 | 0.57mi |
| 1632 Tudor Ln Unit 1632 Tavares, FL | 2.0 | 2.0 | 1047 | $1,595 | $1.52 | 18d | 1 | 0.66mi |
| 1403 E Alfred St Unit 200 Tavares, FL | 2.0 | 1.5 | 1000 | $2,000 | $2.00 | 18d | 1 | 0.74mi |
| 2225 Cypress Ct Unit 2C Tavares, FL | 2.0 | 2.0 | 1334 | $2,000 | $1.50 | 24d | 1 | 0.77mi |
| 2420 Ann Rou Rd Unit 201 Tavares, FL | 1.0 | 1.0 | 1000 | $1,555 | $1.55 | 18d | 1 | 1.20mi |
| 123 N Lake Ave Tavares, FL | 2.0 | 1.0 | 1120 | $1,595 | $1.42 | 24d | 1 | 1.23mi |
| 2460 Ann Rou Rd Unit 606 Tavares, FL | 2.0 | 2.0 | 1167 | $1,750 | $1.50 | 18d | 1 | 1.31mi |
| 2533 Bracknell Forest Trl Tavares, FL | 3.0 | 2.0 | 1483 | $2,100 | $1.42 | 3d | 1 | 1.43mi |
| 2551 Bracknell Forest Trl Tavares, FL | 3.0 | 2.0 | 1483 | $2,081 | $1.40 | 16d | 1 | 1.43mi |
HOA detail
- Monthly dues
- $52 · $624/yr
- Likely covers
- pool
Listing history 4 events
-
2026-04-13price $129,000
-
2026-04-08price $133,900
-
2026-03-14$134,900 Active
-
2000-07-18soldstatus $44,000
ⓘ Source: listings_history table (triggers on properties + properties_extension) + one-shot
backfill from property_details.listing_events for pre-trigger history.
Tax reassessment forecast FL · Resets to sale price
- Current annual tax
- $400 · $33/mo
- Projected year-2 tax
- $1,071 · $89/mo
- Expected delta
- +$671/yr (+$56/mo · 167.7%)
ⓘ Screening estimate from a state-policy table — verify with the county assessor before closing.
Climate risk First Street
- Flood 1/10 Low FEMA zone X (unshaded) · 0% chance over 30 yrs
- Wildfire 1/10 Low
- Heat 8/10 Severe 7 d/yr ≥108°F today · 20 d/yr by 30 yrs out
- Wind 9/10 Extreme 99% chance of damaging wind over 30 yrs
- Air quality 2/10 Low 1 unhealthy d/yr today · 1 by 30 yrs out
Nearby sold comps map
Loading sold comps map…
Walkable amenities ~0.75 mi
Loading nearby amenities…
Taxation est. · year 1
- Rental income
- $21,079
- − Mortgage interest
- −$7,226
- − Property taxes
- −$400
- − Insurance
- −$645
- − Repairs & maintenance
- −$1,686
- − Management
- −$1,686
- − HOA
- −$624
- − Depreciation
- −$3,753
- Taxable income
- $5,059
- Est. tax owed @ 24.0%
- −$1,214
- After-tax cash flow
- $5,652/yr
For passive investors: Depreciation is non-cash, so a rental often shows a tax loss while cash-flowing — sheltering income. Rental losses are passive: they offset passive income freely, and up to $25,000/yr can offset ordinary (W-2) income if you actively participate and your MAGI is under $100k (phasing out to $0 by $150k); unused losses carry forward. On sale, claimed depreciation is recaptured at up to 25%, and gains may owe capital-gains tax (a 1031 exchange can defer both). Figures are a year-1 estimate at your 24.0% rate — not tax advice; consult a CPA.
Schools (NCES district)
- District
- Lake
- NCES district ID
- 1201050
- Math proficiency
- 49% ▼ -7.00%
- Reading proficiency
- 50% ▼ -4.00%
- Median HH income
- $46,632
- Composite
- 42.05/100
- National rank
- #3327
- State rank
- #37 of 73 in FL
Livability — Tavares
- Score
- 76/100
- State rank
- #220
- US rank
- #3464
Category grades
Schools grade is shown separately in the Schools card above.
Census & demographics
- Census place
- Tavares, FL
- County
- Lake County · 364,602 people
- City population
- 25,042
- Metro
- Orlando-Kissimmee-Sanford, FL
- Population (ZIP)
- 25,042
- Household income
- $63,472
- Rent vs Own
- Severe rent burden
- 586.0
Population outlook (Lake County) Hauer SSP2
- Today (2025)
- 386,640 people
- By 2030
- 417,107 · +7.9%
- By 2040
- 476,676 · +23.3%
- By 2050
- 531,296 · +37.4%
- By 2075
- 648,303 · +67.7%
- By 2100
- 698,530 · +80.7%
Race, ethnicity, and origin ACS 2023
- Neighborhood character
- Predominantly White (72%)
- Race & ethnicity
- White 72% Hispanic / Latino 14% Two or more races 8% Black 8% Asian 2%
- Hispanic origin (detail)
- Mexican 1% Puerto Rican 7% Cuban 2% Dominican 1%
- Common ancestry
- Romanian 4% Italian 3% Slovak 2%
- Foreign-born
- 9% · Canada, Dominican Republic, Jamaica
- Languages at home
- 85% English-only · Spanish 11% Other Indo-European 2% Other Asian/Pacific 1%
Political lean MEDSL · Lake
- 2024 margin
- Strong R (+24.7) · D 37.3% · R 62.0%
- 2008→2024 swing
- -11.2pp toward R · 2008: -13.5pp · 2024: -24.7pp
- All cycles
- 2024: R+24.7 2020: R+20.0 2016: R+23.1 2012: R+17.1 2008: R+13.5
Not yet ingested
- Civics
- —
Market trends
- HPI YoY
- ▼ -88.07%
- Current HPI
- 288.7123
- Rent YoY
- ▲ 4.05%
- Metro
- Orlando-Kissimmee-Sanford, FL
- State GDP YoY
- ▲ 3.28%
- F500 in state
- 36
Industry mix (Fortune 500 HQ in FL)
| Industry | F500 HQs | Revenue |
|---|---|---|
| Industrial Technology | 2 | $29B |
|
||
| Insurance | 2 | $17B |
|
||
| Retail | 1 | $60B |
|
||
| Technology Distribution | 1 | $58B |
|
||
| Homebuilding | 1 | $35B |
|
||
| Technology Manufacturing | 1 | $35B |
|
||
Price history
+193.2% since first listed4 events — show timeline
- 2026-04-13 Price Changed $129,000 Stellar MLS as Distributed by MLS Grid
- 2026-04-08 Price Changed $133,900 Stellar MLS as Distributed by MLS Grid
- 2026-03-14 Listed $134,900 Stellar MLS as Distributed by MLS Grid
- 2000-07-18 Sold (Public Records) $44,000 Public Records
Property tax history
+1.5%/yrLatest (2025): $400 · +1.1% YoY. Source: county tax records.
Cash-flow waterfall
monthlySold comps — $/sqft
last 12 mo · ≤1 miLoading sold comps…