 Multi-family
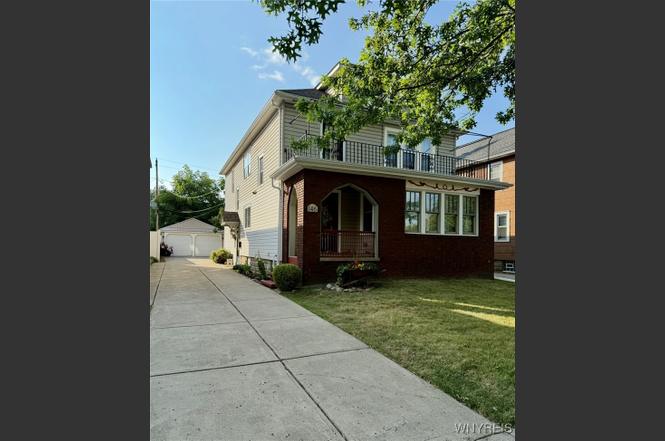
146 Chamberlin Dr · West Seneca, NY
Flood risk 1/10 · Minimal
- FEMA flood zone
- X (unshaded)
- Chance of flooding over 30 yrs
- 0.0%
- Est. flood insurance / yr
- $473 – $860
Fire risk 1/10 · Minimal
- Est. fire insurance / yr
- $691 – $1,283
Heat risk 3/10 · Minor
- Hot days now (above 92°F)
- 7 days/yr
- Hot days in 30 yrs
- 16 days/yr
Wind risk 1/10 · Minimal
- Chance of severe wind over 30 yrs
- —
Air-quality risk 4/10 · Minor
- Unhealthy air days now
- 3 days/yr
- Unhealthy air days in 30 yrs
- 8 days/yr
Risk factors via First Street. Map © Google.
Why this score? — see what drove the F grade
The composite is a weighted blend of 9 inputs, each scored 0–100. Each bar is that input's sub-score; the figure is the points it added to the 100-point composite (weight × sub-score).
- Appreciation +10.0/10.0
- Cash flow +6.2/30.0
- Rent growth +5.0/5.0
- Schools +4.5/10.0
- Livability +4.0/5.0
- Condition / age +2.5/5.0
- 1% rule +1.5/10.0
- DSCR +0.5/10.0
- ARV discount +0.0/15.0
$279,900
🖨 Deal sheet 📄 Offer letter ✓ Due diligence
Multi-family units
County records classify this as Multi-Family (2-4 Unit). Listing-text estimate: 1 unit. estimate disagrees with records
Listing remarks
PRIDE OF OWNERSHIP in this artistic 1930’s double in Town of West Seneca! Each unit is a 2/1 w/ spacious LR/DR and original hardwood floors. Lower offers updated Maple kitchen cabinets, breakfast bar and a pantry. Bathroom has nostalgic basketweave mosaic tile floor, a large vanity and Corian shower surround. Hardwood floors are in excellent condition. LR/DR has tilt in Pella windows (replaced to look like original time period) and a faux fireplace w/ gumwood mantle. Upper offers a Retro style kitchen and original floor to ceiling 1930’s style cabinets and a built in ironing board! Living room w/ original faux fireplace and mantle. Full attic for additional storage! Lovely ba
Key facts
- Large vanity
- Breakfast bar
- 5,200 sq ft lot
Tags
Neighborhood map
What this means for you Summary
Snapshot
- This is a 4-bed/2.0-bath multifamily listed at $280k.
Deal economics
- At list price, monthly cash flow is $-512 ($-6k/yr) — negative.
- To cash-flow at today's rent, offer at most $189k (32.3% below list).
- To meet the 1% rule (rent ≥ 1% of price), the offer needs to be $182k (35.1% below list).
- Recommended offer: $182k (35.1% below list) — sets the bar for 1% rule.
Location & tenants
- Location reads 79/100 on livability (#130 in NY, #2,089 nationally) — a middle-class / working-renter tenant base. Strengths: housing A+, health & safety A+, crime A-; Watch: amenities D, commute F.
- West Seneca Central School District (suburban): math 49% / reading 55% proficiency, ranked #336 of 590 in NY (top 57%) — acceptable for families but not a draw, mixed tenant base, ~2y average lease.
- Market conditions: Rents rising fast (+12.7%/yr); 94 active listings in the ZIP; 1 comparable units currently listed for rent nearby; 1,244 units permitted in Erie County in 2024 (563 in 5+ unit buildings).
- This rent runs 40% of the median local income ($54k/yr) — at the standard rent-burdened threshold; future hikes will face affordability resistance.
Forward outlook
- In year one you build about $30k of equity ($2k loan paydown + $28k appreciation (10.0% local appreciation)).
- By year 2, paydown + projected appreciation supports a ~$48k cash-out refi (75% LTV) — recoverable capital for the next deal without selling this one.
Negotiation context
- It's been on market 20 days — a 2% lower offer ($276k) is reasonable based on typical stale-listing flexibility.
Risks & watch-outs
- Watch-outs: built in 1931 — expect roof / HVAC / electrical / plumbing capex.
Questions for the listing agent
- What do current leases actually rent for vs. the listed asking? Can we see a recent rent roll and the last 12 months of T-12 income?
- Built in 1931 — when were the roof, HVAC, electrical panel, plumbing, and water heater last replaced?
- Is there a deadline driving the sale (1031 exchange, divorce, estate, relocation)? That informs how much negotiation room exists.
- Schools are B-rated — typically a magnet for longer-tenancy family renters. What's the average tenant stay here, and is there a school-zone premium baked into asking?
- The area grade is low — what's the realistic commute time and amenity access for the typical tenant pool here? Any planned neighborhood developments (good or bad) we should know about?
- What's the average days-on-market for RENTAL listings here right now (not sales)? A rising rental-DOM trend means longer vacancies and softer asking-rent achievability than the comps imply.
- What's the recent tenant-quality profile in this submarket — average credit score on applications, eviction rate, late-payment / NSF rate, and stable-employment percentage? A property-management company in the area should have these aggregated.
- How much new apartment / multifamily construction is in the pipeline within 1–3 miles? Heavy new supply (>2% of stock underway) typically softens rents 12–24 months out; light construction supports rent growth.
Investment metrics
- 1% rule
- 0.65% ✗
- Cap rate
- 4.10%
- Cash-on-cash
- -7.84%
- DSCR
- 0.65
- GRM
- 12.8
CMA / ARV
- ARV (on-the-fly)
- $238,383
- Comps found
- 12
Show comp detail 12 sales within ~0.75 mi
| Address | Dist | Beds/Ba | Sqft | Sold | Price | $/sf | Match |
|---|---|---|---|---|---|---|---|
| 146 Chamberlin Dr | 0.00mi | 4/2.0 | 2,187 (0%) | 8mo | $290,000 | $133 | 94 |
| 154 Chamberlin Dr | 0.01mi | 5/2.0 (+1) | 2,182 (-0%) | 2mo | $242,400 | $111 | 92 |
| 46 Kirkwood Dr | 0.23mi | 4/2.0 | 2,128 (-3%) | 5mo | $198,700 | $93 | 81 |
| 30 Chamberlin Dr | 0.22mi | 5/2.0 (+1) | 2,208 (+1%) | 5mo | $239,800 | $109 | 79 |
| 126 Chamberlin Dr | 0.04mi | 4/2.0 | 1,978 (-10%) | 14mo | $190,000 | $96 | 71 |
| 71 Buffum St | 0.48mi | 5/2.0 (+1) | 2,136 (-2%) | 6mo | $160,000 | $75 | 63 |
| 11 Dorr St | 0.28mi | 3/2.0 (-1) | 1,944 (-11%) | 4mo | $179,900 | $93 | 60 |
| 14 Winegar Pl | 0.17mi | 5/2.5 (+1) | 2,469 (+13%) | 5mo | $187,000 | $76 | 60 |
| 81 Buffum St | 0.48mi | 5/2.0 (+1) | 2,112 (-3%) | 15mo | $265,000 | $125 | 55 |
| 109 Harlem Rd | 0.47mi | 4/2.0 | 1,998 (-9%) | 12mo | $237,000 | $119 | 54 |
| 27 Junior Ave | 0.33mi | 4/2.0 | 1,974 (-10%) | 18mo | $168,000 | $85 | 53 |
| 74 Cazenovia St | 0.73mi | 3/2.0 (-1) | 1,938 (-11%) | 17mo | $331,650 | $171 | 28 |
Match score weights: distance 35% · size 25% · config 20% · recency 20%. Top-matched comps best support the ARV.
Projected returns pro-forma
10.0% appreciation · 8.0% rent growth · sell at horizon
- IRR
- 20.1%
- Equity multiple
- 2.65×
- Total profit
- $129,471
- Equity at exit
- $252,156
- IRR
- 19.4%
- Equity multiple
- 6.50×
- Total profit
- $430,777
- Equity at exit
- $543,784
Cash invested: $78,372 (down + closing). Projections, not guarantees.
Landlord ↔ Tenant lean methodology
- Overall (STATE)
- 15 Strongly Tenant-Friendly
- State New York
- 15 Strongly Tenant-Friendly · D+10
- County
- — inherits STATE
- City
- — inherits STATE
ZIP-level market 14210
- Home prices YoY
- 13.8%
- Rents YoY
- 12.7%
- Active inventory
- 94
- Price-to-rent
- 12.8×
Monthly cashflow live
- Estimated rent
- $1,817 medium interval (Pro) →
- Mortgage (P&I)
- −$1,468
- Tax from tax record
- −$363 /mo · $4,358/yr
- Insurance
- −$117
- HOA
- −$0
- Vacancy / Maint / Mgmt
- −$382
- Net cashflow
- $-512
Break-even live
UW: 25.0% down · 7.5% · 30yr · 1.5% tax · 5.0% vac · 8.0% maint · 8.0% mgmt
Financing live
Cash to close
- Down payment
- $69,975
- Closing costs
- $8,397
- Reserves months
- —
- Total cash needed
- —
Loan-product check · same deal, 3 products live
Conventional
25% down · 7.5% · 30yr
- Down + closing
- —
- Monthly P&I
- —
- Monthly cashflow
- —
- DSCR
- —
- Eligible?
- —
Personal DTI + credit; lowest rate.
DSCR
20% down · 8.5% · 30yr
- Down + closing
- —
- Monthly P&I
- —
- Monthly cashflow
- —
- DSCR
- —
- Eligible?
- —
No personal income docs; deal must DSCR.
Hard money
10% down · 12.0% · 12mo
- Down + closing
- —
- Monthly P&I
- —
- Monthly cashflow
- —
- DSCR
- —
- Eligible?
- —
Short-term bridge; refi at stabilization.
Rent comps 1 comps
| Address | Beds | Baths | Sqft | Rent | $/sqft | DOM | Units | Dist |
|---|---|---|---|---|---|---|---|---|
| 181 Willett St Buffalo, NY | 3.0 | 1.0 | 2704 | $1,550 | $0.57 | 2d | 1 | 1.23mi |
Listing history 4 events
-
2025-12-03soldstatus $290,000
-
2025-09-04status Pending
-
2025-08-14$279,900 Active
-
2016-05-06soldstatus $144,500
ⓘ Source: listings_history table (triggers on properties + properties_extension) + one-shot
backfill from property_details.listing_events for pre-trigger history.
Tax reassessment forecast NY · Partial reset (capped growth)
- Current annual tax
- $4,358 · $363/mo
- Projected year-2 tax
- $4,544 · $379/mo
- Expected delta
- +$186/yr (+$16/mo · 4.3%)
ⓘ Screening estimate from a state-policy table — verify with the county assessor before closing.
Climate risk First Street
- Flood 1/10 Low FEMA zone X (unshaded) · 0% chance over 30 yrs
- Wildfire 1/10 Low
- Heat 3/10 Moderate 7 d/yr ≥92°F today · 16 d/yr by 30 yrs out
- Wind 1/10 Low
- Air quality 4/10 Moderate 3 unhealthy d/yr today · 8 by 30 yrs out
Nearby sold comps map
Loading sold comps map…
Walkable amenities ~0.75 mi
Loading nearby amenities…
Taxation est. · year 1
- Rental income
- $21,807
- − Mortgage interest
- −$15,679
- − Property taxes
- −$4,358
- − Insurance
- −$1,400
- − Repairs & maintenance
- −$1,745
- − Management
- −$1,745
- − Depreciation
- −$8,143
- Taxable loss
- −$11,261
- Est. tax savings @ 24.0%
- +$2,703
- After-tax cash flow
- $-3,441/yr
For passive investors: Depreciation is non-cash, so a rental often shows a tax loss while cash-flowing — sheltering income. Rental losses are passive: they offset passive income freely, and up to $25,000/yr can offset ordinary (W-2) income if you actively participate and your MAGI is under $100k (phasing out to $0 by $150k); unused losses carry forward. On sale, claimed depreciation is recaptured at up to 25%, and gains may owe capital-gains tax (a 1031 exchange can defer both). Figures are a year-1 estimate at your 24.0% rate — not tax advice; consult a CPA.
Schools (NCES district)
- District
- West Seneca Central School District
- NCES district ID
- 3630780
- Math proficiency
- 49% ▼ -15.00%
- Reading proficiency
- 55% ▼ -4.00%
- Median HH income
- $54,231
- Composite
- 44.83/100
- National rank
- #2735
- State rank
- #336 of 590 in NY
Livability — West Seneca
- Score
- 79/100
- State rank
- #130
- US rank
- #2089
Category grades
Schools grade is shown separately in the Schools card above.
Census & demographics
- Census place
- West Seneca, NY
- County
- Erie County · 714,559 people
- City population
- 41,101
- Metro
- Buffalo-Cheektowaga, NY
- Population (ZIP)
- 15,563
- Household income
- $54,197
- Rent vs Own
- Severe rent burden
- 959.0
Population outlook (Erie County) Hauer SSP2
- Today (2025)
- 933,037 people
- By 2030
- 935,181 · +0.2%
- By 2040
- 928,531 · -0.5%
- By 2050
- 905,725 · -2.9%
- By 2075
- 834,037 · -10.6%
- By 2100
- 708,033 · -24.1%
Race, ethnicity, and origin ACS 2023
- Neighborhood character
- Predominantly White (79%)
- Race & ethnicity
- White 79% Two or more races 8% Black 8% Hispanic / Latino 7% Asian 1%
- Hispanic origin (detail)
- Puerto Rican 6%
- Common ancestry
- Romanian 21% Lithuanian 2% Serbian 1%
- Foreign-born
- 2% · Canada, China
- Languages at home
- 95% English-only · Spanish 2% Arabic 1% Other Indo-European 1%
Political lean MEDSL · Erie
- 2024 margin
- Lean D (+9.7) · D 54.8% · R 45.2%
- 2008→2024 swing
- -7.9pp toward R · 2008: 17.5pp · 2024: 9.7pp
- All cycles
- 2024: D+9.7 2020: D+14.7 2016: D+4.8 2012: D+15.6 2008: D+17.5
Not yet ingested
- Civics
- —
Market trends
- HPI YoY
- ▲ 52.34%
- Current HPI
- 431.7951
- Rent YoY
- ▲ 12.67%
- Metro
- Buffalo-Cheektowaga, NY
- State GDP YoY
- ▲ 2.60%
- F500 in state
- 92
Industry mix (Fortune 500 HQ in NY)
| Industry | F500 HQs | Revenue |
|---|---|---|
| Financial Services | 10 | $950B |
|
||
| Consumer Goods | 9 | $162B |
|
||
| Insurance | 4 | $225B |
|
||
| Telecommunications | 2 | $144B |
|
||
| Pharmaceuticals | 2 | $112B |
|
||
| Media / Entertainment | 2 | $69B |
|
||
Price history
+100.7% since first listed4 events — show timeline
- 2025-12-03 Sold (Public Records) $290,000 Public Records
- 2025-09-04 Pending — WNYREIS
- 2025-08-14 Listed $279,900 WNYREIS
- 2016-05-06 Sold (Public Records) $144,500 Public Records
Property tax history
+0.6%/yrLatest (2025): $4,358 · +0.9% YoY. Source: county tax records.
Cash-flow waterfall
monthlySold comps — $/sqft
last 12 mo · ≤1 miLoading sold comps…