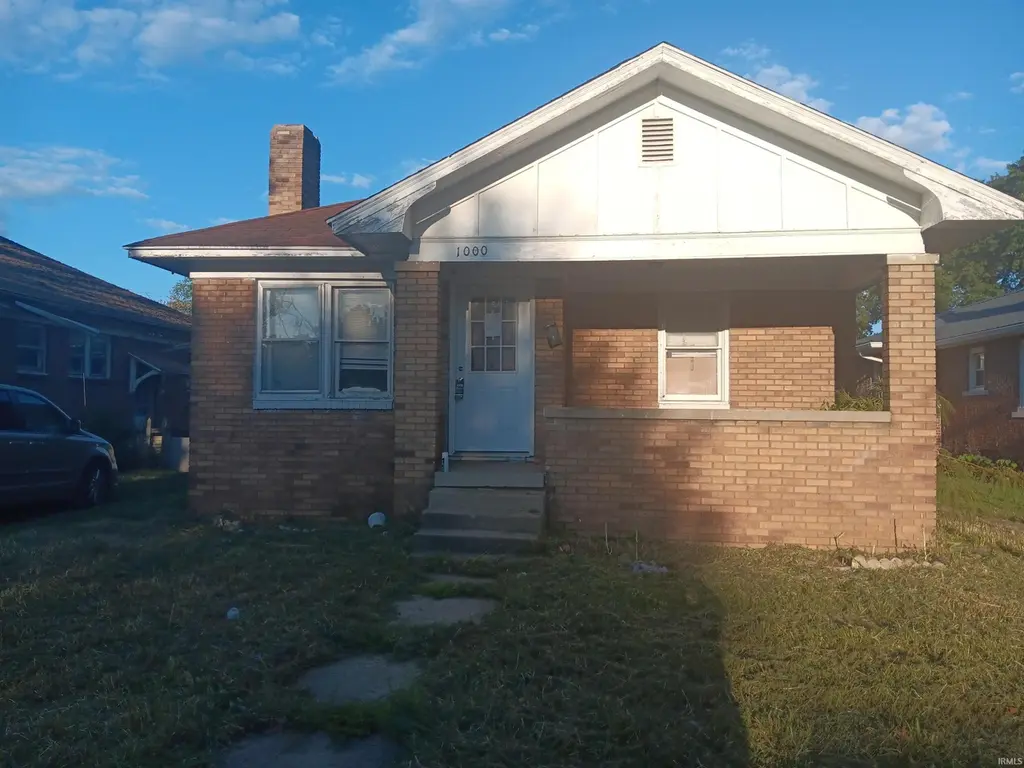
1000 S 19th St · Terre Haute, IN
Flood risk 4/10 · Minor
- FEMA flood zone
- X (unshaded)
- Chance of flooding over 30 yrs
- 0.23%
- Est. flood insurance / yr
- $473 – $860
Fire risk 1/10 · Minimal
- Est. fire insurance / yr
- $717 – $1,331
Heat risk 4/10 · Minor
- Hot days now (above 104°F)
- 7 days/yr
- Hot days in 30 yrs
- 19 days/yr
Wind risk 2/10 · Minimal
- Chance of severe wind over 30 yrs
- 1.0%
Air-quality risk 3/10 · Minor
- Unhealthy air days now
- 3 days/yr
- Unhealthy air days in 30 yrs
- 4 days/yr
Risk factors via First Street. Map © Google.
Why this score? — see what drove the B+ grade
The composite is a weighted blend of 9 inputs, each scored 0–100. Each bar is that input's sub-score; the figure is the points it added to the 100-point composite (weight × sub-score).
- Cash flow +30.0/30.0
- ARV discount +15.0/15.0
- DSCR +10.0/10.0
- 1% rule +8.6/10.0
- Livability +3.8/5.0
- Schools +2.9/10.0
- Rent growth +2.8/5.0
- Condition / age +2.5/5.0
- Appreciation +0.0/10.0
$71,999
🖨 Deal sheet (PDF) 📄 Offer letter ✓ Due diligence
Listing remarks MLS
Brick Home. Covered Front Porch.
Key facts
- Covered front porch
- 5,227 sq ft lot
- Built 1925
Tags
Neighborhood map
What this means for you Summary
Snapshot
- This is a 2-bed/1.0-bath single-family listed at $72k.
Deal economics
- At list price, monthly cash flow is $290 ($3k/yr) — positive.
- The deal already cash-flows at list — no discount required.
- Meets the 1% rule at list price ($978 rent vs $72k).
- Recommended offer: $63k (12.0% below list) — sets the bar for market timing.
- Cap rate 11.1% vs local median 4.6% in Terre Haute — top-decile yield for the area; either an underpriced asset or a hidden risk that comps aren't pricing in. Stress-test before assuming the spread holds.
Location & tenants
- Location reads 75/100 on livability (#63 in IN, #4,186 nationally) — a middle-class / working-renter tenant base. Strengths: cost of living A+, housing A+, health & safety A+; Watch: crime F, employment F.
- Vigo County School Corporation (urban): math 32% / reading 37% proficiency, ranked #202 of 301 in IN (top 67%) — families likely to look elsewhere, expect single-tenant / working-renter base with shorter leases.
- Zoned schools: Adelaide De Vaney Elementary Sch (math 62% / reading 47%, grade C, #197 of 994 statewide, top 22%, 437 students, 58% FRL); Sarah Scott Middle School (math 8% / reading 18%, grade F, #304 of 330 statewide, top 94%, 397 students, 86% FRL); Terre Haute South Vigo High School (math 37% / reading 72%, grade C-, #79 of 369 statewide, top 26%, 1,610 students, 51% FRL) — zoned schools average 65% FRL vs 47% district-wide (18 pts higher); higher-poverty schools than district average — tighter screening recommended.
- Market conditions: Rents rising (+1.2%/yr); 190 active listings in the ZIP; 15 comparable units currently listed for rent nearby; rentals lingering (median 45d on market — plan ~5-8 weeks vacancy on turnover, expect pricing pressure); 100% of comp listings sitting > 30 days — soft ceiling on asking rent; 60 units permitted in Vigo County in 2024 (0 in 5+ unit buildings).
Forward outlook
- Local home prices are declining (-3.0%/yr); year-one equity from $498 of loan paydown is wiped out by about $2k of value loss. Plan a longer hold.
- Vigo County population projected to shrink 5% by 2050 — rents likely to lag national; underwrite the cash flow, not the appreciation.
- At projected returns (-3.0% appreciation + 1.2% rent growth), your $20k cash investment doubles in ~9 years — after that, you're playing with house money.
Negotiation context
- It's been on market 288 days — a 12% lower offer ($63k) is reasonable based on typical stale-listing flexibility.
Risks & watch-outs
- Watch-outs: built in 1925 — expect roof / HVAC / electrical / plumbing capex.
Questions for the listing agent
- It's been on market 288 days. Have you received any prior offers? Is the seller open to a 12% concession, seller financing, or rate buy-down credit?
- Built in 1925 — when were the roof, HVAC, electrical panel, plumbing, and water heater last replaced?
- Why hasn't it sold? Are there any deal-killer items the seller is aware of (foundation, flood, title, zoning, code violations)?
- Is there a deadline driving the sale (1031 exchange, divorce, estate, relocation)? That informs how much negotiation room exists.
- Schools are D-rated, which usually means shorter tenancies and higher turnover. Who's the typical renter profile here, and what's been the actual vacancy rate?
- Crime grade is F in this area — have there been break-ins, vandalism, or insurance claims at this property in the last 3 years? What carrier currently insures it and at what premium?
- What's the average days-on-market for RENTAL listings here right now (not sales)? A rising rental-DOM trend means longer vacancies and softer asking-rent achievability than the comps imply.
- What's the recent tenant-quality profile in this submarket — average credit score on applications, eviction rate, late-payment / NSF rate, and stable-employment percentage? A property-management company in the area should have these aggregated.
- How much new for-sale + rental construction is in the pipeline within 1–3 miles? Heavy new supply typically softens prices + rents 12–24 months out; constrained supply supports both.
Investment metrics
- 1% rule
- 1.36% ✓
- Cap rate
- 11.12%
- Cash-on-cash
- 17.25%
- DSCR
- 1.77
- GRM
- 6.1
CMA / ARV
- ARV (median comp)
- $92,361
- List price
- $71,999
- Delta
- -22.05%
- Verdict
- UNDERPRICED
- Comps
- 20 within 1.0 mi
Show comp detail 12 sales within ~0.75 mi
| Address | Dist | Beds/Ba | Sqft | Sold | Price | $/sf | Match |
|---|---|---|---|---|---|---|---|
| 2107 College | 0.14mi | 2/2.0 | 1,040 (-2%) | 0mo | $165,000 | $159 | 86 |
| 552 Monterey Ave | 0.39mi | 2/1.0 | 1,080 (+2%) | 3mo | $147,000 | $136 | 76 |
| 941 S 25th St | 0.47mi | 2/1.0 | 1,102 (+4%) | 2mo | $115,000 | $104 | 69 |
| 2341 S Seabury Ave | 0.61mi | 2/1.5 | 1,040 (-2%) | 2mo | $149,500 | $144 | 65 |
| 1901 Hulman St | 0.57mi | 2/1.0 | 980 (-8%) | 1mo | $70,000 | $71 | 60 |
| 1908 S 23rd St | 0.74mi | 2/2.0 | 1,072 (+1%) | 0mo | $176,852 | $165 | 59 |
| 557 Monterey Ave | 0.37mi | 2/1.0 | 906 (-14%) | 2mo | $110,000 | $121 | 58 |
| 415 S 24th St | 0.57mi | 2/1.0 | 930 (-12%) | 1mo | $85,000 | $91 | 53 |
| 136 Monterey Ave | 0.72mi | 2/1.0 | 979 (-8%) | 3mo | $159,000 | $162 | 52 |
| 1006 S 25th St | 0.51mi | 2/2.0 | 1,207 (+14%) | 3mo | $169,900 | $141 | 46 |
| 1419 S 12th St | 0.69mi | 3/2.0 (+1) | 1,146 (+8%) | 4mo | $177,000 | $154 | 42 |
| 1407 Ohio St | 0.71mi | 3/1.5 (+1) | 1,178 (+11%) | 5mo | $29,500 | $25 | 37 |
Match score weights: distance 35% · size 25% · config 20% · recency 20%. Top-matched comps best support the ARV.
Projected returns pro-forma
-3.0% appreciation · 1.23% rent growth · sell at horizon
- IRR
- 6.6%
- Equity multiple
- 1.25×
- Total profit
- $5,081
- Equity at exit
- $10,735
- IRR
- 14.4%
- Equity multiple
- 2.06×
- Total profit
- $21,433
- Equity at exit
- $6,225
Cash invested: $20,160 (down + closing). Projections, not guarantees.
Landlord ↔ Tenant lean methodology
- Overall (STATE)
- 90 Strongly Landlord-Friendly
- State Indiana
- 90 Strongly Landlord-Friendly · R+11
- County
- — inherits STATE
- City
- — inherits STATE
ZIP-level market 47802
- Home prices YoY
- -26.8%
- Rents YoY
- 1.2%
- Active inventory
- 190
- Price-to-rent
- 6.1×
Monthly cashflow live
- Estimated rent
- $978 high interval (Pro) →
- Mortgage (P&I)
- −$378
- Tax from tax record
- −$75 /mo · $904/yr
- Insurance
- −$30
- HOA
- −$0
- Vacancy / Maint / Mgmt
- −$205
- Net cashflow
- $290
Break-even live
Sensitivity live
| Price | -10% $331 | -5% $310 | +0% $290 | +5% $269 | +10% $249 |
|---|---|---|---|---|---|
| Rent | -10% $212 | -5% $251 | +0% $290 | +5% $328 | +10% $367 |
| Rate | -1.0pp $326 | -0.5pp $308 | base $290 | +0.5pp $271 | +1.0pp $252 |
UW: 25.0% down · 7.5% · 30yr · 1.5% tax · 5.0% vac · 8.0% maint · 8.0% mgmt
Financing live
Cash to close
- Down payment
- $18,000
- Closing costs
- $2,160
- Reserves months
- —
- Total cash needed
- —
Loan-product check · same deal, 3 products live
Conventional
25% down · 7.5% · 30yr
- Down + closing
- —
- Monthly P&I
- —
- Monthly cashflow
- —
- DSCR
- —
- Eligible?
- —
Personal DTI + credit; lowest rate.
DSCR
20% down · 8.5% · 30yr
- Down + closing
- —
- Monthly P&I
- —
- Monthly cashflow
- —
- DSCR
- —
- Eligible?
- —
No personal income docs; deal must DSCR.
Hard money
10% down · 12.0% · 12mo
- Down + closing
- —
- Monthly P&I
- —
- Monthly cashflow
- —
- DSCR
- —
- Eligible?
- —
Short-term bridge; refi at stabilization.
Rent comps 15 comps
| Address | Beds | Baths | Sqft | Rent | $/sqft | DOM | Units | Dist |
|---|---|---|---|---|---|---|---|---|
| 1320 S 19th St Terre Haute, IN | 2.0 | 1.0 | 830 | $700 | $0.84 | 45d | 1 | 0.20mi |
| 501 S 19th St Terre Haute, IN | 2.0 | 1.0 | 1200 | $975 | $0.81 | 45d | 1 | 0.34mi |
| 435 S 18th St Terre Haute, IN | 3.0 | 1.0 | 1108 | $1,050 | $0.95 | 45d | 1 | 0.41mi |
| 1915 Poplar St Unit A Terre Haute, IN | 3.0 | 1.0 | 1412 | $1,200 | $0.85 | 45d | 1 | 0.46mi |
| 433 S 25th St Terre Haute, IN | 2.0 | 1.0 | 760 | $995 | $1.31 | 45d | 1 | 0.63mi |
| 1701 Ohio St Unit C Terre Haute, IN | 2.0 | 1.0 | 880 | $950 | $1.08 | 45d | 1 | 0.65mi |
| 1609 Ohio St Unit 1 Terre Haute, IN, USA Terre Haute, IN | 1.0 | 1.0 | 700 | $785 | $1.12 | 45d | 1 | 0.66mi |
| 1201 S 7th St Unit 3 Terre Haute, IN | 3.0 | 1.0 | 880 | $925 | $1.05 | 45d | 1 | 1.04mi |
| 731 S 7th St Terre Haute, IN | 1.0 | 1.0 | 700 | $1,200 | $1.71 | 45d | 1 | 1.05mi |
| 600 S Center St Unit 602 Terre Haute, IN | 3.0 | 1.5 | 1500 | $2,500 | $1.67 | 45d | 1 | 1.12mi |
| 1611 S 7th St Apt 4 Terre Haute, IN | 2.0 | 1.0 | 1022 | $795 | $0.78 | 45d | 1 | 1.14mi |
| 500 College Ave Terre Haute, IN | 2.0 | 1.0 | 809 | $792 | $0.98 | 45d | 14 | 1.26mi |
| 2440 S 11th St Terre Haute, IN | 2.0 | 1.0 | 800 | $1,000 | $1.25 | 45d | 1 | 1.33mi |
| 1011 S 4th St Terre Haute, IN | 2.0 | 1.0 | 1268 | $750 | $0.59 | 45d | 1 | 1.33mi |
| 66 Pear Tree Ln Terre Haute, IN | 2.0 | 1.0 | 868 | $875 | $1.01 | 45d | 1 | 1.47mi |
Listing history 20 events
-
2026-06-21days on market $71,999 Active 288 DOM
-
2026-06-19days on market $71,999 Active 286 DOM
-
2026-06-18days on market $71,999 Active 285 DOM
-
2026-06-17days on market $71,999 Active 284 DOM
-
2026-06-16days on market $71,999 Active 283 DOM
-
2026-06-15days on market $71,999 Active 282 DOM
-
2026-06-14days on market $71,999 Active 280 DOM
-
2026-06-13days on market $71,999 Active 279 DOM
-
2026-06-10days on market $71,999 Active 277 DOM
-
2026-06-09days on market $71,999 Active 276 DOM
-
2026-06-08days on market $71,999 Active 275 DOM
-
2026-06-07days on market $71,999 Active 274 DOM
-
2026-06-05days on market $71,999 Active 271 DOM
-
2026-06-02days on market $71,999 Active 269 DOM
-
2026-06-01days on market $71,999 Active 268 DOM
-
2026-05-31days on market $71,999 Active 267 DOM
-
2026-05-30days on market $71,999 Active 266 DOM
-
2026-01-20price $71,999 32-char remark
Show marketing remark (32 chars)
Brick Home. Covered Front Porch.
-
2025-12-28price $68,875 32-char remark
Show marketing remark (32 chars)
Brick Home. Covered Front Porch.
-
2025-09-07$72,500 Active 32-char remark
Show marketing remark (32 chars)
Brick Home. Covered Front Porch.
ⓘ Source: listings_history table (triggers on properties + properties_extension) + one-shot
backfill from property_details.listing_events for pre-trigger history.
Tax reassessment forecast IN · Partial reset (capped growth)
- Current annual tax
- $904 · $75/mo
- Projected year-2 tax
- $904 · $75/mo
- Expected delta
- $0/yr ($0/mo · 0.0%)
ⓘ Screening estimate from a state-policy table — verify with the county assessor before closing.
Climate risk First Street
- Flood 4/10 Moderate FEMA zone X (unshaded) · 23% chance over 30 yrs
- Wildfire 1/10 Low
- Heat 4/10 Moderate 7 d/yr ≥104°F today · 19 d/yr by 30 yrs out
- Wind 2/10 Low 100% chance of damaging wind over 30 yrs
- Air quality 3/10 Moderate 3 unhealthy d/yr today · 4 by 30 yrs out
Nearby sold comps map
Loading sold comps map…
Walkable amenities ~0.75 mi
Loading nearby amenities…
Taxation est. · year 1
- Rental income
- $11,736
- − Mortgage interest
- −$4,033
- − Property taxes
- −$904
- − Insurance
- −$360
- − Repairs & maintenance
- −$939
- − Management
- −$939
- − Depreciation
- −$2,095
- Taxable income
- $2,467
- Est. tax owed @ 24.0%
- −$592
- After-tax cash flow
- $2,885/yr
For passive investors: Depreciation is non-cash, so a rental often shows a tax loss while cash-flowing — sheltering income. Rental losses are passive: they offset passive income freely, and up to $25,000/yr can offset ordinary (W-2) income if you actively participate and your MAGI is under $100k (phasing out to $0 by $150k); unused losses carry forward. On sale, claimed depreciation is recaptured at up to 25%, and gains may owe capital-gains tax (a 1031 exchange can defer both). Figures are a year-1 estimate at your 24.0% rate — not tax advice; consult a CPA.
Schools (NCES district)
- District
- Vigo County School Corporation
- NCES district ID
- 1812090
- Math proficiency
- 32% ▼ -10.00%
- Reading proficiency
- 37% ▼ -8.00%
- Median HH income
- $40,100
- Composite
- 28.97/100
- National rank
- #6625
- State rank
- #202 of 301 in IN
Livability — Terre Haute
- Score
- 75/100
- State rank
- #63
- US rank
- #4186
Category grades
Schools grade is shown separately in the Schools card above.
Census & demographics
- Census place
- Terre Haute, IN
- County
- Vigo County · 91,193 people
- City population
- 91,193
- Metro
- Terre Haute, IN
- Population (ZIP)
- 33,135
- Household income
- $57,395
- Rent vs Own
- Severe rent burden
- 1102.0
Population outlook (Vigo County) Hauer SSP2
- Today (2025)
- 106,366 people
- By 2030
- 105,674 · -0.7%
- By 2040
- 103,731 · -2.5%
- By 2050
- 101,200 · -4.9%
- By 2075
- 95,674 · -10.1%
- By 2100
- 85,910 · -19.2%
Race, ethnicity, and origin ACS 2023
- Neighborhood character
- Predominantly White (82%)
- Race & ethnicity
- White 82% Black 8% Two or more races 5% Hispanic / Latino 3% Asian 3%
- Common ancestry
- Lithuanian 3% Slovak 2% Serbian 2%
- Foreign-born
- 3% · China, Canada
- Languages at home
- 96% English-only · Spanish 1% Other Indo-European 1% Chinese 1%
Political lean MEDSL · Vigo
- 2024 margin
- R (+18.1) · D 40.0% · R 58.1% · Other 2.0%
- 2008→2024 swing
- -33.9pp toward R · 2008: 15.8pp · 2024: -18.1pp
- All cycles
- 2024: R+18.1 2020: R+14.7 2016: R+15.2 2012: D+0.8 2008: D+15.8
Not yet ingested
- Civics
- —
Market trends
- HPI YoY
- ▼ -67.05%
- Current HPI
- 183.0194
- Rent YoY
- ▲ 1.23%
- Metro
- Terre Haute, IN
- State GDP YoY
- ▲ 2.90%
- F500 in state
- 18
Industry mix (Fortune 500 HQ in IN)
| Industry | F500 HQs | Revenue |
|---|---|---|
| Industrial Machinery | 2 | $37B |
|
||
| Healthcare | 1 | $177B |
|
||
| Pharmaceuticals | 1 | $45B |
|
||
| Metals / Steel | 1 | $18B |
|
||
| Agriculture | 1 | $17B |
|
||
| Packaging | 1 | $12B |
|
||
Price history
-0.7% since first listed3 events — show timeline
- 2026-01-20 Price Changed $71,999 IRMLS
- 2025-12-28 Price Changed $68,875 IRMLS
- 2025-09-07 Listed $72,500 IRMLS
Property tax history
-5.7%/yrLatest (2024): $904 · +0.2% YoY. Source: county tax records.
Cash-flow waterfall
monthlySold comps — $/sqft
last 12 mo · ≤1 miLoading sold comps…