5711 Rollins Rd · Zachary, LA
Flood risk No data
- FEMA flood zone
- —
- Chance of flooding over 30 yrs
- —
- Est. flood insurance / yr
- —
Fire risk No data
- Est. fire insurance / yr
- —
Heat risk No data
- Hot days now (above threshold)
- —
- Hot days in 30 yrs
- —
Wind risk No data
- Chance of severe wind over 30 yrs
- —
Air-quality risk No data
- Unhealthy air days now
- —
- Unhealthy air days in 30 yrs
- —
Risk factors via First Street. Map © Google.
Why this score? — see what drove the B grade
The composite is a weighted blend of 9 inputs, each scored 0–100. Each bar is that input's sub-score; the figure is the points it added to the 100-point composite (weight × sub-score).
- Cash flow +28.6/30.0
- ARV discount +15.0/15.0
- DSCR +10.0/10.0
- 1% rule +6.8/10.0
- Schools +4.7/10.0
- Rent growth +3.5/5.0
- Livability +3.5/5.0
- Condition / age +2.5/5.0
- Appreciation +0.0/10.0
$214,900
🖨 Deal sheet 📄 Offer letter ✓ Due diligence
Listing remarks
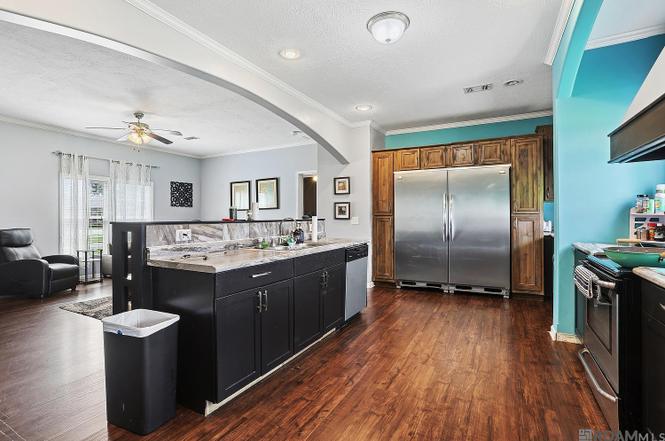
Seller open to accepting Bond for Deed financing. Spacious 4-bedroom, 2-bath, 9-year old modular home with a split floor plan and open main living area. Located within waking distance to an 11-acre park, with no flood insurance required. Roof less than 10 years old. The custom kitchen features stainless appliances, an island, coffee bar, full refrigerator and freezer, and archway details. The primary suite includes a separate shower, soaking tub, and large closet. All bedrooms are generously sized, and the large laundry room includes a washer and dryer that remain. Outdoor features include a back deck and a 12 x 24 shed with a loft and full wiring. Partially furnished. HVAC upgraded in 2019
Key facts
- Custom kitchen
- Archway details
- Split floor plan
Tags
Property features AI
Exterior
- Parking: Off-street parking
- Utilities: Public water; Public sewer
- Home design: Detached single family residence; Residential property
- Construction: Cement siding; Pillar/post/pier foundation; Built (year not specified)
- Exterior features: Deck; Porch; Partial chain link fencing; Shingle roof
Interior
- Kitchen: Range; Oven; Dishwasher; Freezer; Microwave; Refrigerator; Range hood
- Flooring: Tile; Carpet; Vinyl
- Bathrooms: 2 full bathrooms
- Heating & cooling: Central heating; Central air; Ceiling fans
- Interior features: Tray ceilings; Crown molding; High ceilings; Window treatments
Neighborhood map
What this means for you Summary
Snapshot
- This is a 4-bed/2.0-bath single-family listed at $215k.
Deal economics
- At list price, monthly cash flow is $706 ($8k/yr) — positive.
- The deal already cash-flows at list — no discount required.
- Meets the 1% rule at list price ($3k rent vs $215k).
- Cap rate 10.2% vs local median 4.5% in Zachary — top-decile yield for the area; either an underpriced asset or a hidden risk that comps aren't pricing in. Stress-test before assuming the spread holds.
Location & tenants
- Location reads 69/100 on livability (#64 in LA) — a middle-class / working-renter tenant base. Strengths: schools A+, employment A+, housing A+; Watch: crime C-, amenities F, commute F.
- Zachary Community School District (suburban): math 46% / reading 60% proficiency, ranked #8 of 98 in LA (top 8%) — acceptable for families but not a draw, mixed tenant base, ~2y average lease.
- Market conditions: Rents rising fast (+4.2%/yr); 584 active listings in the ZIP; 6 comparable units currently listed for rent nearby; rentals at typical pace (median 19d on market — plan ~3-4 weeks tenant-placement turnaround); solid renter incomes; 2,252 units permitted in East Baton Rouge Parish in 2024 (440 in 5+ unit buildings).
- This rent runs 39% of the median local income ($78k/yr) — at the standard rent-burdened threshold; future hikes will face affordability resistance.
Forward outlook
- Local home prices are declining (-3.0%/yr); year-one equity from $1k of loan paydown is wiped out by about $6k of value loss. Plan a longer hold.
- East Baton Rouge County population projected at +4% by 2050 — modest demand growth; plan on rents tracking national, not racing it.
- At projected returns (-3.0% appreciation + 4.2% rent growth), your $60k cash investment doubles in ~8 years — after that, you're playing with house money.
Negotiation context
- Only 1 days on market — expect competitive offers; lowballing is unlikely to land.
Questions for the listing agent
- Is there a deadline driving the sale (1031 exchange, divorce, estate, relocation)? That informs how much negotiation room exists.
- Schools are A-rated — typically a magnet for longer-tenancy family renters. What's the average tenant stay here, and is there a school-zone premium baked into asking?
- What's the average days-on-market for RENTAL listings here right now (not sales)? A rising rental-DOM trend means longer vacancies and softer asking-rent achievability than the comps imply.
- What's the recent tenant-quality profile in this submarket — average credit score on applications, eviction rate, late-payment / NSF rate, and stable-employment percentage? A property-management company in the area should have these aggregated.
- How much new for-sale + rental construction is in the pipeline within 1–3 miles? Heavy new supply typically softens prices + rents 12–24 months out; constrained supply supports both.
Investment metrics
- 1% rule
- 1.18% ✓
- Cap rate
- 10.23%
- Cash-on-cash
- 14.07%
- DSCR
- 1.63
- GRM
- 7.1
CMA / ARV
- ARV (on-the-fly)
- $273,600
- Comps found
- 12
Show comp detail 12 sales within ~0.75 mi
| Address | Dist | Beds/Ba | Sqft | Sold | Price | $/sf | Match |
|---|---|---|---|---|---|---|---|
| 3533 Chien St | 0.47mi | 4/2.0 | 1,819 (+1%) | 11mo | $289,900 | $159 | 67 |
| 3508 Ash St | 0.69mi | 4/2.0 | 1,867 (+4%) | 3mo | $259,999 | $139 | 59 |
| 4761 Lee St | 0.57mi | 4/2.0 | 1,885 (+5%) | 9mo | $249,000 | $132 | 58 |
| 4608 40th St | 0.65mi | 3/2.0 (-1) | 1,814 (+1%) | 6mo | $299,000 | $165 | 58 |
| 5228 Rollins Rd | 0.24mi | 3/2.0 (-1) | 1,561 (-13%) | 8mo | $199,000 | $127 | 55 |
| 4366 Mills St | 0.44mi | 4/1.0 | 1,655 (-8%) | 13mo | $80,000 | $48 | 51 |
| 5023 Kennedy Dr | 0.59mi | 3/2.0 (-1) | 1,880 (+4%) | 12mo | $225,000 | $120 | 50 |
| 3679 E Meadow Ct | 0.58mi | 3/2.0 (-1) | 1,962 (+9%) | 5mo | $280,000 | $143 | 49 |
| 5104 Creek Valley Dr | 0.43mi | 4/2.0 | 2,060 (+14%) | 12mo | $334,900 | $163 | 45 |
| 5208 Prairieview Dr | 0.46mi | 4/2.5 | 1,962 (+9%) | 23mo | $297,500 | $152 | 42 |
| 3534 Barnview Dr | 0.70mi | 5/3.0 (+1) | 2,016 (+12%) | 20mo | $310,885 | $154 | 22 |
| 6534 Barnview Dr | 0.70mi | 5/3.0 (+1) | 2,016 (+12%) | 20mo | $310,885 | $154 | 22 |
Match score weights: distance 35% · size 25% · config 20% · recency 20%. Top-matched comps best support the ARV.
Projected returns pro-forma
-3.0% appreciation · 4.18% rent growth · sell at horizon
- IRR
- 5.5%
- Equity multiple
- 1.22×
- Total profit
- $13,077
- Equity at exit
- $32,042
- IRR
- 15.9%
- Equity multiple
- 2.36×
- Total profit
- $81,705
- Equity at exit
- $18,581
Cash invested: $60,172 (down + closing). Projections, not guarantees.
Landlord ↔ Tenant lean methodology
- Overall (STATE)
- 90 Strongly Landlord-Friendly
- State Louisiana
- 90 Strongly Landlord-Friendly · R+12
- County
- — inherits STATE
- City
- — inherits STATE
ZIP-level market 70791
- Home prices YoY
- -21.6%
- Rents YoY
- 4.2%
- Active inventory
- 584
- Price-to-rent
- 7.1×
Monthly cashflow live
- Estimated rent
- $2,530 high interval (Pro) →
- Mortgage (P&I)
- −$1,127
- Tax from tax record
- −$77 /mo · $919/yr
- Insurance
- −$90
- HOA
- −$0
- Vacancy / Maint / Mgmt
- −$531
- Net cashflow
- $706
Break-even live
UW: 25.0% down · 7.5% · 30yr · 1.5% tax · 5.0% vac · 8.0% maint · 8.0% mgmt
Financing live
Cash to close
- Down payment
- $53,725
- Closing costs
- $6,447
- Reserves months
- —
- Total cash needed
- —
Loan-product check · same deal, 3 products live
Conventional
25% down · 7.5% · 30yr
- Down + closing
- —
- Monthly P&I
- —
- Monthly cashflow
- —
- DSCR
- —
- Eligible?
- —
Personal DTI + credit; lowest rate.
DSCR
20% down · 8.5% · 30yr
- Down + closing
- —
- Monthly P&I
- —
- Monthly cashflow
- —
- DSCR
- —
- Eligible?
- —
No personal income docs; deal must DSCR.
Hard money
10% down · 12.0% · 12mo
- Down + closing
- —
- Monthly P&I
- —
- Monthly cashflow
- —
- DSCR
- —
- Eligible?
- —
Short-term bridge; refi at stabilization.
Rent comps 6 comps
| Address | Beds | Baths | Sqft | Rent | $/sqft | DOM | Units | Dist |
|---|---|---|---|---|---|---|---|---|
| 5633 Emmie Dr Zachary, LA | 3.0 | 3.0 | 1441 | $2,150 | $1.49 | 19d | 1 | 0.98mi |
| 3466 Nelson St Zachary, LA | 3.0 | 2.0 | 1645 | $1,950 | $1.19 | 23d | 1 | 1.01mi |
| 2913 Country Lake Dr Zachary, LA | 4.0 | 2.5 | 2437 | $3,695 | $1.52 | 14d | 1 | 1.31mi |
| 2913 Country Lake Dr Zachary, LA | 4.0 | 2.5 | 2405 | $3,795 | $1.58 | 43d | 1 | 1.31mi |
| 5388 Greenridge Ln Zachary, LA | 4.0 | 2.0 | 2005 | $2,150 | $1.07 | 14d | 1 | 1.44mi |
| 5400 Greenridge Ln Zachary, LA | 4.0 | 2.0 | 2005 | $2,349 | $1.17 | 14d | 1 | 1.46mi |
Listing history 2 events
-
2026-06-19remarks 699-char remark
-
2026-06-19$214,900 Active 1 DOM
ⓘ Source: listings_history table (triggers on properties + properties_extension) + one-shot
backfill from property_details.listing_events for pre-trigger history.
Tax reassessment forecast LA · Resets to sale price
- Current annual tax
- $919 · $77/mo
- Projected year-2 tax
- $1,182 · $98/mo
- Expected delta
- +$263/yr (+$22/mo · 28.6%)
ⓘ Screening estimate from a state-policy table — verify with the county assessor before closing.
Nearby sold comps map
Loading sold comps map…
Walkable amenities ~0.75 mi
Loading nearby amenities…
Taxation est. · year 1
- Rental income
- $30,360
- − Mortgage interest
- −$12,038
- − Property taxes
- −$919
- − Insurance
- −$1,074
- − Repairs & maintenance
- −$2,429
- − Management
- −$2,429
- − Depreciation
- −$6,252
- Taxable income
- $5,219
- Est. tax owed @ 24.0%
- −$1,253
- After-tax cash flow
- $7,215/yr
For passive investors: Depreciation is non-cash, so a rental often shows a tax loss while cash-flowing — sheltering income. Rental losses are passive: they offset passive income freely, and up to $25,000/yr can offset ordinary (W-2) income if you actively participate and your MAGI is under $100k (phasing out to $0 by $150k); unused losses carry forward. On sale, claimed depreciation is recaptured at up to 25%, and gains may owe capital-gains tax (a 1031 exchange can defer both). Figures are a year-1 estimate at your 24.0% rate — not tax advice; consult a CPA.
Schools (NCES district)
- District
- Zachary Community School District
- NCES district ID
- 2200039
- Math proficiency
- 46% ▼ -38.00%
- Reading proficiency
- 60% ▼ -28.00%
- Median HH income
- $68,531
- Composite
- 46.99/100
- National rank
- #2349
- State rank
- #8 of 98 in LA
Livability — Zachary
- Score
- 69/100
- State rank
- #64
- US rank
- #8274
Category grades
Schools grade is shown separately in the Schools card above.
Census & demographics
- Census place
- Zachary, LA
- County
- East Baton Rouge Parish · 399,686 people
- City population
- 30,385
- Metro
- Baton Rouge, LA
- Population (ZIP)
- 30,385
- Household income
- $78,263
- Rent vs Own
- Severe rent burden
- 718.0
Population outlook (East Baton Rouge County) Hauer SSP2
- Today (2025)
- 464,810 people
- By 2030
- 472,137 · +1.6%
- By 2040
- 480,243 · +3.3%
- By 2050
- 484,422 · +4.2%
- By 2075
- 492,069 · +5.9%
- By 2100
- 476,347 · +2.5%
Race, ethnicity, and origin ACS 2023
- Neighborhood character
- Diverse neighborhood (Simpson 0.55)
- Race & ethnicity
- White 53% Black 41% Two or more races 4% Hispanic / Latino 2% Asian 2%
- Common ancestry
- Lithuanian 6% Italian 2% Slovak 1%
- Foreign-born
- 2% · Canada
- Languages at home
- 96% English-only · Spanish 1% German/W. Germanic 1% French/Haitian/Cajun 1%
Political lean MEDSL · East Baton Rouge
- 2024 margin
- D (+11.1) · D 54.5% · R 43.4% · Other 2.1%
- 2008→2024 swing
- +8.9pp toward D · 2008: 2.2pp · 2024: 11.1pp
- All cycles
- 2024: D+11.1 2020: D+13.1 2016: D+9.2 2012: D+5.2 2008: D+2.2
Not yet ingested
- Civics
- —
Market trends
- HPI YoY
- ▼ -47.01%
- Current HPI
- 170.2143
- Rent YoY
- ▲ 4.18%
- Metro
- Baton Rouge, LA
- State GDP YoY
- ▲ 3.29%
- F500 in state
- 10
Industry mix (Fortune 500 HQ in LA)
| Industry | F500 HQs | Revenue |
|---|---|---|
| Telecommunications | 2 | $23B |
|
||
| Utilities | 1 | $12B |
|
||
| Wholesale / Distribution | 1 | $5B |
|
||
| Advertising | 1 | $2B |
|
||
Price history
1 event — show timeline
- 2026-06-18 Listed $214,900 GBRMLS
Property tax history
-0.5%/yrLatest (2025): $919 · -2.8% YoY. Source: county tax records.
Cash-flow waterfall
monthlySold comps — $/sqft
last 12 mo · ≤1 miLoading sold comps…