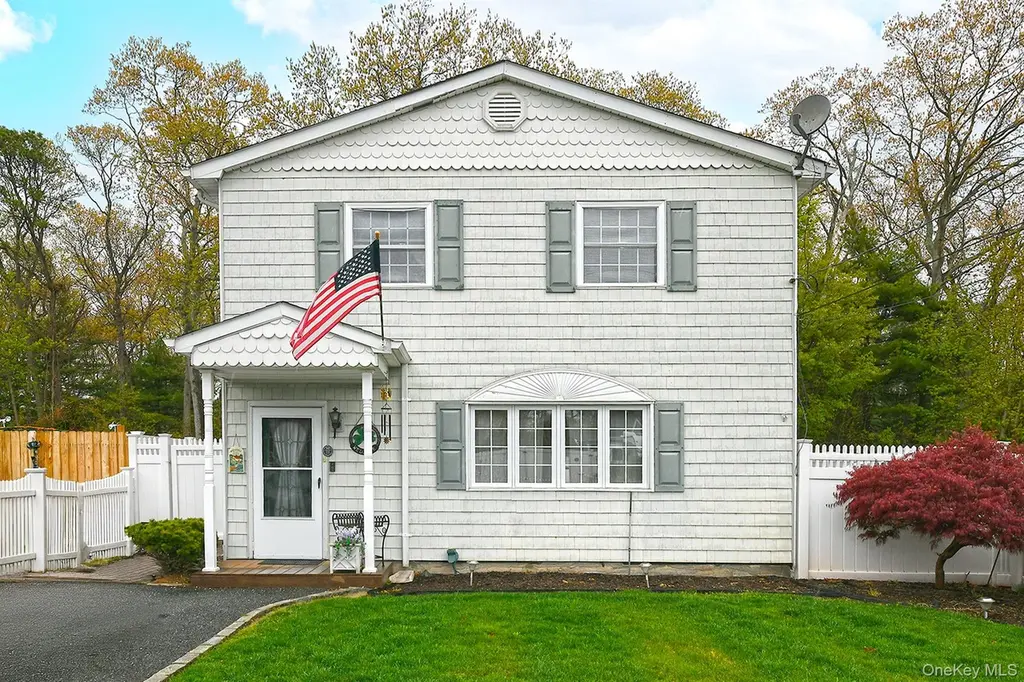
171 Pauline St · Holbrook, NY
Flood risk 1/10 · Minimal
- FEMA flood zone
- X (unshaded)
- Chance of flooding over 30 yrs
- 0.0%
- Est. flood insurance / yr
- $473 – $860
Fire risk 1/10 · Minimal
- Est. fire insurance / yr
- $691 – $1,283
Heat risk 4/10 · Minor
- Hot days now (above 94°F)
- 7 days/yr
- Hot days in 30 yrs
- 16 days/yr
Wind risk 6/10 · Moderate
- Chance of severe wind over 30 yrs
- 77.0%
Air-quality risk 4/10 · Minor
- Unhealthy air days now
- 4 days/yr
- Unhealthy air days in 30 yrs
- 6 days/yr
Risk factors via First Street. Map © Google.
Why this score? — see what drove the D grade
The composite is a weighted blend of 9 inputs, each scored 0–100. Each bar is that input's sub-score; the figure is the points it added to the 100-point composite (weight × sub-score).
- ARV discount +14.1/15.0
- Cash flow +6.9/30.0
- Schools +6.6/10.0
- Rent growth +4.3/5.0
- Livability +3.3/5.0
- Condition / age +2.5/5.0
- 1% rule +1.9/10.0
- DSCR +1.1/10.0
- Appreciation +0.0/10.0
$549,000
🖨 Deal sheet (PDF) 📄 Offer letter ✓ Due diligence
Listing remarks MLS
Great Opportunity in Holbrook! Charming, Bright & Well Maintained 3 Bedroom & 1.5 Bath Colonial on a Peaceful, Dead-End Street and Nicely Manicured Property. XL Kitchen w/ SS Appliances, Comfortable Living Room w/ Cozy & Efficient Pellet Stove. Large Dining Room w/ Exit to Backyard. Beautiful LVP Flooring Throughout the First Level. Full & Half Baths Attractively Updated. Well Sized Bedrooms w/ WIC Closets. (3) Ductless Units Include AC, Heat & Dehumidifier Options, Updated Windows. Pull-Down Stairs Attic, Maintenance-Free Vinyl Fencing All Around, 4 Zone IGS, Backyard Paver Patio. Don't Let This One Pass You By!
Key facts
- 3,920 sq ft lot
- Built 1974
- Listed 48 days
Neighborhood map
What this means for you Summary
Snapshot
- This is a 3-bed/1.5-bath single-family listed at $549k.
Deal economics
- At list price, monthly cash flow is $-840 ($-10k/yr) — negative.
- To cash-flow at today's rent, offer at most $401k (27.0% below list).
- To meet the 1% rule (rent ≥ 1% of price), the offer needs to be $379k (31.0% below list).
- Recommended offer: $379k (31.0% below list) — sets the bar for 1% rule.
- Cap rate 4.5% vs local median 3.5% in Holbrook — meaningfully above typical; check what's discounted (condition, days-on-market, listing class) to confirm the premium yield is real.
Location & tenants
- Location reads 66/100 on livability (#658 in NY) — a middle-class / working-renter tenant base. Strengths: employment A+, housing A+; Watch: amenities F, commute F, cost of living F.
- Sachem Central School District (suburban): math 69% / reading 76% proficiency, ranked #86 of 590 in NY (top 15%) — strong family-tenant draw, lease renewals of 3-5y typical; only 15% free/reduced lunch — higher-income household profile.
- Zoned schools: Hiawatha School (math 57% / reading 57%, grade C+, #842 of 2,108 statewide, top 43%, 603 students, 36% FRL); Seneca Middle School (math 62% / reading 62%, grade B+, #136 of 729 statewide, top 20%, 973 students, 22% FRL); Sachem High School North (math 96% / reading 95%, grade A+, #76 of 1,100 statewide, top 7%, 1,923 students, 25% FRL).
- Market conditions: Rents rising fast (+7.3%/yr); 95 active listings in the ZIP; 2 comparable units currently listed for rent nearby; high-income renter base; 1,366 units permitted in Suffolk County in 2024 (216 in 5+ unit buildings).
- This rent runs 32% of the median local income ($144k/yr) — at the standard rent-burdened threshold; future hikes will face affordability resistance.
Forward outlook
- Local home prices are declining (-3.0%/yr); year-one equity from $4k of loan paydown is wiped out by about $16k of value loss. Plan a longer hold.
- Suffolk County population projected to shrink 5% by 2050 — rents likely to lag national; underwrite the cash flow, not the appreciation.
Negotiation context
- It's been on market 48 days — a 3% lower offer ($533k) is reasonable based on typical stale-listing flexibility.
- Current owner paid $360k; list at $549k implies a 52% gain — meaningful room to come down on a strong offer.
Risks & watch-outs
- Climate carrying-cost: major wind risk, 77% chance of damaging wind over 30y — expect insurance premiums to compound above CPI over the hold.
Questions for the listing agent
- What do current leases actually rent for vs. the listed asking? Can we see a recent rent roll and the last 12 months of T-12 income?
- It's been on market 48 days. Have you received any prior offers? Is the seller open to a 31% concession, seller financing, or rate buy-down credit?
- Built in 1974 — when were the roof, HVAC, electrical panel, plumbing, and water heater last replaced?
- Is there a deadline driving the sale (1031 exchange, divorce, estate, relocation)? That informs how much negotiation room exists.
- The area grade is low — what's the realistic commute time and amenity access for the typical tenant pool here? Any planned neighborhood developments (good or bad) we should know about?
- What's the average days-on-market for RENTAL listings here right now (not sales)? A rising rental-DOM trend means longer vacancies and softer asking-rent achievability than the comps imply.
- What's the recent tenant-quality profile in this submarket — average credit score on applications, eviction rate, late-payment / NSF rate, and stable-employment percentage? A property-management company in the area should have these aggregated.
- How much new for-sale + rental construction is in the pipeline within 1–3 miles? Heavy new supply typically softens prices + rents 12–24 months out; constrained supply supports both.
Investment metrics
- 1% rule
- 0.69% ✗
- Cap rate
- 4.46%
- Cash-on-cash
- -6.56%
- DSCR
- 0.71
- GRM
- 12.1
CMA / ARV
- ARV (median comp)
- $644,182
- List price
- $549,000
- Delta
- -14.78%
- Verdict
- UNDERPRICED
- Comps
- 20 within 1.0 mi
Show comp detail 11 sales within ~0.75 mi
| Address | Dist | Beds/Ba | Sqft | Sold | Price | $/sf | Match |
|---|---|---|---|---|---|---|---|
| 191 Philip St | 0.11mi | 3/1.5 | 1,311 (-6%) | 7mo | $635,000 | $484 | 80 |
| 170 Officials Ave | 0.21mi | 3/2.0 | 1,400 (+1%) | 11mo | $600,000 | $429 | 78 |
| 386 Lillian Blvd | 0.45mi | 3/1.5 | 1,400 (+1%) | 6mo | $705,000 | $504 | 73 |
| 297 Clarice Blvd | 0.24mi | 3/1.0 | 1,298 (-7%) | 5mo | $575,000 | $443 | 72 |
| 429 Mollie Blvd | 0.55mi | 3/2.0 | 1,346 (-3%) | 2mo | $615,000 | $457 | 65 |
| 126 Schmidt Ave | 0.26mi | 2/1.0 (-1) | 1,400 (+1%) | 24mo | $512,500 | $366 | 60 |
| 381 Grace St | 0.65mi | 3/2.0 | 1,332 (-4%) | 3mo | $640,000 | $480 | 58 |
| 1568 Carl Ave | 0.65mi | 3/1.5 | 1,367 (-2%) | 13mo | $611,000 | $447 | 56 |
| 1277 Hummel Ave | 0.49mi | 3/2.0 | 1,555 (+12%) | 4mo | $680,000 | $437 | 52 |
| 107 Avenue E | 0.66mi | 3/1.5 | 1,271 (-9%) | 11mo | $620,000 | $488 | 46 |
| 407 Albert St | 0.64mi | 3/2.5 | 1,600 (+15%) | 10mo | $610,000 | $381 | 33 |
Match score weights: distance 35% · size 25% · config 20% · recency 20%. Top-matched comps best support the ARV.
Projected returns pro-forma
-3.0% appreciation · 7.3% rent growth · sell at horizon
- IRR
- -22.9%
- Equity multiple
- 0.19×
- Total profit
- $-125,258
- Equity at exit
- $81,858
- IRR
- -9.0%
- Equity multiple
- 0.34×
- Total profit
- $-100,902
- Equity at exit
- $47,467
Cash invested: $153,720 (down + closing). Projections, not guarantees.
Landlord ↔ Tenant lean methodology
- Overall (STATE)
- 15 Strongly Tenant-Friendly
- State New York
- 15 Strongly Tenant-Friendly · D+10
- County
- — inherits STATE
- City
- — inherits STATE
ZIP-level market 11741
- Rents YoY
- 7.3%
- Active inventory
- 95
- Price-to-rent
- 12.1×
Monthly cashflow live
- Estimated rent
- $3,789 medium interval (Pro) →
- Mortgage (P&I)
- −$2,879
- Tax from tax record
- −$725 /mo · $8,706/yr
- Insurance
- −$229
- HOA
- −$0
- Vacancy / Maint / Mgmt
- −$796
- Net cashflow
- $-840
Break-even live
Sensitivity live
| Price | -10% $-529 | -5% $-684 | +0% $-840 | +5% $-995 | +10% $-1,150 |
|---|---|---|---|---|---|
| Rent | -10% $-1,139 | -5% $-989 | +0% $-840 | +5% $-690 | +10% $-540 |
| Rate | -1.0pp $-563 | -0.5pp $-700 | base $-840 | +0.5pp $-982 | +1.0pp $-1,127 |
UW: 25.0% down · 7.5% · 30yr · 1.5% tax · 5.0% vac · 8.0% maint · 8.0% mgmt
Financing live
Cash to close
- Down payment
- $137,250
- Closing costs
- $16,470
- Reserves months
- —
- Total cash needed
- —
Loan-product check · same deal, 3 products live
Conventional
25% down · 7.5% · 30yr
- Down + closing
- —
- Monthly P&I
- —
- Monthly cashflow
- —
- DSCR
- —
- Eligible?
- —
Personal DTI + credit; lowest rate.
DSCR
20% down · 8.5% · 30yr
- Down + closing
- —
- Monthly P&I
- —
- Monthly cashflow
- —
- DSCR
- —
- Eligible?
- —
No personal income docs; deal must DSCR.
Hard money
10% down · 12.0% · 12mo
- Down + closing
- —
- Monthly P&I
- —
- Monthly cashflow
- —
- DSCR
- —
- Eligible?
- —
Short-term bridge; refi at stabilization.
Rent comps 2 comps
| Address | Beds | Baths | Sqft | Rent | $/sqft | DOM | Units | Dist |
|---|---|---|---|---|---|---|---|---|
| 1000 Mill Rd Lake Ronkonkoma, NY | 2.0 | 1.0–2.0 | 843 | $4,220 | $5.01 | 0d | 14 | 1.30mi |
| 865 Broadway Ave Holbrook, NY | 2.0 | 1.0–2.0 | 893 | $3,590 | $4.02 | 0d | 34 | 1.44mi |
Listing history 6 events
-
2026-04-28price $549,000 640-char remark
Show marketing remark (640 chars)
Great Opportunity in Holbrook! Charming, Bright & Well Maintained 3 Bedroom & 1.5 Bath Colonial on a Peaceful, Dead-End Street and Nicely Manicured Property. XL Kitchen w/ SS Appliances, Comfortable Living Room w/ Cozy & Efficient Pellet Stove. Large Dining Room w/ Exit to Backyard. Beautiful LVP Flooring Throughout the First Level. Full & Half Baths Attractively Updated. Well Sized Bedrooms w/ WIC Closets. (3) Ductless Units Include AC, Heat & Dehumidifier Options, Updated Windows. Pull-Down Stairs Attic, Maintenance-Free Vinyl Fencing All Around, 4 Zone IGS, Backyard Paver Patio. Don't Let This One Pass You By!
-
2026-04-03$579,000 Active 640-char remark
Show marketing remark (640 chars)
Great Opportunity in Holbrook! Charming, Bright & Well Maintained 3 Bedroom & 1.5 Bath Colonial on a Peaceful, Dead-End Street and Nicely Manicured Property. XL Kitchen w/ SS Appliances, Comfortable Living Room w/ Cozy & Efficient Pellet Stove. Large Dining Room w/ Exit to Backyard. Beautiful LVP Flooring Throughout the First Level. Full & Half Baths Attractively Updated. Well Sized Bedrooms w/ WIC Closets. (3) Ductless Units Include AC, Heat & Dehumidifier Options, Updated Windows. Pull-Down Stairs Attic, Maintenance-Free Vinyl Fencing All Around, 4 Zone IGS, Backyard Paver Patio. Don't Let This One Pass You By!
-
2026-03-25historical $579,000 640-char remark
Show marketing remark (640 chars)
Great Opportunity in Holbrook! Charming, Bright & Well Maintained 3 Bedroom & 1.5 Bath Colonial on a Peaceful, Dead-End Street and Nicely Manicured Property. XL Kitchen w/ SS Appliances, Comfortable Living Room w/ Cozy & Efficient Pellet Stove. Large Dining Room w/ Exit to Backyard. Beautiful LVP Flooring Throughout the First Level. Full & Half Baths Attractively Updated. Well Sized Bedrooms w/ WIC Closets. (3) Ductless Units Include AC, Heat & Dehumidifier Options, Updated Windows. Pull-Down Stairs Attic, Maintenance-Free Vinyl Fencing All Around, 4 Zone IGS, Backyard Paver Patio. Don't Let This One Pass You By!
-
2008-01-24soldstatus $360,000
-
2000-01-11soldstatus $150,000
-
1987-02-20soldstatus $116,000
ⓘ Source: listings_history table (triggers on properties + properties_extension) + one-shot
backfill from property_details.listing_events for pre-trigger history.
Tax reassessment forecast NY · Partial reset (capped growth)
- Current annual tax
- $8,706 · $725/mo
- Projected year-2 tax
- $8,992 · $749/mo
- Expected delta
- +$286/yr (+$24/mo · 3.3%)
ⓘ Screening estimate from a state-policy table — verify with the county assessor before closing.
Climate risk First Street
- Flood 1/10 Low FEMA zone X (unshaded) · 0% chance over 30 yrs
- Wildfire 1/10 Low
- Heat 4/10 Moderate 7 d/yr ≥94°F today · 16 d/yr by 30 yrs out
- Wind 6/10 Major 77% chance of damaging wind over 30 yrs
- Air quality 4/10 Moderate 4 unhealthy d/yr today · 6 by 30 yrs out
Nearby sold comps map
Loading sold comps map…
Walkable amenities ~0.75 mi
Loading nearby amenities…
Taxation est. · year 1
- Rental income
- $45,472
- − Mortgage interest
- −$30,753
- − Property taxes
- −$8,706
- − Insurance
- −$2,745
- − Repairs & maintenance
- −$3,638
- − Management
- −$3,638
- − Depreciation
- −$15,971
- Taxable loss
- −$19,978
- Est. tax savings @ 24.0%
- +$4,795
- After-tax cash flow
- $-5,282/yr
For passive investors: Depreciation is non-cash, so a rental often shows a tax loss while cash-flowing — sheltering income. Rental losses are passive: they offset passive income freely, and up to $25,000/yr can offset ordinary (W-2) income if you actively participate and your MAGI is under $100k (phasing out to $0 by $150k); unused losses carry forward. On sale, claimed depreciation is recaptured at up to 25%, and gains may owe capital-gains tax (a 1031 exchange can defer both). Figures are a year-1 estimate at your 24.0% rate — not tax advice; consult a CPA.
Schools (NCES district)
- District
- Sachem Central School District
- NCES district ID
- 3625350
- Math proficiency
- 69% ▬ 0.00%
- Reading proficiency
- 76% ▲ 12.00%
- Median HH income
- $92,968
- Composite
- 65.53/100
- National rank
- #472
- State rank
- #86 of 590 in NY
Livability — Holbrook
- Score
- 66/100
- State rank
- #658
- US rank
- #12283
Category grades
Schools grade is shown separately in the Schools card above.
Census & demographics
- Census place
- Holbrook, NY
- County
- Suffolk County · 679,920 people
- City population
- 26,667
- Metro
- New York-Newark-Jersey City, NY-NJ-PA
- Population (ZIP)
- 26,667
- Household income
- $144,346
- Rent vs Own
- Severe rent burden
- 416.0
Population outlook (Suffolk County) Hauer SSP2
- Today (2025)
- 1,505,262 people
- By 2030
- 1,498,318 · -0.5%
- By 2040
- 1,471,101 · -2.3%
- By 2050
- 1,424,848 · -5.3%
- By 2075
- 1,337,157 · -11.2%
- By 2100
- 1,217,720 · -19.1%
Race, ethnicity, and origin ACS 2023
- Neighborhood character
- Predominantly White (75%)
- Race & ethnicity
- White 75% Hispanic / Latino 16% Two or more races 6% Asian 4% Black 3%
- Hispanic origin (detail)
- Puerto Rican 5%
- Common ancestry
- Romanian 6% Lithuanian 2% Scotch-Irish 1%
- Foreign-born
- 11% · Canada, China, Jamaica
- Languages at home
- 84% English-only · Spanish 9% Other Indo-European 2% Chinese 2%
Political lean MEDSL · Suffolk
- 2024 margin
- Lean R (+10.0) · D 45.0% · R 55.0%
- 2008→2024 swing
- -16.0pp toward R · 2008: 6.0pp · 2024: -10.0pp
- All cycles
- 2024: R+10.0 2020: R+0.0 2016: R+8.2 2012: D+2.9 2008: D+6.0
Not yet ingested
- Civics
- —
Market trends
- HPI YoY
- ▼ -682.71%
- Current HPI
- 328.9231
- Rent YoY
- ▲ 7.30%
- Metro
- New York-Newark-Jersey City, NY-NJ-PA
- State GDP YoY
- ▲ 2.60%
- F500 in state
- 92
Industry mix (Fortune 500 HQ in NY)
| Industry | F500 HQs | Revenue |
|---|---|---|
| Financial Services | 10 | $950B |
|
||
| Consumer Goods | 9 | $162B |
|
||
| Insurance | 4 | $225B |
|
||
| Telecommunications | 2 | $144B |
|
||
| Pharmaceuticals | 2 | $112B |
|
||
| Media / Entertainment | 2 | $69B |
|
||
Price history
+373.3% since first listed6 events — show timeline
- 2026-04-28 Price Changed $549,000 OneKey® MLS as Distributed by MLS Grid
- 2026-04-03 Listed $579,000 OneKey® MLS as Distributed by MLS Grid
- 2026-03-25 Coming Soon $579,000 OneKey® MLS as Distributed by MLS Grid
- 2008-01-24 Sold (Public Records) $360,000 Public Records
- 2000-01-11 Sold (Public Records) $150,000 Public Records
- 1987-02-20 Sold (Public Records) $116,000 Public Records
Property tax history
+2.2%/yrLatest (2025): $8,706 · +0.0% YoY. Source: county tax records.
Cash-flow waterfall
monthlySold comps — $/sqft
last 12 mo · ≤1 miLoading sold comps…