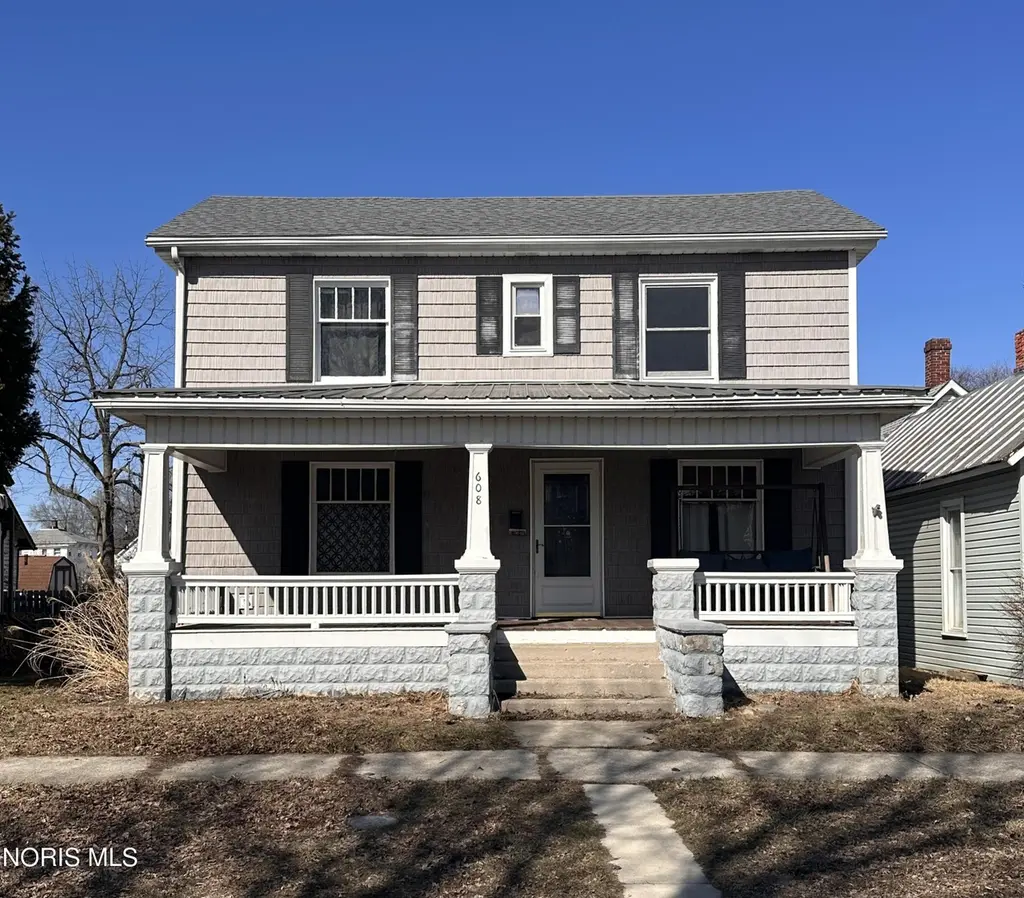
608 W Front St · Findlay, OH
Flood risk 3/10 · Minor
- FEMA flood zone
- X (unshaded)
- Chance of flooding over 30 yrs
- 0.18%
- Est. flood insurance / yr
- $473 – $860
Fire risk 1/10 · Minimal
- Est. fire insurance / yr
- $713 – $1,323
Heat risk 3/10 · Minor
- Hot days now (above 98°F)
- 7 days/yr
- Hot days in 30 yrs
- 17 days/yr
Wind risk 2/10 · Minimal
- Chance of severe wind over 30 yrs
- —
Air-quality risk 2/10 · Minimal
- Unhealthy air days now
- 1 days/yr
- Unhealthy air days in 30 yrs
- 2 days/yr
Risk factors via First Street. Map © Google.
Why this score? — see what drove the C grade
The composite is a weighted blend of 9 inputs, each scored 0–100. Each bar is that input's sub-score; the figure is the points it added to the 100-point composite (weight × sub-score).
- Cash flow +23.4/30.0
- DSCR +7.5/10.0
- ARV discount +6.5/15.0
- 1% rule +5.4/10.0
- Schools +4.7/10.0
- Livability +4.0/5.0
- Rent growth +3.9/5.0
- Condition / age +2.5/5.0
- Appreciation +0.0/10.0
$174,900
🖨 Deal sheet 📄 Offer letter ✓ Due diligence
Listing remarks MLS
This charming four-bedroom home perfectly blends timeless character with the modern amenities today's buyers crave. From the moment you step inside, you'll be greeted by stunning, original woodwork that adds a layer of warmth and craftsmanship rarely seen in newer builds. Whether you're looking for a private outdoor oasis or a versatile indoor layout, this property offers the space and "good bones" to make it your own
Key facts
- Original woodwork
- 0.23 acre lot
- 2 garage spots
Tags
Neighborhood map
What this means for you Summary
Snapshot
- This is a 4-bed/1.5-bath single-family listed at $175k.
Deal economics
- At list price, monthly cash flow is $324 ($4k/yr) — positive.
- The deal already cash-flows at list — no discount required.
- Meets the 1% rule at list price ($2k rent vs $175k).
- Recommended offer: $164k (6.0% below list) — sets the bar for market timing.
- Cap rate 8.5% vs local median 5.0% in Findlay — top-decile yield for the area; either an underpriced asset or a hidden risk that comps aren't pricing in. Stress-test before assuming the spread holds.
Location & tenants
- Location reads 81/100 on livability (#98 in OH, #1,496 nationally) — a professional / high-income tenant draw. Strengths: amenities A+, cost of living A+, housing A+; Watch: employment D+, commute F.
- Findlay City (town): math 56% / reading 56% proficiency, ranked #357 of 656 in OH (top 54%) — acceptable for families but not a draw, mixed tenant base, ~2y average lease.
- Market conditions: Rents rising fast (+5.7%/yr); 219 active listings in the ZIP; 3 comparable units currently listed for rent nearby; rentals lingering (median 44d on market — plan ~5-8 weeks vacancy on turnover, expect pricing pressure); 100% of comp listings sitting > 30 days — soft ceiling on asking rent; 257 units permitted in Hancock County in 2024 (150 in 5+ unit buildings).
- This rent runs 32% of the median local income ($68k/yr) — at the standard rent-burdened threshold; future hikes will face affordability resistance.
Forward outlook
- Local home prices are declining (-3.0%/yr); year-one equity from $1k of loan paydown is wiped out by about $5k of value loss. Plan a longer hold.
- Hancock County population projected to shrink 4% by 2050 — rents likely to lag national; underwrite the cash flow, not the appreciation.
- At projected returns (-3.0% appreciation + 5.7% rent growth), your $49k cash investment doubles in ~10 years — after that, you're playing with house money.
Negotiation context
- It's been on market 82 days — a 6% lower offer ($164k) is reasonable based on typical stale-listing flexibility.
- 3 sale attempts since 5y ago with the ask held roughly flat each time — persistent listings suggest the price (not the market) is what's stuck; bring a comps-based counter.
- Current owner paid $140k; 25% above their basis — modest negotiation headroom, anchor on the comps not their cost.
Risks & watch-outs
- Watch-outs: built in 1870 — expect roof / HVAC / electrical / plumbing capex.
Questions for the listing agent
- It's been on market 82 days. Have you received any prior offers? Is the seller open to a 6% concession, seller financing, or rate buy-down credit?
- Built in 1870 — when were the roof, HVAC, electrical panel, plumbing, and water heater last replaced?
- Why hasn't it sold? Are there any deal-killer items the seller is aware of (foundation, flood, title, zoning, code violations)?
- Is there a deadline driving the sale (1031 exchange, divorce, estate, relocation)? That informs how much negotiation room exists.
- Schools are B-rated — typically a magnet for longer-tenancy family renters. What's the average tenant stay here, and is there a school-zone premium baked into asking?
- What's the average days-on-market for RENTAL listings here right now (not sales)? A rising rental-DOM trend means longer vacancies and softer asking-rent achievability than the comps imply.
- What's the recent tenant-quality profile in this submarket — average credit score on applications, eviction rate, late-payment / NSF rate, and stable-employment percentage? A property-management company in the area should have these aggregated.
- How much new for-sale + rental construction is in the pipeline within 1–3 miles? Heavy new supply typically softens prices + rents 12–24 months out; constrained supply supports both.
Investment metrics
- 1% rule
- 1.04% ✓
- Cap rate
- 8.52%
- Cash-on-cash
- 7.95%
- DSCR
- 1.35
- GRM
- 8.0
CMA / ARV
- ARV (median comp)
- $171,183
- List price
- $174,900
- Delta
- 2.17%
- Verdict
- FAIR
- Comps
- 20 within 1.0 mi
Show comp detail 12 sales within ~0.75 mi
| Address | Dist | Beds/Ba | Sqft | Sold | Price | $/sf | Match |
|---|---|---|---|---|---|---|---|
| 210 Western Ave | 0.09mi | 4/1.5 | 1,856 (-3%) | 7mo | $80,000 | $43 | 85 |
| 618 Washington St | 0.09mi | 3/1.5 (-1) | 1,814 (-6%) | 9mo | $211,000 | $116 | 74 |
| 430 Portz Ave | 0.32mi | 3/2.0 (-1) | 1,894 (-1%) | 9mo | $180,000 | $95 | 68 |
| 512 N Cory St | 0.57mi | 4/2.0 | 1,950 (+2%) | 4mo | $197,000 | $101 | 65 |
| 807 W Main Cross St | 0.16mi | 3/1.5 (-1) | 1,658 (-14%) | 1mo | $165,000 | $100 | 64 |
| 225 Lima Ave | 0.69mi | 4/2.0 | 1,916 (-0%) | 6mo | $197,000 | $103 | 61 |
| 845 Hurd Ave | 0.65mi | 3/1.0 (-1) | 1,868 (-3%) | 0mo | $205,000 | $110 | 58 |
| 412 Lima Ave | 0.73mi | 5/2.0 (+1) | 1,930 (+0%) | 3mo | $215,000 | $111 | 55 |
| 535 W Lima St | 0.54mi | 4/2.0 | 2,106 (+10%) | 7mo | $263,000 | $125 | 51 |
| 224 Defiance Ave | 0.61mi | 4/2.0 | 1,716 (-11%) | 4mo | $199,900 | $116 | 48 |
| 505 N Cory St | 0.57mi | 3/1.5 (-1) | 1,741 (-9%) | 8mo | $140,000 | $80 | 46 |
| 720 S West St | 0.56mi | 3/2.0 (-1) | 1,728 (-10%) | 6mo | $264,276 | $153 | 45 |
Match score weights: distance 35% · size 25% · config 20% · recency 20%. Top-matched comps best support the ARV.
Projected returns pro-forma
-3.0% appreciation · 5.68% rent growth · sell at horizon
- IRR
- -1.4%
- Equity multiple
- 0.94×
- Total profit
- $-2,703
- Equity at exit
- $26,078
- IRR
- 10.8%
- Equity multiple
- 1.94×
- Total profit
- $45,853
- Equity at exit
- $15,122
Cash invested: $48,972 (down + closing). Projections, not guarantees.
Landlord ↔ Tenant lean methodology
- Overall (STATE)
- 73 Landlord-Friendly
- State Ohio
- 73 Landlord-Friendly · R+6
- County
- — inherits STATE
- City
- — inherits STATE
ZIP-level market 45840
- Rents YoY
- 5.7%
- Active inventory
- 219
- Price-to-rent
- 8.0×
Monthly cashflow live
- Estimated rent
- $1,812 medium interval (Pro) →
- Mortgage (P&I)
- −$917
- Tax from tax record
- −$117 /mo · $1,406/yr
- Insurance
- −$73
- HOA
- −$0
- Vacancy / Maint / Mgmt
- −$381
- Net cashflow
- $324
Break-even live
UW: 25.0% down · 7.5% · 30yr · 1.5% tax · 5.0% vac · 8.0% maint · 8.0% mgmt
Financing live
Cash to close
- Down payment
- $43,725
- Closing costs
- $5,247
- Reserves months
- —
- Total cash needed
- —
Loan-product check · same deal, 3 products live
Conventional
25% down · 7.5% · 30yr
- Down + closing
- —
- Monthly P&I
- —
- Monthly cashflow
- —
- DSCR
- —
- Eligible?
- —
Personal DTI + credit; lowest rate.
DSCR
20% down · 8.5% · 30yr
- Down + closing
- —
- Monthly P&I
- —
- Monthly cashflow
- —
- DSCR
- —
- Eligible?
- —
No personal income docs; deal must DSCR.
Hard money
10% down · 12.0% · 12mo
- Down + closing
- —
- Monthly P&I
- —
- Monthly cashflow
- —
- DSCR
- —
- Eligible?
- —
Short-term bridge; refi at stabilization.
Rent comps 3 comps
| Address | Beds | Baths | Sqft | Rent | $/sqft | DOM | Units | Dist |
|---|---|---|---|---|---|---|---|---|
| 517 Lima Ave Findlay, OH | 3.0 | 1.0 | 1600 | $1,595 | $1.00 | 43d | 1 | 0.85mi |
| 606 South St Findlay, OH | 3.0 | 1.0 | 1351 | $1,700 | $1.26 | 43d | 1 | 1.09mi |
| 220 Potomac Dr Bldg 6 Findlay, OH | 3.0 | 2.5 | 1365 | $1,995 | $1.46 | 43d | 1 | 1.30mi |
Listing history 11 events
-
2026-05-31status $174,900 Pending 82 DOM
-
2026-05-31days on market $174,900 Active 82 DOM
-
2026-05-30days on market $174,900 Active 81 DOM
-
2026-04-15price $174,900 431-char remark
Show marketing remark (431 chars)
This charming four-bedroom home perfectly blends timeless character with the modern amenities today's buyers crave. From the moment you step inside, you'll be greeted by stunning, original woodwork that adds a layer of warmth and craftsmanship rarely seen in newer builds. Whether you're looking for a private outdoor oasis or a versatile indoor layout, this property offers the space and "good bones" to make it your own
-
2026-03-09$179,900 Active 431-char remark
Show marketing remark (431 chars)
This charming four-bedroom home perfectly blends timeless character with the modern amenities today's buyers crave. From the moment you step inside, you'll be greeted by stunning, original woodwork that adds a layer of warmth and craftsmanship rarely seen in newer builds. Whether you're looking for a private outdoor oasis or a versatile indoor layout, this property offers the space and "good bones" to make it your own
-
2024-02-01historical
-
2023-11-30$169,900 Active
-
2021-11-17soldstatus $139,900 Closed
-
2021-10-04historical Contingent
-
2021-09-27$139,900 Active
-
2005-06-03soldstatus $103,000
ⓘ Source: listings_history table (triggers on properties + properties_extension) + one-shot
backfill from property_details.listing_events for pre-trigger history.
Tax reassessment forecast OH · Partial reset (capped growth)
- Current annual tax
- $1,406 · $117/mo
- Projected year-2 tax
- $2,067 · $172/mo
- Expected delta
- +$661/yr (+$55/mo · 47.0%)
ⓘ Screening estimate from a state-policy table — verify with the county assessor before closing.
Climate risk First Street
- Flood 3/10 Moderate FEMA zone X (unshaded) · 18% chance over 30 yrs
- Wildfire 1/10 Low
- Heat 3/10 Moderate 7 d/yr ≥98°F today · 17 d/yr by 30 yrs out
- Wind 2/10 Low
- Air quality 2/10 Low 1 unhealthy d/yr today · 2 by 30 yrs out
Nearby sold comps map
Loading sold comps map…
Walkable amenities ~0.75 mi
Loading nearby amenities…
Taxation est. · year 1
- Rental income
- $21,745
- − Mortgage interest
- −$9,797
- − Property taxes
- −$1,406
- − Insurance
- −$874
- − Repairs & maintenance
- −$1,740
- − Management
- −$1,740
- − Depreciation
- −$5,088
- Taxable income
- $1,100
- Est. tax owed @ 24.0%
- −$264
- After-tax cash flow
- $3,628/yr
For passive investors: Depreciation is non-cash, so a rental often shows a tax loss while cash-flowing — sheltering income. Rental losses are passive: they offset passive income freely, and up to $25,000/yr can offset ordinary (W-2) income if you actively participate and your MAGI is under $100k (phasing out to $0 by $150k); unused losses carry forward. On sale, claimed depreciation is recaptured at up to 25%, and gains may owe capital-gains tax (a 1031 exchange can defer both). Figures are a year-1 estimate at your 24.0% rate — not tax advice; consult a CPA.
Schools (NCES district)
- District
- Findlay City
- NCES district ID
- 3910000
- Math proficiency
- 56% ▼ -11.00%
- Reading proficiency
- 56% ▼ -9.00%
- Median HH income
- $45,261
- Composite
- 47.31/100
- National rank
- #2300
- State rank
- #357 of 656 in OH
Livability — Findlay
- Score
- 81/100
- State rank
- #98
- US rank
- #1496
Category grades
Schools grade is shown separately in the Schools card above.
Census & demographics
- Census place
- Findlay, OH
- County
- Hancock County · 54,559 people
- City population
- 54,559
- Metro
- Findlay, OH
- Population (ZIP)
- 54,559
- Household income
- $68,083
- Rent vs Own
- Severe rent burden
- 1540.0
Population outlook (Hancock County) Hauer SSP2
- Today (2025)
- 77,526 people
- By 2030
- 77,777 · +0.3%
- By 2040
- 76,976 · -0.7%
- By 2050
- 74,479 · -3.9%
- By 2075
- 65,741 · -15.2%
- By 2100
- 52,942 · -31.7%
Race, ethnicity, and origin ACS 2023
- Neighborhood character
- Predominantly White (85%)
- Race & ethnicity
- White 85% Hispanic / Latino 6% Two or more races 5% Asian 2% Black 2%
- Hispanic origin (detail)
- Mexican 5%
- Common ancestry
- Romanian 3% Italian 2% Lithuanian 2%
- Foreign-born
- 4% · Canada, China
- Languages at home
- 94% English-only · Spanish 3% Other Asian/Pacific 1% Arabic 1%
Political lean MEDSL · Hancock
- 2024 margin
- Solid R (+38.4) · D 30.2% · R 68.7% · Other 1.1%
- 2008→2024 swing
- -15.3pp toward R · 2008: -23.1pp · 2024: -38.4pp
- All cycles
- 2024: R+38.4 2020: R+37.5 2016: R+40.8 2012: R+28.3 2008: R+23.1
Not yet ingested
- Civics
- —
Market trends
- HPI YoY
- ▼ -250.43%
- Current HPI
- 194.9132
- Rent YoY
- ▲ 5.68%
- Metro
- Findlay, OH
- State GDP YoY
- ▲ 1.98%
- F500 in state
- 48
Industry mix (Fortune 500 HQ in OH)
| Industry | F500 HQs | Revenue |
|---|---|---|
| Insurance | 3 | $145B |
|
||
| Industrial Machinery | 3 | $49B |
|
||
| Financial Services | 3 | $24B |
|
||
| Consumer Goods | 2 | $93B |
|
||
| Aerospace / Defense | 2 | $47B |
|
||
| Utilities | 2 | $33B |
|
||
Price history
+69.8% since first listed8 events — show timeline
- 2026-04-15 Price Changed $174,900 NORIS
- 2026-03-09 Listed $179,900 NORIS
- 2024-02-01 Listing Removed — NORIS
- 2023-11-30 Listed $169,900 NORIS
- 2021-11-17 Sold (MLS) $139,900 NORIS
- 2021-10-04 Contingent — NORIS
- 2021-09-27 Listed $139,900 NORIS
- 2005-06-03 Sold (Public Records) $103,000 Public Records
Property tax history
+2.6%/yrLatest (2025): $1,406 · +12.3% YoY. Source: county tax records.
Cash-flow waterfall
monthlySold comps — $/sqft
last 12 mo · ≤1 miLoading sold comps…