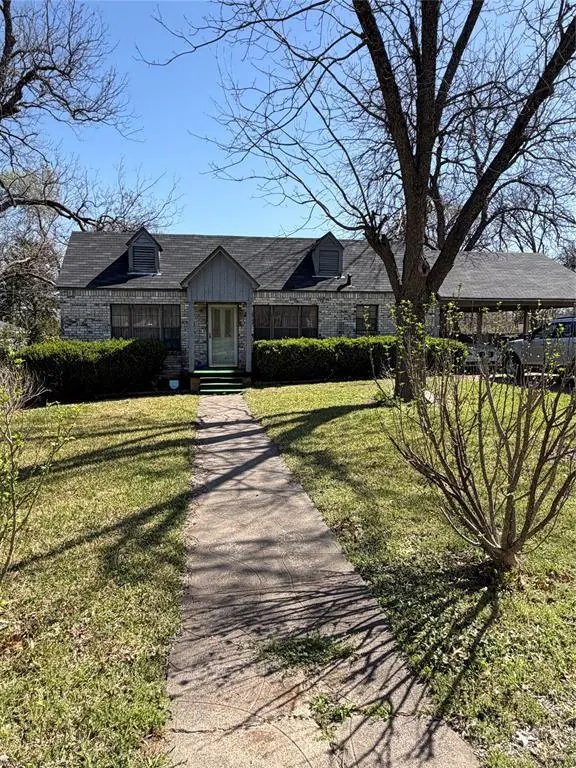
4412 Humphrey Dr · Dallas, TX
Flood risk 1/10 · Minimal
- FEMA flood zone
- X (unshaded)
- Chance of flooding over 30 yrs
- 0.0%
- Est. flood insurance / yr
- $507 – $1,088
Fire risk 2/10 · Minimal
- Est. fire insurance / yr
- $1,222 – $2,270
Heat risk 7/10 · Major
- Hot days now (above 110°F)
- 7 days/yr
- Hot days in 30 yrs
- 23 days/yr
Wind risk 6/10 · Moderate
- Chance of severe wind over 30 yrs
- 27.0%
Air-quality risk 2/10 · Minimal
- Unhealthy air days now
- 1 days/yr
- Unhealthy air days in 30 yrs
- 2 days/yr
Risk factors via First Street. Map © Google.
Why this score? — see what drove the D grade
The composite is a weighted blend of 9 inputs, each scored 0–100. Each bar is that input's sub-score; the figure is the points it added to the 100-point composite (weight × sub-score).
- ARV discount +15.0/15.0
- Cash flow +8.3/30.0
- Livability +4.0/5.0
- 1% rule +3.8/10.0
- Rent growth +3.6/5.0
- Schools +2.8/10.0
- Condition / age +2.5/5.0
- DSCR +2.3/10.0
- Appreciation +0.0/10.0
$190,000
🖨 Deal sheet 📄 Offer letter ✓ Due diligence
Listing remarks MLS
Opportunity meets potential on this spacious .42-acre property backing directly to Seaton Park. This 2-bedroom, 1-bath home offers a rare chance for investors or visionaries looking to renovate, expand, or reimagine. The main residence is complemented by a detached ADU guest quarters featuring its own bedroom, bathroom, kitchen, and living area—ideal for rental income, multigenerational living, or a private workspace. Surrounded by mature trees and with no rear neighbors, the lot provides added privacy and a peaceful natural backdrop. Whether you’re looking to create a primary residence with income potential or take on your next investment project, the possibilities here are strong. Please note: this is an investor special being sold as-is. The property does contain debris that will not be removed, making it best suited for buyers prepared for cleanup and renovation.
Key facts
- 0.42 acre lot
- Parking
- Built 1945
Neighborhood map
What this means for you Summary
Snapshot
- This is a 2-bed/1.0-bath single-family listed at $190k.
Deal economics
- At list price, monthly cash flow is $-174 ($-2k/yr) — negative.
- To cash-flow at today's rent, offer at most $159k (16.2% below list).
- To meet the 1% rule (rent ≥ 1% of price), the offer needs to be $167k (11.9% below list).
- Recommended offer: $159k (16.2% below list) — sets the bar for cash-flow.
- Cap rate 5.2% vs local median 2.3% in Dallas — top-decile yield for the area; either an underpriced asset or a hidden risk that comps aren't pricing in. Stress-test before assuming the spread holds.
Location & tenants
- Location reads 81/100 on livability (#24 in TX, #1,380 nationally) — a professional / high-income tenant draw. Strengths: amenities A+, commute A+, housing A+; Watch: schools C-, crime F.
- Dallas ISD (urban): math 31% / reading 36% proficiency, ranked #559 of 826 in TX (top 68%) — families likely to look elsewhere, expect single-tenant / working-renter base with shorter leases; 83% free/reduced lunch — lower-income household profile, screen leases tightly.
- Market conditions: Rents rising fast (+4.2%/yr); 249 active listings in the ZIP; 19 comparable units currently listed for rent nearby; rentals at typical pace (median 24d on market — plan ~3-4 weeks tenant-placement turnaround); 42% of comp listings sitting > 30 days — soft ceiling on asking rent; lower-income renter base — watch delinquency; 12,577 units permitted in Dallas County in 2024 (6,829 in 5+ unit buildings).
- At $1,674/mo this rent would consume 49% of the median local household income ($41k/yr) (locally 2465% of renters already pay >50% of income on rent) — very limited rent-growth headroom before tenants either downsize or default.
Forward outlook
- Local home prices are declining (-3.0%/yr); year-one equity from $1k of loan paydown is wiped out by about $6k of value loss. Plan a longer hold.
- Dallas County population projected at +35% by 2050 — long-run rental-demand tailwind backs the buy-and-hold thesis.
Negotiation context
- It's been on market 59 days — a 3% lower offer ($184k) is reasonable based on typical stale-listing flexibility.
Risks & watch-outs
- Watch-outs: property tax is 2.7% of price; built in 1945 — expect roof / HVAC / electrical / plumbing capex.
- Climate carrying-cost: major wind risk, 27% chance of damaging wind over 30y; extreme-heat days projected 7→23/yr by 2055 (HVAC capex compounding) — expect insurance premiums to compound above CPI over the hold.
Questions for the listing agent
- What do current leases actually rent for vs. the listed asking? Can we see a recent rent roll and the last 12 months of T-12 income?
- It's been on market 59 days. Have you received any prior offers? Is the seller open to a 16% concession, seller financing, or rate buy-down credit?
- Built in 1945 — when were the roof, HVAC, electrical panel, plumbing, and water heater last replaced?
- Property tax is high relative to price — has the assessment been appealed recently, and will the sale trigger a re-assessment?
- Is there a deadline driving the sale (1031 exchange, divorce, estate, relocation)? That informs how much negotiation room exists.
- Crime grade is F in this area — have there been break-ins, vandalism, or insurance claims at this property in the last 3 years? What carrier currently insures it and at what premium?
- The area grade is low — what's the realistic commute time and amenity access for the typical tenant pool here? Any planned neighborhood developments (good or bad) we should know about?
- What's the average days-on-market for RENTAL listings here right now (not sales)? A rising rental-DOM trend means longer vacancies and softer asking-rent achievability than the comps imply.
- What's the recent tenant-quality profile in this submarket — average credit score on applications, eviction rate, late-payment / NSF rate, and stable-employment percentage? A property-management company in the area should have these aggregated.
- How much new for-sale + rental construction is in the pipeline within 1–3 miles? Heavy new supply typically softens prices + rents 12–24 months out; constrained supply supports both.
Investment metrics
- 1% rule
- 0.88% ✗
- Cap rate
- 5.19%
- Cash-on-cash
- -3.93%
- DSCR
- 0.83
- GRM
- 9.5
CMA / ARV
- ARV (median comp)
- $240,621
- List price
- $190,000
- Delta
- -21.04%
- Verdict
- UNDERPRICED
- Comps
- 20 within 1.0 mi
Show comp detail 12 sales within ~0.75 mi
| Address | Dist | Beds/Ba | Sqft | Sold | Price | $/sf | Match |
|---|---|---|---|---|---|---|---|
| 3818 Le Forge Ave | 0.35mi | 3/2.0 (+1) | 1,450 (-2%) | 7mo | $279,999 | $193 | 66 |
| 3436 Kristen Dr | 0.43mi | 3/2.0 (+1) | 1,432 (-3%) | 2mo | $285,900 | $200 | 64 |
| 4605 Haas Dr | 0.39mi | 3/1.0 (+1) | 1,356 (-8%) | 1mo | $125,000 | $92 | 62 |
| 3823 Le May Ave | 0.37mi | 3/2.0 (+1) | 1,364 (-8%) | 8mo | $299,000 | $219 | 54 |
| 2916 Wilhurt Ave | 0.47mi | 3/2.0 (+1) | 1,562 (+6%) | 10mo | $299,999 | $192 | 51 |
| 2914 Wilhurt Ave | 0.49mi | 3/2.0 (+1) | 1,562 (+6%) | 11mo | $299,999 | $192 | 50 |
| 3347 Springview Ave | 0.55mi | 3/2.5 (+1) | 1,624 (+10%) | 6mo | $305,000 | $188 | 43 |
| 4235 Bonnie View Rd | 0.63mi | 3/2.0 (+1) | 1,344 (-9%) | 6mo | $225,000 | $167 | 41 |
| 3250 E Ledbetter Dr | 0.62mi | 3/2.0 (+1) | 1,392 (-6%) | 15mo | $139,000 | $100 | 40 |
| 2977 Marjorie Ave | 0.73mi | 3/1.0 (+1) | 1,324 (-10%) | 6mo | $170,000 | $128 | 38 |
| 3025 Dahlia Dr | 0.75mi | 3/1.0 (+1) | 1,356 (-8%) | 14mo | $150,000 | $111 | 34 |
| 3039 Dahlia Dr | 0.71mi | 3/2.0 (+1) | 1,275 (-14%) | 1mo | $220,000 | $173 | 34 |
Match score weights: distance 35% · size 25% · config 20% · recency 20%. Top-matched comps best support the ARV.
Projected returns pro-forma
-3.0% appreciation · 4.2% rent growth · sell at horizon
- IRR
- -21.3%
- Equity multiple
- 0.25×
- Total profit
- $-39,700
- Equity at exit
- $28,330
- IRR
- -11.8%
- Equity multiple
- 0.25×
- Total profit
- $-39,693
- Equity at exit
- $16,428
Cash invested: $53,200 (down + closing). Projections, not guarantees.
Landlord ↔ Tenant lean methodology
- Overall (STATE)
- 87 Strongly Landlord-Friendly
- State Texas
- 87 Strongly Landlord-Friendly · R+5
- County
- — inherits STATE
- City
- — inherits STATE
ZIP-level market 75216
- Home prices YoY
- -29.7%
- Rents YoY
- 4.2%
- Active inventory
- 249
- Price-to-rent
- 9.5×
Monthly cashflow live
- Estimated rent
- $1,674 high interval (Pro) →
- Mortgage (P&I)
- −$996
- Tax from tax record
- −$421 /mo · $5,057/yr
- Insurance
- −$79
- HOA
- −$0
- Vacancy / Maint / Mgmt
- −$352
- Net cashflow
- $-174
Break-even live
UW: 25.0% down · 7.5% · 30yr · 1.5% tax · 5.0% vac · 8.0% maint · 8.0% mgmt
Financing live
Cash to close
- Down payment
- $47,500
- Closing costs
- $5,700
- Reserves months
- —
- Total cash needed
- —
Loan-product check · same deal, 3 products live
Conventional
25% down · 7.5% · 30yr
- Down + closing
- —
- Monthly P&I
- —
- Monthly cashflow
- —
- DSCR
- —
- Eligible?
- —
Personal DTI + credit; lowest rate.
DSCR
20% down · 8.5% · 30yr
- Down + closing
- —
- Monthly P&I
- —
- Monthly cashflow
- —
- DSCR
- —
- Eligible?
- —
No personal income docs; deal must DSCR.
Hard money
10% down · 12.0% · 12mo
- Down + closing
- —
- Monthly P&I
- —
- Monthly cashflow
- —
- DSCR
- —
- Eligible?
- —
Short-term bridge; refi at stabilization.
Rent comps 19 comps
| Address | Beds | Baths | Sqft | Rent | $/sqft | DOM | Units | Dist |
|---|---|---|---|---|---|---|---|---|
| 4105 Balch Dr Unit B Dallas, TX | 3.0 | 2.5 | 1524 | $1,650 | $1.08 | 24d | 1 | 0.50mi |
| 4105 Balch Dr Dallas, TX | 3.0 | 2.5 | 1464 | $1,650 | $1.13 | 43d | 1 | 0.51mi |
| 3024 Modree Ave Dallas, TX | 3.0 | 2.0 | 1149 | $1,700 | $1.48 | 43d | 1 | 0.57mi |
| 3460 South Loop 12 Dallas, TX | 3.0 | 2.0 | 1048 | $1,350 | $1.29 | 24d | 1 | 0.71mi |
| 3015 E Ledbetter Dr Dallas, TX | 2.0–3.0 | 2.0 | 1030 | $1,100 | $1.07 | 3d | 1 | 0.92mi |
| 4836 Sunnyvale St Dallas, TX | 1.0–3.0 | 1.0–2.0 | 515 | $1,330 | $2.58 | 43d | 7 | 0.93mi |
| 3130 Stag Rd Dallas, TX | 1.0–3.0 | 1.0–2.0 | 831 | $1,318 | $1.59 | 43d | 3 | 1.04mi |
| 4306 Landrum Ave Dallas, TX | 3.0 | 2.0 | 1226 | $1,695 | $1.38 | 2d | 1 | 1.05mi |
| 4306 Landrum Ave Dallas, TX | 3.0 | 2.0 | 1226 | $1,695 | $1.38 | 6d | 1 | 1.05mi |
| 4717 Zealand St Dallas, TX | 3.0 | 2.0 | 1280 | $2,195 | $1.71 | 18d | 1 | 1.17mi |
| 4718 Zealand St Dallas, TX | 3.0 | 2.0 | 1280 | $2,195 | $1.71 | 18d | 1 | 1.18mi |
| 4720 Burma Rd Dallas, TX | 3.0 | 2.0 | 1318 | $1,895 | $1.44 | 43d | 1 | 1.20mi |
| 4744 Stokes St Dallas, TX | 3.0 | 2.0 | 1440 | $1,700 | $1.18 | 10d | 1 | 1.24mi |
| 2526 Exeter Ave Dallas, TX | 3.0 | 2.0 | 1520 | $1,800 | $1.18 | 10d | 1 | 1.24mi |
| 2751 E Ledbetter Dr Dallas, TX | 1.0–3.0 | 1.0–1.5 | 794 | $1,186 | $1.49 | 43d | 3 | 1.25mi |
| 2669 Marfa Ave Unit 3 Dallas, TX | 1.0 | 1.0 | 1248 | $750 | $0.60 | 24d | 1 | 1.25mi |
| 4750 Burma Rd Dallas, TX | 3.0 | 2.0 | 1090 | $1,499 | $1.38 | 24d | 1 | 1.27mi |
| 5175 Cardiff St Dallas, TX | 3.0 | 1.0 | 1248 | $1,650 | $1.32 | 43d | 1 | 1.45mi |
| 3320 Mundy Dr Dallas, TX | 3.0 | 2.0 | 1010 | $1,695 | $1.68 | 43d | 1 | 1.46mi |
Listing history 14 events
-
2026-06-18days on market $190,000 Active 59 DOM
-
2026-06-17statusdays on market $190,000 Active 58 DOM
-
2026-06-16days on market $190,000 Active Option Contract 57 DOM
-
2026-06-15days on market $190,000 Active Option Contract 56 DOM
-
2026-06-13statusdays on market $190,000 Active Option Contract 54 DOM
-
2026-06-09days on market $190,000 Active 50 DOM
-
2026-06-08days on market $190,000 Active 49 DOM
-
2026-06-07days on market $190,000 Active 48 DOM
-
2026-06-04days on market $190,000 Active 45 DOM
-
2026-06-03days on market $190,000 Active 44 DOM
-
2026-06-02days on market $190,000 Active 43 DOM
-
2026-06-01days on market $190,000 Active 42 DOM
-
2026-05-31days on market $190,000 Active 41 DOM
-
2026-04-20$220,000 Active 891-char remark
Show marketing remark (891 chars)
Opportunity meets potential on this spacious .42-acre property backing directly to Seaton Park. This 2-bedroom, 1-bath home offers a rare chance for investors or visionaries looking to renovate, expand, or reimagine. The main residence is complemented by a detached ADU guest quarters featuring its own bedroom, bathroom, kitchen, and living area—ideal for rental income, multigenerational living, or a private workspace. Surrounded by mature trees and with no rear neighbors, the lot provides added privacy and a peaceful natural backdrop. Whether you’re looking to create a primary residence with income potential or take on your next investment project, the possibilities here are strong. Please note: this is an investor special being sold as-is. The property does contain debris that will not be removed, making it best suited for buyers prepared for cleanup and renovation.
ⓘ Source: listings_history table (triggers on properties + properties_extension) + one-shot
backfill from property_details.listing_events for pre-trigger history.
Tax reassessment forecast TX · Resets to sale price
- Current annual tax
- $5,057 · $421/mo
- Projected year-2 tax
- $5,057 · $421/mo
- Expected delta
- $0/yr ($0/mo · 0.0%)
ⓘ Screening estimate from a state-policy table — verify with the county assessor before closing.
Climate risk First Street
- Flood 1/10 Low FEMA zone X (unshaded) · 0% chance over 30 yrs
- Wildfire 2/10 Low
- Heat 7/10 Severe 7 d/yr ≥110°F today · 23 d/yr by 30 yrs out
- Wind 6/10 Major 27% chance of damaging wind over 30 yrs
- Air quality 2/10 Low 1 unhealthy d/yr today · 2 by 30 yrs out
Nearby sold comps map
Loading sold comps map…
Walkable amenities ~0.75 mi
Loading nearby amenities…
Taxation est. · year 1
- Rental income
- $20,092
- − Mortgage interest
- −$10,643
- − Property taxes
- −$5,057
- − Insurance
- −$950
- − Repairs & maintenance
- −$1,607
- − Management
- −$1,607
- − Depreciation
- −$5,527
- Taxable loss
- −$5,300
- Est. tax savings @ 24.0%
- +$1,272
- After-tax cash flow
- $-819/yr
For passive investors: Depreciation is non-cash, so a rental often shows a tax loss while cash-flowing — sheltering income. Rental losses are passive: they offset passive income freely, and up to $25,000/yr can offset ordinary (W-2) income if you actively participate and your MAGI is under $100k (phasing out to $0 by $150k); unused losses carry forward. On sale, claimed depreciation is recaptured at up to 25%, and gains may owe capital-gains tax (a 1031 exchange can defer both). Figures are a year-1 estimate at your 24.0% rate — not tax advice; consult a CPA.
Schools (NCES district)
- District
- Dallas ISD
- NCES district ID
- 4816230
- Math proficiency
- 31% ▼ -16.00%
- Reading proficiency
- 36% ▼ -4.00%
- Median HH income
- $42,881
- Composite
- 28.41/100
- National rank
- #6763
- State rank
- #559 of 826 in TX
Livability — Dallas
- Score
- 81/100
- State rank
- #24
- US rank
- #1380
Category grades
Schools grade is shown separately in the Schools card above.
Census & demographics
- Census place
- Dallas, TX
- County
- Dallas County · 2,612,404 people
- City population
- 1,168,437
- Metro
- Dallas-Fort Worth-Arlington, TX
- Population (ZIP)
- 55,894
- Household income
- $41,386
- Rent vs Own
- Severe rent burden
- 2465.0
Population outlook (Dallas County) Hauer SSP2
- Today (2025)
- 2,979,839 people
- By 2030
- 3,191,823 · +7.1%
- By 2040
- 3,619,611 · +21.5%
- By 2050
- 4,026,915 · +35.1%
- By 2075
- 4,957,073 · +66.4%
- By 2100
- 5,508,725 · +84.9%
Race, ethnicity, and origin ACS 2023
- Neighborhood character
- Majority Black (51%)
- Race & ethnicity
- Black 51% Hispanic / Latino 44% Two or more races 14% White 3%
- Hispanic origin (detail)
- Mexican 40%
- Common ancestry
- Hispanic 1%
- Foreign-born
- 17% · Canada
- Languages at home
- 62% English-only · Spanish 37%
Political lean MEDSL · Dallas
- 2024 margin
- Strong D (+22.2) · D 60.2% · R 38.0% · Other 1.8%
- 2008→2024 swing
- +6.9pp toward D · 2008: 15.3pp · 2024: 22.2pp
- All cycles
- 2024: D+22.2 2020: D+31.6 2016: D+26.2 2012: D+15.4 2008: D+15.3
Not yet ingested
- Civics
- —
Market trends
- HPI YoY
- ▼ -126.35%
- Current HPI
- 299.1825
- Rent YoY
- ▲ 4.20%
- Metro
- Dallas-Fort Worth-Arlington, TX
- State GDP YoY
- ▲ 3.95%
- F500 in state
- 110
Industry mix (Fortune 500 HQ in TX)
| Industry | F500 HQs | Revenue |
|---|---|---|
| Energy | 16 | $1,198B |
|
||
| Technology | 5 | $198B |
|
||
| Engineering / Construction | 4 | $72B |
|
||
| Energy Services | 3 | $60B |
|
||
| Utilities | 3 | $41B |
|
||
| Healthcare | 2 | $330B |
|
||
Price history
1 event — show timeline
- 2026-04-20 Listed $220,000 NTREIS
Property tax history
+8.4%/yrLatest (2025): $5,057 · +0.5% YoY. Source: county tax records.
Cash-flow waterfall
monthlySold comps — $/sqft
last 12 mo · ≤1 miLoading sold comps…