 🏷️ Likely Rental
3524 NW 51st St #4 · Oklahoma City, OK
Flood risk 1/10 · Minimal
- FEMA flood zone
- X (unshaded)
- Chance of flooding over 30 yrs
- 0.0%
- Est. flood insurance / yr
- $507 – $1,088
Fire risk 1/10 · Minimal
- Est. fire insurance / yr
- $2,463 – $4,575
Heat risk 6/10 · Moderate
- Hot days now (above 107°F)
- 7 days/yr
- Hot days in 30 yrs
- 19 days/yr
Wind risk 2/10 · Minimal
- Chance of severe wind over 30 yrs
- 3.0%
Air-quality risk 2/10 · Minimal
- Unhealthy air days now
- 1 days/yr
- Unhealthy air days in 30 yrs
- 2 days/yr
Risk factors via First Street. Map © Google.
Why this score? — see what drove the B- grade
The composite is a weighted blend of 9 inputs, each scored 0–100. Each bar is that input's sub-score; the figure is the points it added to the 100-point composite (weight × sub-score).
- Cash flow +30.0/30.0
- DSCR +10.0/10.0
- 1% rule +9.9/10.0
- ARV discount +7.5/15.0
- Livability +4.0/5.0
- Rent growth +3.7/5.0
- Condition / age +2.5/5.0
- Schools +0.7/10.0
- Appreciation +0.0/10.0
$75,000
🖨 Deal sheet 📄 Offer letter ✓ Due diligence
Listing remarks MLS
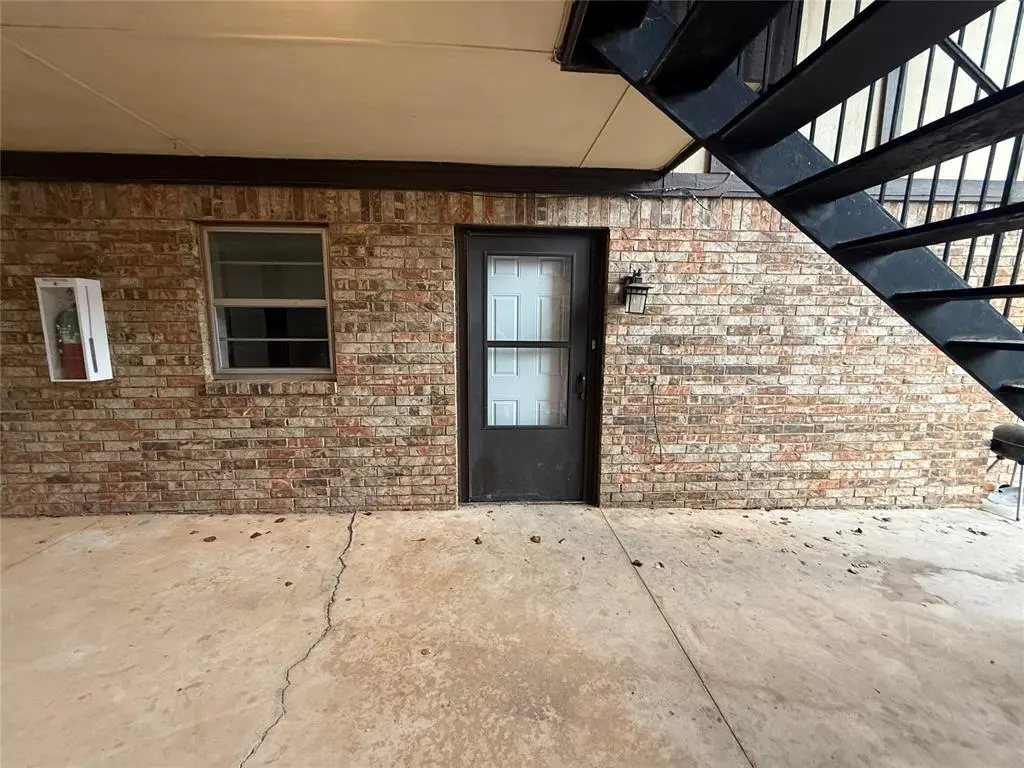
This 2 bedroom, 1.5 bath condo is located in a central city location. The ground-floor unit offers convenient access and includes one assigned parking space. The unit features a functional layout with natural light from multiple windows. The kitchen includes standard finishes and practical space for everyday use. New flooring has been installed throughout the unit. The bathroom configuration includes two vanity areas with a single shared tiled shower. The property offers a practical living option in a convenient location. The HOA fee is $335 per month and includes water and gas.
Key facts
- New flooring
- Natural light
- Two vanity areas
Tags
Neighborhood map
What this means for you Summary
Snapshot
- This is a 2-bed/2.0-bath condo listed at $75k.
Deal economics
- At list price, monthly cash flow is $366 ($4k/yr) — positive.
- The deal already cash-flows at list — no discount required.
- Meets the 1% rule at list price ($1k rent vs $75k).
- Recommended offer: $66k (12.0% below list) — sets the bar for market timing.
- Cap rate 12.1% vs local median 3.7% in Oklahoma City — top-decile yield for the area; either an underpriced asset or a hidden risk that comps aren't pricing in. Stress-test before assuming the spread holds.
Location & tenants
- Location reads 80/100 on livability (#3 in OK, #1,635 nationally) — a professional / high-income tenant draw. Strengths: amenities A+, commute A+, cost of living A+; Watch: schools F, crime F.
- Oklahoma City (urban): math 7% / reading 10% proficiency, ranked #254 of 270 in OK (top 94%) — low school quality limits family demand, transient renter base, plan for 1-2y turnover; 82% free/reduced lunch — lower-income household profile, screen leases tightly.
- Market conditions: Rents rising fast (+4.8%/yr); 192 active listings in the ZIP; 40 comparable units currently listed for rent nearby; rentals at typical pace (median 24d on market — plan ~3-4 weeks tenant-placement turnaround); 5,365 units permitted in Oklahoma County in 2024 (569 in 5+ unit buildings).
Forward outlook
- Local home prices are declining (-3.0%/yr); year-one equity from $519 of loan paydown is wiped out by about $2k of value loss. Plan a longer hold.
- Oklahoma County population projected at +41% by 2050 — long-run rental-demand tailwind backs the buy-and-hold thesis.
- At projected returns (-3.0% appreciation + 4.8% rent growth), your $21k cash investment doubles in ~6 years — after that, you're playing with house money.
Negotiation context
- It's been on market 130 days — a 12% lower offer ($66k) is reasonable based on typical stale-listing flexibility.
- 12 sale attempts since 25y ago with the ask held roughly flat each time — persistent listings suggest the price (not the market) is what's stuck; bring a comps-based counter.
Risks & watch-outs
- Climate carrying-cost: extreme-heat days projected 7→19/yr by 2055 (HVAC capex compounding) — expect insurance premiums to compound above CPI over the hold.
Questions for the listing agent
- It's been on market 130 days. Have you received any prior offers? Is the seller open to a 12% concession, seller financing, or rate buy-down credit?
- Built in 1976 — when were the roof, HVAC, electrical panel, plumbing, and water heater last replaced?
- What does the HOA fee cover, when was the last increase, and are there any pending special assessments or reserve-fund shortfalls?
- Any open or pending special assessments — roof, HVAC, plumbing, elevator, façade? What's the per-unit balance and payoff schedule, and is the seller paying it off at close or rolling it to the buyer?
- Why hasn't it sold? Are there any deal-killer items the seller is aware of (foundation, flood, title, zoning, code violations)?
- Is there a deadline driving the sale (1031 exchange, divorce, estate, relocation)? That informs how much negotiation room exists.
- Schools are F-rated, which usually means shorter tenancies and higher turnover. Who's the typical renter profile here, and what's been the actual vacancy rate?
- Crime grade is F in this area — have there been break-ins, vandalism, or insurance claims at this property in the last 3 years? What carrier currently insures it and at what premium?
- What's the average days-on-market for RENTAL listings here right now (not sales)? A rising rental-DOM trend means longer vacancies and softer asking-rent achievability than the comps imply.
- What's the recent tenant-quality profile in this submarket — average credit score on applications, eviction rate, late-payment / NSF rate, and stable-employment percentage? A property-management company in the area should have these aggregated.
- How much new apartment / multifamily construction is in the pipeline within 1–3 miles? Heavy new supply (>2% of stock underway) typically softens rents 12–24 months out; light construction supports rent growth.
Investment metrics
- 1% rule
- 1.49% ✓
- Cap rate
- 12.14%
- Cash-on-cash
- 20.90%
- DSCR
- 1.93
- GRM
- 5.6
CMA / ARV
- ARV (median comp)
- $163,455
- List price
- $75,000
- Delta
- -54.12%
- Verdict
- UNDERPRICED
- Comps
- 10 within 1.0 mi
Projected returns pro-forma
-3.0% appreciation · 4.8% rent growth · sell at horizon
- IRR
- 15.3%
- Equity multiple
- 1.63×
- Total profit
- $13,215
- Equity at exit
- $11,183
- IRR
- 25.3%
- Equity multiple
- 3.40×
- Total profit
- $50,343
- Equity at exit
- $6,485
Cash invested: $21,000 (down + closing). Projections, not guarantees.
Landlord ↔ Tenant lean methodology
- Overall (STATE)
- 83 Strongly Landlord-Friendly
- State Oklahoma
- 83 Strongly Landlord-Friendly · R+20
- County
- — inherits STATE
- City
- — inherits STATE
ZIP-level market 73112
- Rents YoY
- 4.8%
- Active inventory
- 192
- Price-to-rent
- 5.6×
Monthly cashflow live
- Estimated rent
- $1,118 high interval (Pro) →
- Mortgage (P&I)
- −$393
- Tax from tax record
- −$65 /mo · $784/yr
- Insurance
- −$31
- HOA
- −$28
- Vacancy / Maint / Mgmt
- −$235
- Net cashflow
- $366
Break-even live
UW: 25.0% down · 7.5% · 30yr · 1.5% tax · 5.0% vac · 8.0% maint · 8.0% mgmt
Financing live
Cash to close
- Down payment
- $18,750
- Closing costs
- $2,250
- Reserves months
- —
- Total cash needed
- —
Loan-product check · same deal, 3 products live
Conventional
25% down · 7.5% · 30yr
- Down + closing
- —
- Monthly P&I
- —
- Monthly cashflow
- —
- DSCR
- —
- Eligible?
- —
Personal DTI + credit; lowest rate.
DSCR
20% down · 8.5% · 30yr
- Down + closing
- —
- Monthly P&I
- —
- Monthly cashflow
- —
- DSCR
- —
- Eligible?
- —
No personal income docs; deal must DSCR.
Hard money
10% down · 12.0% · 12mo
- Down + closing
- —
- Monthly P&I
- —
- Monthly cashflow
- —
- DSCR
- —
- Eligible?
- —
Short-term bridge; refi at stabilization.
Rent comps 40 comps
| Address | Beds | Baths | Sqft | Rent | $/sqft | DOM | Units | Dist |
|---|---|---|---|---|---|---|---|---|
| 3541 NW 50th St Oklahoma City, OK | 2.0 | 1.0 | 980 | $949 | $0.97 | 43d | 1 | 0.06mi |
| 3801 NW 51st St Oklahoma City, OK | 2.0 | 1.0 | 818 | $1,100 | $1.34 | 23d | 1 | 0.30mi |
| 5509 N Independence Ave Oklahoma City, OK | 1.0 | 1.0 | 850 | $800 | $0.94 | 23d | 1 | 0.34mi |
| 5560 N Portland Ave Oklahoma City, OK | 1.0–2.0 | 1.0–2.0 | 955 | $1,249 | $1.31 | 1d | 50 | 0.35mi |
| 3160 Nimitz Blvd Oklahoma City, OK | 3.0 | 1.0 | 1068 | $1,195 | $1.12 | 44d | 1 | 0.46mi |
| 3100 Northwest Expy Oklahoma City, OK | 1.0–3.0 | 1.0–2.5 | 1029 | $1,066 | $1.04 | 1d | 57 | 0.63mi |
| 5113 N Brookline Ave Oklahoma City, OK | 2.0 | 1.0 | 1100 | $1,000 | $0.91 | 2d | 1 | 0.64mi |
| 5113 N Brookline Ave Oklahoma City, OK | 1.0 | 1.0 | 950 | $950 | $1.00 | 19d | 1 | 0.64mi |
| 5113 N Brookline Ave Oklahoma City, OK | 1.0 | 1.0 | 850 | $950 | $1.12 | 43d | 1 | 0.64mi |
| 5113 N Brookline Ave Oklahoma City, OK | 1.0 | 1.0 | 850 | $950 | $1.12 | 23d | 1 | 0.64mi |
| 3624 NW 42nd St Oklahoma City, OK | 1.0–2.0 | 1.0–2.0 | 1050 | $899 | $0.86 | 2d | 1 | 0.65mi |
| 4600 N Hamilton Dr Oklahoma City, OK | 2.0 | 1.0 | 708 | $1,050 | $1.48 | 43d | 1 | 0.67mi |
| 5505 N Brookline Ave Oklahoma City, OK | 1.0 | 1.0 | 750 | $1,469 | $1.96 | 23d | 1 | 0.69mi |
| 3221 NW 39th Ter Oklahoma City, OK | 3.0 | 1.0 | 1073 | $1,350 | $1.26 | 16d | 1 | 0.83mi |
| 4204 NW 51st St Unit 2 Oklahoma City, OK | 2.0 | 2.0 | 1005 | $1,495 | $1.49 | 23d | 1 | 0.85mi |
| 6000 N Brookline Ave #48 Oklahoma City, OK | 2.0 | 1.0 | 800 | $1,385 | $1.73 | 2d | 1 | 0.97mi |
| 6000 N Brookline Ave Oklahoma City, OK | 2.0 | 1.0 | 880 | $1,242 | $1.41 | 23d | 2 | 0.97mi |
| 5660 N May Ave Oklahoma City, OK | 1.0 | 1.0 | 780 | $860 | $1.10 | 23d | 1 | 0.98mi |
| 5660 N May Ave Oklahoma City, OK | 1.0 | 1.0 | 700 | $860 | $1.23 | 14d | 1 | 0.98mi |
| 5660 N May Ave Oklahoma City, OK | 1.0 | 1.0 | 700 | $860 | $1.23 | 43d | 1 | 0.98mi |
| 2720 NW 49th St Oklahoma City, OK | 2.0 | 1.0 | 786 | $1,200 | $1.53 | 2d | 1 | 0.99mi |
| 6100 N Brookline Ave Oklahoma City, OK | 2.0 | 2.0 | 1040 | $1,900 | $1.83 | 23d | 1 | 1.02mi |
| 6101 N May Ave Oklahoma City, OK | 1.0–2.0 | 1.0–2.0 | 814 | $1,070 | $1.31 | 4d | 6 | 1.03mi |
| 6105 N Brookline Ave #34 Oklahoma City, OK | 2.0 | 1.0 | 834 | $1,100 | $1.32 | 4d | 1 | 1.04mi |
| 2710 NW 57th St Oklahoma City, OK | 3.0 | 1.0 | 900 | $1,425 | $1.58 | 3d | 1 | 1.14mi |
| 5418 N Meridian Ave Oklahoma City, OK | 2.0 | 1.0–2.0 | 690 | $940 | $1.36 | 2d | 14 | 1.21mi |
| 3037 NW 65th St Oklahoma City, OK | 3.0 | 1.5 | 1063 | $1,495 | $1.41 | 43d | 1 | 1.22mi |
| 4200 N Meridian Ave Oklahoma City, OK | 1.0–2.0 | 1.0–2.0 | 801 | $1,289 | $1.61 | 4d | 29 | 1.24mi |
| 3615 N Tulsa Ave Oklahoma City, OK | 1.0 | 1.0 | 700 | $775 | $1.11 | 43d | 1 | 1.30mi |
| 3025 NW 67th St Oklahoma City, OK | 3.0 | 1.0 | 1071 | $1,350 | $1.26 | 43d | 1 | 1.34mi |
| 4020 N Meridian Ave Oklahoma City, OK | 2.0 | 1.0 | 700 | $849 | $1.21 | 23d | 1 | 1.35mi |
| 6300 N Meridian Ave Unit 6312-102 Oklahoma City, OK | 1.0 | 1.0 | 700 | $700 | $1.00 | 21d | 1 | 1.41mi |
| 6300 N Meridian Ave Unit 6306-201 Oklahoma City, OK | 1.0 | 1.0 | 700 | $700 | $1.00 | 4d | 1 | 1.41mi |
| 6300 N Meridian Ave Unit 6322-204 Oklahoma City, OK | 2.0 | 2.0 | 944 | $860 | $0.91 | 14d | 1 | 1.41mi |
| 3929 NW 32nd St Oklahoma City, OK | 3.0 | 1.0 | 1050 | $1,300 | $1.24 | 43d | 1 | 1.42mi |
| 6300 N Meridian Ave Oklahoma City, OK | 2.0 | 1.0–2.0 | 773 | $860 | $1.11 | 2d | 19 | 1.43mi |
| 2477 NW 40th St Oklahoma City, OK | 2.0 | 1.0 | 1011 | $1,150 | $1.14 | 43d | 1 | 1.43mi |
| 3912 NW 32nd St Oklahoma City, OK | 2.0 | 1.0 | 894 | $1,099 | $1.23 | 43d | 1 | 1.43mi |
| 2449 NW 42nd St Oklahoma City, OK | 3.0 | 1.0 | 1070 | $1,200 | $1.12 | 43d | 1 | 1.44mi |
| 3141 NW 32nd St Oklahoma City, OK | 2.0 | 1.0 | 1010 | $1,025 | $1.01 | 21d | 1 | 1.45mi |
HOA detail condo
- Monthly dues
- $28 · $336/yr
- Likely covers
- watergasparking
- Assessments
- None detected in remarks — confirm with the listing agent.
Listing history 43 events
-
2026-06-18days on market $75,000 Active 130 DOM
-
2026-06-17days on market $75,000 Active 129 DOM
-
2026-06-16days on market $75,000 Active 128 DOM
-
2026-06-15days on market $75,000 Active 127 DOM
-
2026-06-13days on market $75,000 Active 125 DOM
-
2026-06-09days on market $75,000 Active 121 DOM
-
2026-06-08days on market $75,000 Active 120 DOM
-
2026-06-07days on market $75,000 Active 119 DOM
-
2026-06-05days on market $75,000 Active 116 DOM
-
2026-06-03days on market $75,000 Active 115 DOM
-
2026-06-02days on market $75,000 Active 114 DOM
-
2026-06-01days on market $75,000 Active 113 DOM
-
2026-05-31days on market $75,000 Active 112 DOM
-
2026-04-15status Active 585-char remark
Show marketing remark (585 chars)
This 2 bedroom, 1.5 bath condo is located in a central city location. The ground-floor unit offers convenient access and includes one assigned parking space. The unit features a functional layout with natural light from multiple windows. The kitchen includes standard finishes and practical space for everyday use. New flooring has been installed throughout the unit. The bathroom configuration includes two vanity areas with a single shared tiled shower. The property offers a practical living option in a convenient location. The HOA fee is $335 per month and includes water and gas.
-
2026-03-24status Pending 585-char remark
Show marketing remark (585 chars)
This 2 bedroom, 1.5 bath condo is located in a central city location. The ground-floor unit offers convenient access and includes one assigned parking space. The unit features a functional layout with natural light from multiple windows. The kitchen includes standard finishes and practical space for everyday use. New flooring has been installed throughout the unit. The bathroom configuration includes two vanity areas with a single shared tiled shower. The property offers a practical living option in a convenient location. The HOA fee is $335 per month and includes water and gas.
-
2026-01-15$75,000 Active 585-char remark
Show marketing remark (585 chars)
This 2 bedroom, 1.5 bath condo is located in a central city location. The ground-floor unit offers convenient access and includes one assigned parking space. The unit features a functional layout with natural light from multiple windows. The kitchen includes standard finishes and practical space for everyday use. New flooring has been installed throughout the unit. The bathroom configuration includes two vanity areas with a single shared tiled shower. The property offers a practical living option in a convenient location. The HOA fee is $335 per month and includes water and gas.
-
2025-02-03historical
-
2025-01-02$80,000 Active
-
2024-05-07soldstatus $103,500
-
2022-09-06soldstatus $48,500
-
2022-09-02soldstatus $48,347 Sold
-
2022-07-28status Pending
-
2022-07-15$36,000 Active
-
2020-06-17soldstatus $30,000
-
2020-06-16soldstatus $30,000 Sold
-
2020-06-01status Pending
-
2020-05-26status Active
-
2020-05-13status Pending
-
2020-04-07status Active
-
2020-03-11status Pending
-
2020-01-08status Active
-
2019-12-31status Pending
-
2019-12-10$40,000 Active
-
2007-12-19historical
-
2006-06-26soldstatus $29,000
-
2006-06-23soldstatus $29,000
-
2006-05-22$30,900
-
2003-03-20$32,000
-
2003-01-27historical
-
2002-07-26$33,500
-
2002-01-01soldstatus $33,500
-
2001-06-19$35,000
-
1983-11-01soldstatus $43,500
ⓘ Source: listings_history table (triggers on properties + properties_extension) + one-shot
backfill from property_details.listing_events for pre-trigger history.
Tax reassessment forecast OK · Resets to sale price
- Current annual tax
- $784 · $65/mo
- Projected year-2 tax
- $784 · $65/mo
- Expected delta
- $0/yr ($0/mo · 0.0%)
ⓘ Screening estimate from a state-policy table — verify with the county assessor before closing.
Climate risk First Street
- Flood 1/10 Low FEMA zone X (unshaded) · 0% chance over 30 yrs
- Wildfire 1/10 Low
- Heat 6/10 Major 7 d/yr ≥107°F today · 19 d/yr by 30 yrs out
- Wind 2/10 Low 3% chance of damaging wind over 30 yrs
- Air quality 2/10 Low 1 unhealthy d/yr today · 2 by 30 yrs out
Nearby sold comps map
Loading sold comps map…
Walkable amenities ~0.75 mi
Loading nearby amenities…
Taxation est. · year 1
- Rental income
- $13,421
- − Mortgage interest
- −$4,201
- − Property taxes
- −$784
- − Insurance
- −$375
- − Repairs & maintenance
- −$1,074
- − Management
- −$1,074
- − HOA
- −$336
- − Depreciation
- −$2,182
- Taxable income
- $3,396
- Est. tax owed @ 24.0%
- −$815
- After-tax cash flow
- $3,573/yr
For passive investors: Depreciation is non-cash, so a rental often shows a tax loss while cash-flowing — sheltering income. Rental losses are passive: they offset passive income freely, and up to $25,000/yr can offset ordinary (W-2) income if you actively participate and your MAGI is under $100k (phasing out to $0 by $150k); unused losses carry forward. On sale, claimed depreciation is recaptured at up to 25%, and gains may owe capital-gains tax (a 1031 exchange can defer both). Figures are a year-1 estimate at your 24.0% rate — not tax advice; consult a CPA.
Schools (NCES district)
- District
- Oklahoma City
- NCES district ID
- 4022770
- Math proficiency
- 7% ▼ -5.00%
- Reading proficiency
- 10% ▼ -6.00%
- Median HH income
- $35,606
- Composite
- 7.0/100
- National rank
- #9970
- State rank
- #254 of 270 in OK
Livability — Oklahoma City
- Score
- 80/100
- State rank
- #3
- US rank
- #1635
Category grades
Schools grade is shown separately in the Schools card above.
Census & demographics
- Census place
- Oklahoma City, OK
- County
- Oklahoma County · 771,644 people
- City population
- 498,656
- Metro
- Oklahoma City, OK
- Population (ZIP)
- 30,372
- Household income
- $58,419
- Rent vs Own
- Severe rent burden
- 1555.0
Population outlook (Oklahoma County) Hauer SSP2
- Today (2025)
- 911,875 people
- By 2030
- 982,413 · +7.7%
- By 2040
- 1,130,468 · +24.0%
- By 2050
- 1,288,422 · +41.3%
- By 2075
- 1,711,482 · +87.7%
- By 2100
- 2,088,448 · +129.0%
Race, ethnicity, and origin ACS 2023
- Neighborhood character
- Diverse neighborhood (Simpson 0.65)
- Race & ethnicity
- White 55% Hispanic / Latino 18% Black 13% Two or more races 12% Asian 4% Native American 3%
- Hispanic origin (detail)
- Mexican 12%
- Common ancestry
- Italian 3% Lithuanian 2% Slovak 2%
- Foreign-born
- 12% · Canada, Vietnam, China
- Languages at home
- 82% English-only · Spanish 12% Other Indo-European 1% Vietnamese 1%
Political lean MEDSL · Oklahoma
- 2024 margin
- Toss-up / Even · D 48.0% · R 49.7% · Other 2.3%
- 2008→2024 swing
- +15.1pp toward D · 2008: -16.8pp · 2024: -1.7pp
- All cycles
- 2024: R+1.7 2020: R+1.1 2016: R+10.5 2012: R+16.7 2008: R+16.8
Not yet ingested
- Civics
- —
Market trends
- HPI YoY
- ▼ -283.17%
- Current HPI
- 253.682
- Rent YoY
- ▲ 4.80%
- Metro
- Oklahoma City, OK
- State GDP YoY
- ▲ 1.55%
- F500 in state
- 6
Industry mix (Fortune 500 HQ in OK)
| Industry | F500 HQs | Revenue |
|---|---|---|
| Energy | 3 | $48B |
|
||
Price history
+72.4% since first listed30 events — show timeline
- 2026-04-15 Relisted — MLSOK
- 2026-03-24 Pending — MLSOK
- 2026-01-15 Listed $75,000 MLSOK
- 2025-02-03 Listing Removed — MLSOK
- 2025-01-02 Listed $80,000 MLSOK
- 2024-05-07 Sold (Public Records) $103,500 Public Records
- 2022-09-06 Sold (Public Records) $48,500 Public Records
- 2022-09-02 Sold (MLS) $48,347 MLSOK
- 2022-07-28 Pending — MLSOK
- 2022-07-15 Listed $36,000 MLSOK
- 2020-06-17 Sold (Public Records) $30,000 Public Records
- 2020-06-16 Sold (MLS) $30,000 MLSOK
- 2020-06-01 Pending — MLSOK
- 2020-05-26 Relisted — MLSOK
- 2020-05-13 Pending — MLSOK
- 2020-04-07 Relisted — MLSOK
- 2020-03-11 Pending — MLSOK
- 2020-01-08 Relisted — MLSOK
- 2019-12-31 Pending — MLSOK
- 2019-12-10 Listed $40,000 MLSOK
- 2007-12-19 Listing Removed — MLSOK
- 2006-06-26 Sold (Public Records) $29,000 Public Records
- 2006-06-23 Sold (MLS) $29,000 MLSOK
- 2006-05-22 Listed $30,900 MLSOK
- 2003-03-20 Listed $32,000 MLSOK
- 2003-01-27 Listing Removed — MLSOK
- 2002-07-26 Listed $33,500 MLSOK
- 2002-01-01 Sold (MLS) $33,500 MLSOK
- 2001-06-19 Listed $35,000 MLSOK
- 1983-11-01 Sold (Public Records) $43,500 Public Records
Property tax history
+6.5%/yrLatest (2025): $784 · +9.6% YoY. Source: county tax records.
Cash-flow waterfall
monthlySold comps — $/sqft
last 12 mo · ≤1 miLoading sold comps…