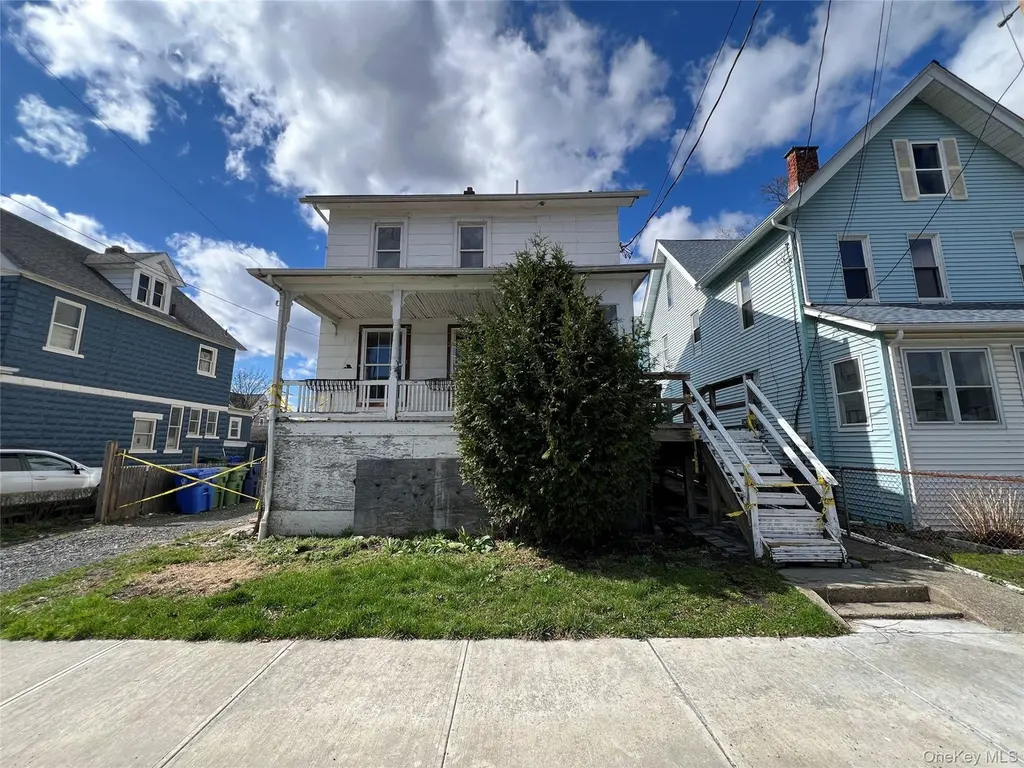
8 Grant St · Middletown, NY
Flood risk 6/10 · Moderate
- FEMA flood zone
- X (unshaded)
- Chance of flooding over 30 yrs
- 0.69%
- Est. flood insurance / yr
- $473 – $860
Fire risk 1/10 · Minimal
- Est. fire insurance / yr
- $691 – $1,283
Heat risk 5/10 · Moderate
- Hot days now (above 100°F)
- 7 days/yr
- Hot days in 30 yrs
- 15 days/yr
Wind risk 4/10 · Minor
- Chance of severe wind over 30 yrs
- 10.0%
Air-quality risk 2/10 · Minimal
- Unhealthy air days now
- 1 days/yr
- Unhealthy air days in 30 yrs
- 2 days/yr
Risk factors via First Street. Map © Google.
Why this score? — see what drove the B grade
The composite is a weighted blend of 9 inputs, each scored 0–100. Each bar is that input's sub-score; the figure is the points it added to the 100-point composite (weight × sub-score).
- Cash flow +25.3/30.0
- ARV discount +15.0/15.0
- DSCR +8.3/10.0
- 1% rule +7.4/10.0
- Rent growth +4.6/5.0
- Schools +4.2/10.0
- Livability +4.1/5.0
- Condition / age +2.5/5.0
- Appreciation +0.0/10.0
$210,000
🖨 Deal sheet (PDF) 📄 Offer letter ✓ Due diligence
Listing remarks MLS
Here's the opportunity investors have been waiting for. This two-story colonial offers the right buyer a full-renovation canvas with real upside. Generous room sizes, hardwood floors on the upper level, a covered front porch, and an oversized barn/garage outbuilding in the rear — features that support strong ARV whether you're flipping or holding for rental income. The home needs a complete renovation and is priced accordingly. No repairs — sold strictly as-is. ***AGENTS – MUST see confidential remarks and all MLS listing attachments for additional instructions***
Key facts
- Covered front porch
- Two story colonial
- Hardwood floors
Tags
Neighborhood map
What this means for you Summary
Snapshot
- This is a 3-bed/1.5-bath single-family listed at $210k.
Deal economics
- At list price, monthly cash flow is $477 ($6k/yr) — positive.
- The deal already cash-flows at list — no discount required.
- Meets the 1% rule at list price ($3k rent vs $210k).
- Recommended offer: $197k (6.0% below list) — sets the bar for market timing.
- Cap rate 9.0% vs local median 3.3% in Middletown — top-decile yield for the area; either an underpriced asset or a hidden risk that comps aren't pricing in. Stress-test before assuming the spread holds.
Location & tenants
- Location reads 82/100 on livability (#79 in NY, #1,219 nationally) — a professional / high-income tenant draw. Strengths: amenities A+, housing A+, health & safety A+; Watch: commute C-, schools D+.
- Middletown City School District (suburban): math 41% / reading 55% proficiency, ranked #411 of 590 in NY (top 70%) — families likely to look elsewhere, expect single-tenant / working-renter base with shorter leases; 61% free/reduced lunch — lower-income household profile, screen leases tightly.
- Market conditions: Rents rising fast (+8.2%/yr); 273 active listings in the ZIP; 16 comparable units currently listed for rent nearby; rentals lingering (median 45d on market — plan ~5-8 weeks vacancy on turnover, expect pricing pressure); 50% of comp listings sitting > 30 days — soft ceiling on asking rent; solid renter incomes; 1,746 units permitted in Orange County in 2024 (1,265 in 5+ unit buildings).
- This rent runs 36% of the median local income ($87k/yr) — at the standard rent-burdened threshold; future hikes will face affordability resistance.
Forward outlook
- Local home prices are declining (-3.0%/yr); year-one equity from $1k of loan paydown is wiped out by about $6k of value loss. Plan a longer hold.
- At projected returns (-3.0% appreciation + 8.0% rent growth), your $59k cash investment doubles in ~8 years — after that, you're playing with house money.
Negotiation context
- It's been on market 62 days — a 6% lower offer ($197k) is reasonable based on typical stale-listing flexibility.
- 3 sale attempts since 22y ago with the ask held roughly flat each time — persistent listings suggest the price (not the market) is what's stuck; bring a comps-based counter.
- Current owner paid $127k; list at $210k implies a 66% gain — meaningful room to come down on a strong offer.
Risks & watch-outs
- Watch-outs: built in 1890 — expect roof / HVAC / electrical / plumbing capex.
- Climate carrying-cost: major flood risk; extreme-heat days projected 7→15/yr by 2055 (HVAC capex compounding) — expect insurance premiums to compound above CPI over the hold.
Questions for the listing agent
- It's been on market 62 days. Have you received any prior offers? Is the seller open to a 6% concession, seller financing, or rate buy-down credit?
- Built in 1890 — when were the roof, HVAC, electrical panel, plumbing, and water heater last replaced?
- Why hasn't it sold? Are there any deal-killer items the seller is aware of (foundation, flood, title, zoning, code violations)?
- Is there a deadline driving the sale (1031 exchange, divorce, estate, relocation)? That informs how much negotiation room exists.
- Schools are D-rated, which usually means shorter tenancies and higher turnover. Who's the typical renter profile here, and what's been the actual vacancy rate?
- What's the average days-on-market for RENTAL listings here right now (not sales)? A rising rental-DOM trend means longer vacancies and softer asking-rent achievability than the comps imply.
- What's the recent tenant-quality profile in this submarket — average credit score on applications, eviction rate, late-payment / NSF rate, and stable-employment percentage? A property-management company in the area should have these aggregated.
- How much new for-sale + rental construction is in the pipeline within 1–3 miles? Heavy new supply typically softens prices + rents 12–24 months out; constrained supply supports both.
Investment metrics
- 1% rule
- 1.24% ✓
- Cap rate
- 9.02%
- Cash-on-cash
- 9.73%
- DSCR
- 1.43
- GRM
- 6.7
CMA / ARV
- ARV (median comp)
- $356,759
- List price
- $210,000
- Delta
- -41.14%
- Verdict
- UNDERPRICED
- Comps
- 20 within 1.0 mi
Show comp detail 12 sales within ~0.75 mi
| Address | Dist | Beds/Ba | Sqft | Sold | Price | $/sf | Match |
|---|---|---|---|---|---|---|---|
| 7-9 Wilbur Ave | 0.46mi | 3/1.0 | 1,922 (+2%) | 8mo | $300,000 | $156 | 67 |
| 15 Phillips St | 0.49mi | 4/2.0 (+1) | 1,901 (+1%) | 3mo | $510,000 | $268 | 67 |
| 29 Beacon St | 0.68mi | 3/1.0 | 1,886 (-0%) | 2mo | $407,500 | $216 | 65 |
| 28 Spring St | 0.22mi | 4/2.0 (+1) | 1,696 (-10%) | 2mo | $347,475 | $205 | 64 |
| 30 Wilson St | 0.49mi | 3/2.0 | 1,823 (-4%) | 8mo | $489,000 | $268 | 63 |
| 21 Ridge St | 0.40mi | 4/2.0 (+1) | 1,998 (+6%) | 3mo | $315,000 | $158 | 62 |
| 10 Myrtle Ave | 0.21mi | 3/2.0 | 1,608 (-15%) | 5mo | $315,000 | $196 | 60 |
| 11 Dolson | 0.56mi | 3/2.5 | 1,795 (-5%) | 4mo | $440,000 | $245 | 58 |
| 42 Genung St | 0.43mi | 4/3.0 (+1) | 1,728 (-9%) | 2mo | $425,000 | $246 | 53 |
| 38 Prospect St | 0.60mi | 4/1.0 (+1) | 1,790 (-5%) | 5mo | $365,700 | $204 | 52 |
| 47 Prince St | 0.43mi | 4/2.5 (+1) | 1,620 (-14%) | 6mo | $405,000 | $250 | 42 |
| 100 Excelsior Ave | 0.70mi | 3/2.5 | 1,643 (-13%) | 6mo | $401,000 | $244 | 37 |
Match score weights: distance 35% · size 25% · config 20% · recency 20%. Top-matched comps best support the ARV.
Projected returns pro-forma
-3.0% appreciation · 8.0% rent growth · sell at horizon
- IRR
- 4.3%
- Equity multiple
- 1.17×
- Total profit
- $10,257
- Equity at exit
- $31,312
- IRR
- 18.2%
- Equity multiple
- 2.89×
- Total profit
- $111,303
- Equity at exit
- $18,157
Cash invested: $58,800 (down + closing). Projections, not guarantees.
Landlord ↔ Tenant lean methodology
- Overall (STATE)
- 15 Strongly Tenant-Friendly
- State New York
- 15 Strongly Tenant-Friendly · D+10
- County
- — inherits STATE
- City
- — inherits STATE
ZIP-level market 10940
- Home prices YoY
- -18.7%
- Rents YoY
- 8.2%
- Active inventory
- 273
- Price-to-rent
- 6.7×
Monthly cashflow live
- Estimated rent
- $2,610 high interval (Pro) →
- Mortgage (P&I)
- −$1,101
- Tax from tax record
- −$396 /mo · $4,751/yr
- Insurance
- −$88
- HOA
- −$0
- Vacancy / Maint / Mgmt
- −$548
- Net cashflow
- $477
Break-even live
Sensitivity live
| Price | -10% $596 | -5% $536 | +0% $477 | +5% $417 | +10% $358 |
|---|---|---|---|---|---|
| Rent | -10% $271 | -5% $374 | +0% $477 | +5% $580 | +10% $683 |
| Rate | -1.0pp $583 | -0.5pp $530 | base $477 | +0.5pp $422 | +1.0pp $367 |
UW: 25.0% down · 7.5% · 30yr · 1.5% tax · 5.0% vac · 8.0% maint · 8.0% mgmt
Financing live
Cash to close
- Down payment
- $52,500
- Closing costs
- $6,300
- Reserves months
- —
- Total cash needed
- —
Loan-product check · same deal, 3 products live
Conventional
25% down · 7.5% · 30yr
- Down + closing
- —
- Monthly P&I
- —
- Monthly cashflow
- —
- DSCR
- —
- Eligible?
- —
Personal DTI + credit; lowest rate.
DSCR
20% down · 8.5% · 30yr
- Down + closing
- —
- Monthly P&I
- —
- Monthly cashflow
- —
- DSCR
- —
- Eligible?
- —
No personal income docs; deal must DSCR.
Hard money
10% down · 12.0% · 12mo
- Down + closing
- —
- Monthly P&I
- —
- Monthly cashflow
- —
- DSCR
- —
- Eligible?
- —
Short-term bridge; refi at stabilization.
Rent comps 16 comps
| Address | Beds | Baths | Sqft | Rent | $/sqft | DOM | Units | Dist |
|---|---|---|---|---|---|---|---|---|
| 8 Roberts St Unit 2-A Middletown, NY | 2.0 | 1.0 | 2132 | $2,000 | $0.94 | 24d | 1 | 0.17mi |
| 26 Washington St Unit 2 Middletown, NY | 3.0 | 1.0 | 2274 | $2,100 | $0.92 | 44d | 1 | 0.24mi |
| 90 Washington St Unit 92 Middletown, NY | 2.0 | 1.0 | 1600 | $2,500 | $1.56 | 24d | 1 | 0.32mi |
| 7 Mulberry St Middletown, NY | 4.0 | 1.5 | 1696 | $2,800 | $1.65 | 45d | 1 | 0.38mi |
| 132 Prospect Ave Middletown, NY | 3.0 | 1.0 | 1240 | $2,300 | $1.85 | 44d | 1 | 0.47mi |
| 26 Mill St Middletown, NY | 3.0 | 2.0 | 1300 | $2,600 | $2.00 | 24d | 1 | 0.51mi |
| 26 Mill St Unit 2 Middletown, NY | 3.0 | 2.0 | 1300 | $2,600 | $2.00 | 44d | 1 | 0.51mi |
| 14 Smith St Middletown, NY | 3.0 | 2.0 | 1852 | $3,600 | $1.94 | 15d | 1 | 0.52mi |
| 105 Woodlake Dr Middletown, NY | 2.0 | 2.5 | 2161 | $3,000 | $1.39 | 44d | 1 | 0.63mi |
| 52 Horton Ave Middletown, NY | 3.0 | 2.5 | 2340 | $3,000 | $1.28 | 44d | 1 | 0.66mi |
| 169 Excelsior Ave Middletown, NY | 3.0 | 1.5 | 1450 | $2,800 | $1.93 | 15d | 1 | 0.70mi |
| 30 Knapp Ave Middletown, NY | 2.0 | 1.0 | 1532 | $1,800 | $1.17 | 44d | 1 | 0.75mi |
| 39 Crescent Pl Middletown, NY | 3.0 | 1.0 | 1278 | $2,500 | $1.96 | 24d | 1 | 0.77mi |
| 184 Highland Ave Middletown, NY | 4.0 | 2.0 | 1486 | $3,500 | $2.36 | 24d | 1 | 0.94mi |
| 186 Highland Ave Unit 1 Middletown, NY | 3.0 | 2.0 | 2160 | $2,800 | $1.30 | 44d | 1 | 0.95mi |
| 225 Monhagen Ave Middletown, NY | 3.0 | 1.0 | 1466 | $2,700 | $1.84 | 15d | 1 | 1.49mi |
Listing history 24 events
-
2026-06-18status $210,000 Pending 62 DOM
-
2026-06-17days on market $210,000 Active 62 DOM
-
2026-06-16days on market $210,000 Active 61 DOM
-
2026-06-15days on market $210,000 Active 60 DOM
-
2026-06-14days on market $210,000 Active 58 DOM
-
2026-06-13days on market $210,000 Active 57 DOM
-
2026-06-10days on market $210,000 Active 55 DOM
-
2026-06-09days on market $210,000 Active 54 DOM
-
2026-06-08days on market $210,000 Active 53 DOM
-
2026-06-07days on market $210,000 Active 52 DOM
-
2026-06-05days on market $210,000 Active 49 DOM
-
2026-06-03days on market $210,000 Active 48 DOM
-
2026-06-02days on market $210,000 Active 47 DOM
-
2026-06-01days on market $210,000 Active 46 DOM
-
2026-05-31days on market $210,000 Active 45 DOM
-
2026-05-30days on market $210,000 Active 44 DOM
-
2026-04-19status Active 588-char remark
Show marketing remark (588 chars)
Here's the opportunity investors have been waiting for. This two-story colonial offers the right buyer a full-renovation canvas with real upside. Generous room sizes, hardwood floors on the upper level, a covered front porch, and an oversized barn/garage outbuilding in the rear — features that support strong ARV whether you're flipping or holding for rental income. The home needs a complete renovation and is priced accordingly. No repairs — sold strictly as-is. ***AGENTS – MUST see confidential remarks and all MLS listing attachments for additional instructions***
-
2026-04-09$210,000 Active 588-char remark
Show marketing remark (588 chars)
Here's the opportunity investors have been waiting for. This two-story colonial offers the right buyer a full-renovation canvas with real upside. Generous room sizes, hardwood floors on the upper level, a covered front porch, and an oversized barn/garage outbuilding in the rear — features that support strong ARV whether you're flipping or holding for rental income. The home needs a complete renovation and is priced accordingly. No repairs — sold strictly as-is. ***AGENTS – MUST see confidential remarks and all MLS listing attachments for additional instructions***
-
2008-03-05soldstatus $126,650
-
2006-01-24soldstatus $60,000
-
2005-12-22soldstatus $60,000 192-char remark
Show marketing remark (192 chars)
Priced to sell, excellent investment opportunity just needs a little cosmetic TLC. Roof, hot water heater and furnace all replaced within the last 5 yrs. 2nd Floor bathroom recently renovated.
-
2005-10-31price $99,900 192-char remark
Show marketing remark (192 chars)
Priced to sell, excellent investment opportunity just needs a little cosmetic TLC. Roof, hot water heater and furnace all replaced within the last 5 yrs. 2nd Floor bathroom recently renovated.
-
2005-10-31historical 192-char remark
Show marketing remark (192 chars)
Priced to sell, excellent investment opportunity just needs a little cosmetic TLC. Roof, hot water heater and furnace all replaced within the last 5 yrs. 2nd Floor bathroom recently renovated.
-
2004-10-19$60,000 192-char remark
Show marketing remark (192 chars)
Priced to sell, excellent investment opportunity just needs a little cosmetic TLC. Roof, hot water heater and furnace all replaced within the last 5 yrs. 2nd Floor bathroom recently renovated.
ⓘ Source: listings_history table (triggers on properties + properties_extension) + one-shot
backfill from property_details.listing_events for pre-trigger history.
Tax reassessment forecast NY · Partial reset (capped growth)
- Current annual tax
- $4,751 · $396/mo
- Projected year-2 tax
- $4,751 · $396/mo
- Expected delta
- $0/yr ($0/mo · 0.0%)
ⓘ Screening estimate from a state-policy table — verify with the county assessor before closing.
Climate risk First Street
- Flood 6/10 Major FEMA zone X (unshaded) · 69% chance over 30 yrs
- Wildfire 1/10 Low
- Heat 5/10 Major 7 d/yr ≥100°F today · 15 d/yr by 30 yrs out
- Wind 4/10 Moderate 10% chance of damaging wind over 30 yrs
- Air quality 2/10 Low 1 unhealthy d/yr today · 2 by 30 yrs out
Nearby sold comps map
Loading sold comps map…
Walkable amenities ~0.75 mi
Loading nearby amenities…
Taxation est. · year 1
- Rental income
- $31,314
- − Mortgage interest
- −$11,763
- − Property taxes
- −$4,751
- − Insurance
- −$1,050
- − Repairs & maintenance
- −$2,505
- − Management
- −$2,505
- − Depreciation
- −$6,109
- Taxable income
- $2,631
- Est. tax owed @ 24.0%
- −$632
- After-tax cash flow
- $5,091/yr
For passive investors: Depreciation is non-cash, so a rental often shows a tax loss while cash-flowing — sheltering income. Rental losses are passive: they offset passive income freely, and up to $25,000/yr can offset ordinary (W-2) income if you actively participate and your MAGI is under $100k (phasing out to $0 by $150k); unused losses carry forward. On sale, claimed depreciation is recaptured at up to 25%, and gains may owe capital-gains tax (a 1031 exchange can defer both). Figures are a year-1 estimate at your 24.0% rate — not tax advice; consult a CPA.
Schools (NCES district)
- District
- Middletown City School District
- NCES district ID
- 3619320
- Math proficiency
- 41% ▼ -2.00%
- Reading proficiency
- 55% ▲ 19.00%
- Median HH income
- $54,612
- Composite
- 41.52/100
- National rank
- #3453
- State rank
- #411 of 590 in NY
Livability — Middletown
- Score
- 82/100
- State rank
- #79
- US rank
- #1219
Category grades
Schools grade is shown separately in the Schools card above.
Census & demographics
- Census place
- Middletown, NY
- County
- Orange County · 267,004 people
- City population
- 68,033
- Metro
- Poughkeepsie-Newburgh-Middletown, NY
- Population (ZIP)
- 53,611
- Household income
- $87,080
- Rent vs Own
- Severe rent burden
- 1846.0
Population outlook (Orange County) Hauer SSP2
- Today (2025)
- 379,830 people
- By 2030
- 378,955 · -0.2%
- By 2040
- 375,444 · -1.2%
- By 2050
- 369,311 · -2.8%
- By 2075
- 354,233 · -6.7%
- By 2100
- 318,150 · -16.2%
Race, ethnicity, and origin ACS 2023
- Neighborhood character
- Highly diverse neighborhood (Simpson 0.70)
- Race & ethnicity
- White 39% Hispanic / Latino 32% Black 20% Two or more races 13% Asian 4% Native American 3%
- Hispanic origin (detail)
- Mexican 9% Puerto Rican 13% Dominican 3%
- Common ancestry
- Romanian 3% Italian 1% Iranian 1%
- Foreign-born
- 18% · Canada, China, Jamaica
- Languages at home
- 72% English-only · Spanish 21% Other Indo-European 2% Chinese 1%
Political lean MEDSL · Orange
- 2024 margin
- Lean R (+8.4) · D 45.8% · R 54.2%
- 2008→2024 swing
- -12.5pp toward R · 2008: 4.1pp · 2024: -8.4pp
- All cycles
- 2024: R+8.4 2020: R+0.2 2016: R+6.5 2012: D+5.2 2008: D+4.1
Not yet ingested
- Civics
- —
Market trends
- HPI YoY
- ▼ -71.68%
- Current HPI
- 311.5969
- Rent YoY
- ▲ 8.23%
- Metro
- Poughkeepsie-Newburgh-Middletown, NY
- State GDP YoY
- ▲ 2.60%
- F500 in state
- 92
Industry mix (Fortune 500 HQ in NY)
| Industry | F500 HQs | Revenue |
|---|---|---|
| Financial Services | 10 | $950B |
|
||
| Consumer Goods | 9 | $162B |
|
||
| Insurance | 4 | $225B |
|
||
| Telecommunications | 2 | $144B |
|
||
| Pharmaceuticals | 2 | $112B |
|
||
| Media / Entertainment | 2 | $69B |
|
||
Price history
+250.0% since first listed8 events — show timeline
- 2026-04-19 Relisted — OneKey® MLS as Distributed by MLS Grid
- 2026-04-09 Listed $210,000 OneKey® MLS as Distributed by MLS Grid
- 2008-03-05 Sold (Public Records) $126,650 Public Records
- 2006-01-24 Sold (Public Records) $60,000 Public Records
- 2005-12-22 Sold (MLS) $60,000 HGMLS
- 2005-10-31 Delisted — HGMLS
- 2005-10-31 Price Changed $99,900 HGMLS
- 2004-10-19 Listed $60,000 HGMLS
Property tax history
+2.8%/yrLatest (2025): $4,751 · -1.0% YoY. Source: county tax records.
Cash-flow waterfall
monthlySold comps — $/sqft
last 12 mo · ≤1 miLoading sold comps…