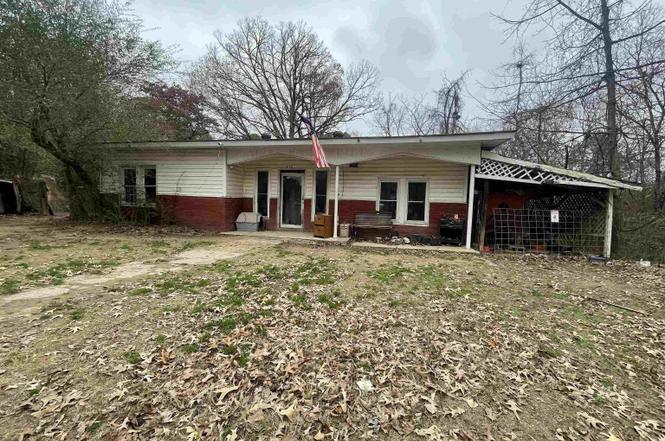
410 Lum Ave · Mena, AR
Flood risk 1/10 · Minimal
- FEMA flood zone
- —
- Chance of flooding over 30 yrs
- 0.0%
- Est. flood insurance / yr
- —
Fire risk 4/10 · Minor
- Est. fire insurance / yr
- $1,499 – $2,785
Heat risk 5/10 · Moderate
- Hot days now (above 108°F)
- 7 days/yr
- Hot days in 30 yrs
- 20 days/yr
Wind risk 2/10 · Minimal
- Chance of severe wind over 30 yrs
- 3.0%
Air-quality risk 2/10 · Minimal
- Unhealthy air days now
- 1 days/yr
- Unhealthy air days in 30 yrs
- 1 days/yr
Risk factors via First Street. Map © Google.
Why this score? — see what drove the B grade
The composite is a weighted blend of 9 inputs, each scored 0–100. Each bar is that input's sub-score; the figure is the points it added to the 100-point composite (weight × sub-score).
- Cash flow +30.0/30.0
- DSCR +10.0/10.0
- 1% rule +9.8/10.0
- ARV discount +7.5/15.0
- Appreciation +4.4/10.0
- Schools +3.3/10.0
- Livability +3.2/5.0
- Rent growth +2.5/5.0
- Condition / age +2.5/5.0
$79,900
🖨 Deal sheet 📄 Offer letter ✓ Due diligence
Listing remarks
Fixer Upper Opportunity on . 82 Acres! This small fixer upper sits on a solid cement slab and offers a great opportunity to create your ideal home or next investment property. This property features . 82 acres of usable, cleared land with of room to expand, garden or enjoy the quiet country-like setting. This home is in need repairs and updates, making it the perfect project for those looking to add value and customize to their tastes. With a peaceful rural fee and the convenience of town, this property offers both potential and location.
Key facts
- .82 acres
- Peaceful rural feel
- Usable cleared land
Tags
Property features AI
Finance
- Financial info: Financing available: conventional loan or cash
Exterior
- Parking: Carport for 1 car
- Security: Video surveillance
- Utilities: Public sewer; Public water; Municipal electric service (Entergy); Natural gas; Private telephone service
- Home design: Brick and frame combination exterior; Located inside city limits; Corner lot, level with some downslope; Not in a subdivision
- Construction: Slab foundation; Architectural shingle roof
- Exterior features: Partially fenced yard; Video surveillance; Paved road access
Interior
- Kitchen: Free-standing stove
- Bedrooms: Includes den/family room and laundry as additional rooms
- Flooring: Wood flooring; Concrete flooring
- Bathrooms: 1 full bathroom
- Heating & cooling: Window air-conditioning units; Gas space heater
- Interior features: Dryer connection (electric); Electric water heater; Sheetrock and paneling walls/ceilings
- Laundry & utility: Laundry room; Dryer connection (electric)
Neighborhood map
What this means for you Summary
Snapshot
- This is a 3-bed/1.0-bath single-family listed at $80k.
Deal economics
- At list price, monthly cash flow is $385 ($5k/yr) — positive.
- The deal already cash-flows at list — no discount required.
- Meets the 1% rule at list price ($1k rent vs $80k).
- Recommended offer: $70k (12.0% below list) — sets the bar for market timing.
- Cap rate 12.1% vs local median 3.1% in Mena — top-decile yield for the area; either an underpriced asset or a hidden risk that comps aren't pricing in. Stress-test before assuming the spread holds.
Location & tenants
- Location reads 65/100 on livability (#142 in AR) — a middle-class / working-renter tenant base. Strengths: cost of living A+, housing A+, health & safety A+; Watch: crime D, amenities F, commute F.
- Mena School District (rural): math 42% / reading 38% proficiency, ranked #70 of 238 in AR (top 29%) — families likely to look elsewhere, expect single-tenant / working-renter base with shorter leases.
- Zoned schools: Mena High School (math 25% / reading 39%, grade F, #119 of 292 statewide, top 43%, 498 students, 53% FRL) — zoned schools at 53% FRL track the district average.
- Market conditions: 204 active listings in the ZIP; 4 units permitted in Polk County in 2024 (0 in 5+ unit buildings).
Forward outlook
- Local home prices are declining (-1.2%/yr); year-one equity from $552 of loan paydown is wiped out by about $946 of value loss. Plan a longer hold.
- Polk County population projected at -15% by 2050 — secular population decline; favor cash flow + early exit over multi-decade hold.
- At projected returns (-1.2% appreciation + 3.0% rent growth), your $22k cash investment doubles in ~5 years — after that, you're playing with house money.
Negotiation context
- It's been on market 179 days — a 12% lower offer ($70k) is reasonable based on typical stale-listing flexibility.
Risks & watch-outs
- Watch-outs: built in 1950 — expect roof / HVAC / electrical / plumbing capex.
- Climate carrying-cost: extreme-heat days projected 7→20/yr by 2055 (HVAC capex compounding) — expect insurance premiums to compound above CPI over the hold.
Questions for the listing agent
- It's been on market 179 days. Have you received any prior offers? Is the seller open to a 12% concession, seller financing, or rate buy-down credit?
- Built in 1950 — when were the roof, HVAC, electrical panel, plumbing, and water heater last replaced?
- Why hasn't it sold? Are there any deal-killer items the seller is aware of (foundation, flood, title, zoning, code violations)?
- Is there a deadline driving the sale (1031 exchange, divorce, estate, relocation)? That informs how much negotiation room exists.
- Schools are D-rated, which usually means shorter tenancies and higher turnover. Who's the typical renter profile here, and what's been the actual vacancy rate?
- Crime grade is D in this area — have there been break-ins, vandalism, or insurance claims at this property in the last 3 years? What carrier currently insures it and at what premium?
- What's the average days-on-market for RENTAL listings here right now (not sales)? A rising rental-DOM trend means longer vacancies and softer asking-rent achievability than the comps imply.
- What's the recent tenant-quality profile in this submarket — average credit score on applications, eviction rate, late-payment / NSF rate, and stable-employment percentage? A property-management company in the area should have these aggregated.
- How much new for-sale + rental construction is in the pipeline within 1–3 miles? Heavy new supply typically softens prices + rents 12–24 months out; constrained supply supports both.
Investment metrics
- 1% rule
- 1.48% ✓
- Cap rate
- 12.07%
- Cash-on-cash
- 20.63%
- DSCR
- 1.92
- GRM
- 5.6
CMA / ARV
- ARV (on-the-fly)
- $168,597
- Comps found
- 10
Show comp detail 10 sales within ~0.75 mi
| Address | Dist | Beds/Ba | Sqft | Sold | Price | $/sf | Match |
|---|---|---|---|---|---|---|---|
| 1407 Mena St | 0.14mi | 3/2.0 | 1,363 (-5%) | 4mo | $175,000 | $128 | 77 |
| 200 Ridge St | 0.34mi | 2/2.0 (-1) | 1,318 (-8%) | 5mo | $135,000 | $102 | 56 |
| 1607 Faye St | 0.58mi | 3/2.0 | 1,503 (+4%) | 7mo | $220,000 | $146 | 56 |
| 304 Ridge Ave | 0.41mi | 3/1.5 | 1,321 (-8%) | 23mo | $168,000 | $127 | 46 |
| 1404 Faye St | 0.60mi | 4/1.5 (+1) | 1,494 (+4%) | 17mo | $135,000 | $90 | 45 |
| 909 S Eighth St | 0.71mi | 3/1.0 | 1,602 (+11%) | 11mo | $32,000 | $20 | 39 |
| 308 Jenny Lind Dr | 0.70mi | 3/2.0 | 1,621 (+12%) | 6mo | $190,000 | $117 | 37 |
| 1001 Ninth St | 0.69mi | 2/1.0 (-1) | 1,256 (-13%) | 12mo | $150,000 | $119 | 31 |
| 1410 Ransom Rd | 0.64mi | 3/1.0 | 1,252 (-13%) | 22mo | $100,000 | $80 | 30 |
| 708 Meadowbrook | 0.71mi | 3/1.5 | 1,255 (-13%) | 20mo | $120,000 | $96 | 26 |
Match score weights: distance 35% · size 25% · config 20% · recency 20%. Top-matched comps best support the ARV.
Projected returns pro-forma
-1.18% appreciation · 3.0% rent growth · sell at horizon
- IRR
- 17.7%
- Equity multiple
- 1.80×
- Total profit
- $17,832
- Equity at exit
- $18,579
- IRR
- 23.6%
- Equity multiple
- 3.37×
- Total profit
- $52,969
- Equity at exit
- $18,913
Cash invested: $22,372 (down + closing). Projections, not guarantees.
Landlord ↔ Tenant lean methodology
- Overall (STATE)
- 92 Strongly Landlord-Friendly
- State Arkansas
- 92 Strongly Landlord-Friendly · R+14
- County
- — inherits STATE
- City
- — inherits STATE
ZIP-level market 71953
- Home prices YoY
- -0.4%
- Active inventory
- 204
- Price-to-rent
- 5.6×
Monthly cashflow live
- Estimated rent
- $1,186 medium interval (Pro) →
- Mortgage (P&I)
- −$419
- Tax est. 1.5%
- −$100 /mo · $1,198/yr
- Insurance
- −$33
- HOA
- −$0
- Vacancy / Maint / Mgmt
- −$249
- Net cashflow
- $385
Break-even live
UW: 25.0% down · 7.5% · 30yr · 1.5% tax · 5.0% vac · 8.0% maint · 8.0% mgmt
Financing live
Cash to close
- Down payment
- $19,975
- Closing costs
- $2,397
- Reserves months
- —
- Total cash needed
- —
Loan-product check · same deal, 3 products live
Conventional
25% down · 7.5% · 30yr
- Down + closing
- —
- Monthly P&I
- —
- Monthly cashflow
- —
- DSCR
- —
- Eligible?
- —
Personal DTI + credit; lowest rate.
DSCR
20% down · 8.5% · 30yr
- Down + closing
- —
- Monthly P&I
- —
- Monthly cashflow
- —
- DSCR
- —
- Eligible?
- —
No personal income docs; deal must DSCR.
Hard money
10% down · 12.0% · 12mo
- Down + closing
- —
- Monthly P&I
- —
- Monthly cashflow
- —
- DSCR
- —
- Eligible?
- —
Short-term bridge; refi at stabilization.
Listing history 16 events
-
2026-06-19days on market $79,900 Active 179 DOM
-
2026-06-18days on market $79,900 Active 178 DOM
-
2026-06-17days on market $79,900 Active 177 DOM
-
2026-06-16days on market $79,900 Active 176 DOM
-
2026-06-15days on market $79,900 Active 175 DOM
-
2026-06-14days on market $79,900 Active 173 DOM
-
2026-06-12days on market $79,900 Active 172 DOM
-
2026-06-09days on market $79,900 Active 169 DOM
-
2026-06-08days on market $79,900 Active 168 DOM
-
2026-06-07days on market $79,900 Active 167 DOM
-
2026-06-04days on market $79,900 Active 163 DOM
-
2026-06-02days on market $79,900 Active 162 DOM
-
2026-06-01days on market $79,900 Active 161 DOM
-
2026-05-31days on market $79,900 Active 160 DOM
-
2026-05-31days on market $79,900 Active 159 DOM
-
2025-12-22$79,900 New Listing
ⓘ Source: listings_history table (triggers on properties + properties_extension) + one-shot
backfill from property_details.listing_events for pre-trigger history.
Climate risk First Street
- Flood 1/10 Low 0% chance over 30 yrs
- Wildfire 4/10 Moderate
- Heat 5/10 Major 7 d/yr ≥108°F today · 20 d/yr by 30 yrs out
- Wind 2/10 Low 3% chance of damaging wind over 30 yrs
- Air quality 2/10 Low 1 unhealthy d/yr today · 1 by 30 yrs out
Nearby sold comps map
Loading sold comps map…
Walkable amenities ~0.75 mi
Loading nearby amenities…
Taxation est. · year 1
- Rental income
- $14,229
- − Mortgage interest
- −$4,476
- − Property taxes
- −$1,198
- − Insurance
- −$400
- − Repairs & maintenance
- −$1,138
- − Management
- −$1,138
- − Depreciation
- −$2,324
- Taxable income
- $3,555
- Est. tax owed @ 24.0%
- −$853
- After-tax cash flow
- $3,762/yr
For passive investors: Depreciation is non-cash, so a rental often shows a tax loss while cash-flowing — sheltering income. Rental losses are passive: they offset passive income freely, and up to $25,000/yr can offset ordinary (W-2) income if you actively participate and your MAGI is under $100k (phasing out to $0 by $150k); unused losses carry forward. On sale, claimed depreciation is recaptured at up to 25%, and gains may owe capital-gains tax (a 1031 exchange can defer both). Figures are a year-1 estimate at your 24.0% rate — not tax advice; consult a CPA.
Schools (NCES district)
- District
- Mena School District
- NCES district ID
- 0509750
- Math proficiency
- 42% ▼ -9.00%
- Reading proficiency
- 38% ▼ -9.00%
- Median HH income
- $32,941
- Composite
- 32.88/100
- National rank
- #5607
- State rank
- #70 of 238 in AR
Livability — Mena
- Score
- 65/100
- State rank
- #142
- US rank
- #12615
Category grades
Schools grade is shown separately in the Schools card above.
Census & demographics
- Census place
- Mena, AR
- Population (ZIP)
- 13,412
Population outlook (Polk County) Hauer SSP2
- Today (2025)
- 19,065 people
- By 2030
- 18,369 · -3.7%
- By 2040
- 17,156 · -10.0%
- By 2050
- 16,177 · -15.1%
- By 2075
- 14,642 · -23.2%
- By 2100
- 13,020 · -31.7%
Race, ethnicity, and origin ACS 2023
- Neighborhood character
- Predominantly White (91%)
- Race & ethnicity
- White 91% Two or more races 5% Hispanic / Latino 3% Native American 1%
- Common ancestry
- Lithuanian 3% Slovak 2% Iranian 1%
- Foreign-born
- 2% · Canada
- Languages at home
- 98% English-only · Spanish 1% German/W. Germanic 1%
Political lean MEDSL · Polk
- 2024 margin
- Solid R (+70.5) · D 13.8% · R 84.3% · Other 1.9%
- 2008→2024 swing
- -24.7pp toward R · 2008: -45.8pp · 2024: -70.5pp
- All cycles
- 2024: R+70.5 2020: R+68.2 2016: R+66.4 2012: R+56.9 2008: R+45.8
Not yet ingested
- Civics
- —
Market trends
- HPI YoY
- ▼ -1.18%
- Current HPI
- 278.2854
- Rent YoY
- —
- Metro
- —
- State GDP YoY
- ▲ 3.80%
- F500 in state
- 10
Industry mix (Fortune 500 HQ in AR)
| Industry | F500 HQs | Revenue |
|---|---|---|
| Retail | 1 | $681B |
|
||
| Food / Agriculture | 1 | $53B |
|
||
| Retail / Energy | 1 | $22B |
|
||
| Transportation / Logistics | 1 | $12B |
|
||
| Energy | 1 | $4B |
|
||
Price history
1 event — show timeline
- 2025-12-22 Listed $79,900 CARMLS
Property tax history
+11.2%/yrLatest (2025): $14 · +0.0% YoY. Source: county tax records.
Cash-flow waterfall
monthlySold comps — $/sqft
last 12 mo · ≤1 miLoading sold comps…