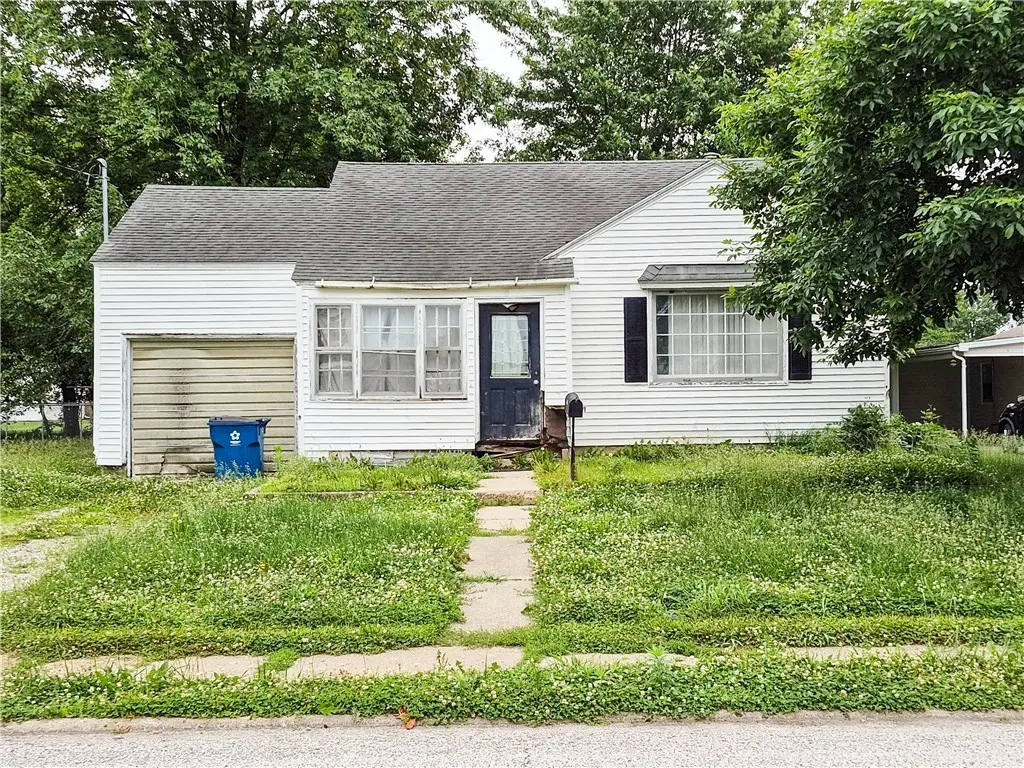
1307 N Cross St · Robinson, IL
Flood risk 1/10 · Minimal
- FEMA flood zone
- X (unshaded)
- Chance of flooding over 30 yrs
- 0.0%
- Est. flood insurance / yr
- $473 – $860
Fire risk 1/10 · Minimal
- Est. fire insurance / yr
- $804 – $1,492
Heat risk 4/10 · Minor
- Hot days now (above 108°F)
- 7 days/yr
- Hot days in 30 yrs
- 19 days/yr
Wind risk 2/10 · Minimal
- Chance of severe wind over 30 yrs
- 1.0%
Air-quality risk 2/10 · Minimal
- Unhealthy air days now
- 0 days/yr
- Unhealthy air days in 30 yrs
- 1 days/yr
Risk factors via First Street. Map © Google.
Why this score? — see what drove the B- grade
The composite is a weighted blend of 9 inputs, each scored 0–100. Each bar is that input's sub-score; the figure is the points it added to the 100-point composite (weight × sub-score).
- Cash flow +30.0/30.0
- 1% rule +10.0/10.0
- DSCR +10.0/10.0
- ARV discount +7.5/15.0
- Livability +3.2/5.0
- Rent growth +2.5/5.0
- Condition / age +2.5/5.0
- Schools +2.4/10.0
- Appreciation +0.0/10.0
$19,500
🖨 Deal sheet 📄 Offer letter ✓ Due diligence
Listing remarks
2 Bed, 2 Bath home with attached garage offering 928 square feet of potential! Great investment or flip opportunity for investors or buyers looking to add their personal touch. Property is being sold as-is. Convenient layout with solid possibilities for renovation and value-add improvements. Don’t miss your chance to turn this property into something special!
Key facts
- 8,276 sq ft lot
- Garage
- Built 1946
Property features AI
Exterior
- Parking: Attached garage (1 car)
- Utilities: Public water; Public sewer
- Home design: Single-family residence; One story
- Construction: Vinyl siding construction
- Exterior features: Gravel road access; Asphalt roof
Interior
- Kitchen: Appliances: Other
- Bedrooms: 5 total rooms (includes bedrooms and living spaces)
- Bathrooms: 2 full bathrooms
- Heating & cooling: Natural gas heating; Central air conditioning
- Interior features: Gas water heater; Unfinished full basement
- Laundry & utility: Basement utility space
Neighborhood map
What this means for you Summary
Snapshot
- This is a 2-bed/2.0-bath single-family listed at $20k.
Deal economics
- At list price, monthly cash flow is $497 ($6k/yr) — positive.
- The deal already cash-flows at list — no discount required.
- Meets the 1% rule at list price ($800 rent vs $20k).
- Recommended offer: $19k (1.5% below list) — sets the bar for market timing.
Location & tenants
- Location reads 63/100 on livability (#761 in IL) — a middle-class / working-renter tenant base. Strengths: cost of living A+, housing A+; Watch: employment D+, schools F, amenities F.
- Robinson CUSD 2 (town): math 21% / reading 36% proficiency, ranked #271 of 620 in IL (top 44%) — low school quality limits family demand, transient renter base, plan for 1-2y turnover.
- Market conditions: 21 active listings in the ZIP; 1 comparable units currently listed for rent nearby; 14 units permitted in Crawford County in 2024 (0 in 5+ unit buildings).
Forward outlook
- Local home prices are declining (-3.0%/yr); year-one equity from $135 of loan paydown is wiped out by about $585 of value loss. Plan a longer hold.
- Crawford County population projected at -16% by 2050 — secular population decline; favor cash flow + early exit over multi-decade hold.
- At projected returns (-3.0% appreciation + 3.0% rent growth), your $5k cash investment doubles in ~1 year — after that, you're playing with house money.
Negotiation context
- It's been on market 22 days — a 2% lower offer ($19k) is reasonable based on typical stale-listing flexibility.
Risks & watch-outs
- Watch-outs: built in 1946 — expect roof / HVAC / electrical / plumbing capex.
Questions for the listing agent
- Built in 1946 — when were the roof, HVAC, electrical panel, plumbing, and water heater last replaced?
- Is there a deadline driving the sale (1031 exchange, divorce, estate, relocation)? That informs how much negotiation room exists.
- Schools are F-rated, which usually means shorter tenancies and higher turnover. Who's the typical renter profile here, and what's been the actual vacancy rate?
- What's the average days-on-market for RENTAL listings here right now (not sales)? A rising rental-DOM trend means longer vacancies and softer asking-rent achievability than the comps imply.
- What's the recent tenant-quality profile in this submarket — average credit score on applications, eviction rate, late-payment / NSF rate, and stable-employment percentage? A property-management company in the area should have these aggregated.
- How much new for-sale + rental construction is in the pipeline within 1–3 miles? Heavy new supply typically softens prices + rents 12–24 months out; constrained supply supports both.
Investment metrics
- 1% rule
- 4.10% ✓
- Cap rate
- 36.89%
- Cash-on-cash
- 109.28%
- DSCR
- 5.86
- GRM
- 2.0
CMA / ARV
- ARV (on-the-fly)
- $84,448
- Comps found
- 4
Show comp detail 4 sales within ~0.75 mi
| Address | Dist | Beds/Ba | Sqft | Sold | Price | $/sf | Match |
|---|---|---|---|---|---|---|---|
| 516 N Howard St | 0.43mi | 2/1.0 | 908 (-2%) | 4mo | $20,000 | $22 | 69 |
| 1313 N Cross St | 0.02mi | 2/1.0 | 816 (-12%) | 10mo | $84,000 | $103 | 67 |
| 404 N Jackson St | 0.70mi | 2/1.0 | 936 (+1%) | 0mo | $85,000 | $91 | 62 |
| 903 N Lincoln St | 0.26mi | 2/1.0 | 840 (-10%) | 19mo | $75,000 | $89 | 52 |
Match score weights: distance 35% · size 25% · config 20% · recency 20%. Top-matched comps best support the ARV.
Projected returns pro-forma
-3.0% appreciation · 3.0% rent growth · sell at horizon
- IRR
- —
- Equity multiple
- 6.22×
- Total profit
- $28,522
- Equity at exit
- $2,908
- IRR
- —
- Equity multiple
- 13.03×
- Total profit
- $65,665
- Equity at exit
- $1,686
Cash invested: $5,460 (down + closing). Projections, not guarantees.
Landlord ↔ Tenant lean methodology
- Overall (STATE)
- 43 Moderately Tenant-Leaning
- State Illinois
- 43 Moderately Tenant-Leaning · D+7
- County
- — inherits STATE
- City
- — inherits STATE
ZIP-level market 62454
- Active inventory
- 21
- Price-to-rent
- 2.0×
Monthly cashflow live
- Estimated rent
- $800 medium interval (Pro) →
- Mortgage (P&I)
- −$102
- Tax est. 1.5%
- −$24 /mo · $292/yr
- Insurance
- −$8
- HOA
- −$0
- Vacancy / Maint / Mgmt
- −$168
- Net cashflow
- $497
Break-even live
UW: 25.0% down · 7.5% · 30yr · 1.5% tax · 5.0% vac · 8.0% maint · 8.0% mgmt
Financing live
Cash to close
- Down payment
- $4,875
- Closing costs
- $585
- Reserves months
- —
- Total cash needed
- —
Loan-product check · same deal, 3 products live
Conventional
25% down · 7.5% · 30yr
- Down + closing
- —
- Monthly P&I
- —
- Monthly cashflow
- —
- DSCR
- —
- Eligible?
- —
Personal DTI + credit; lowest rate.
DSCR
20% down · 8.5% · 30yr
- Down + closing
- —
- Monthly P&I
- —
- Monthly cashflow
- —
- DSCR
- —
- Eligible?
- —
No personal income docs; deal must DSCR.
Hard money
10% down · 12.0% · 12mo
- Down + closing
- —
- Monthly P&I
- —
- Monthly cashflow
- —
- DSCR
- —
- Eligible?
- —
Short-term bridge; refi at stabilization.
Rent comps 1 comps
| Address | Beds | Baths | Sqft | Rent | $/sqft | DOM | Units | Dist |
|---|---|---|---|---|---|---|---|---|
| 205 S Walters St Robinson, IL | 2.0 | 1.0 | 950 | $800 | $0.84 | 43d | 1 | 0.97mi |
Listing history 16 events
-
2026-06-18days on market $19,500 Active 22 DOM
-
2026-06-17days on market $19,500 Active 21 DOM
-
2026-06-16days on market $19,500 Active 20 DOM
-
2026-06-15days on market $19,500 Active 19 DOM
-
2026-06-13days on market $19,500 Active 17 DOM
-
2026-06-12days on market $19,500 Active 16 DOM
-
2026-06-09days on market $19,500 Active 13 DOM
-
2026-06-08days on market $19,500 Active 12 DOM
-
2026-06-07days on market $19,500 Active 11 DOM
-
2026-06-07days on market $19,500 Active 10 DOM
-
2026-06-04days on market $19,500 Active 7 DOM
-
2026-06-02days on market $19,500 Active 6 DOM
-
2026-06-01days on market $19,500 Active 5 DOM
-
2026-05-31days on market $19,500 Active 4 DOM
-
2026-05-31days on market $19,500 Active 3 DOM
-
2026-05-27$19,500 Active
ⓘ Source: listings_history table (triggers on properties + properties_extension) + one-shot
backfill from property_details.listing_events for pre-trigger history.
Climate risk First Street
- Flood 1/10 Low FEMA zone X (unshaded) · 0% chance over 30 yrs
- Wildfire 1/10 Low
- Heat 4/10 Moderate 7 d/yr ≥108°F today · 19 d/yr by 30 yrs out
- Wind 2/10 Low 100% chance of damaging wind over 30 yrs
- Air quality 2/10 Low 0 unhealthy d/yr today · 1 by 30 yrs out
Nearby sold comps map
Loading sold comps map…
Walkable amenities ~0.75 mi
Loading nearby amenities…
Taxation est. · year 1
- Rental income
- $9,600
- − Mortgage interest
- −$1,092
- − Property taxes
- −$292
- − Insurance
- −$98
- − Repairs & maintenance
- −$768
- − Management
- −$768
- − Depreciation
- −$567
- Taxable income
- $6,014
- Est. tax owed @ 24.0%
- −$1,443
- After-tax cash flow
- $4,523/yr
For passive investors: Depreciation is non-cash, so a rental often shows a tax loss while cash-flowing — sheltering income. Rental losses are passive: they offset passive income freely, and up to $25,000/yr can offset ordinary (W-2) income if you actively participate and your MAGI is under $100k (phasing out to $0 by $150k); unused losses carry forward. On sale, claimed depreciation is recaptured at up to 25%, and gains may owe capital-gains tax (a 1031 exchange can defer both). Figures are a year-1 estimate at your 24.0% rate — not tax advice; consult a CPA.
Schools (NCES district)
- District
- Robinson CUSD 2
- NCES district ID
- 1734230
- Math proficiency
- 21% ▼ -7.00%
- Reading proficiency
- 36% ▼ -11.00%
- Median HH income
- $45,260
- Composite
- 24.45/100
- National rank
- #7669
- State rank
- #271 of 620 in IL
Livability — Robinson
- Score
- 63/100
- State rank
- #761
- US rank
- #15326
Category grades
Schools grade is shown separately in the Schools card above.
Census & demographics
- Census place
- Robinson, IL
- Population (ZIP)
- 10,441
Population outlook (Crawford County) Hauer SSP2
- Today (2025)
- 18,610 people
- By 2030
- 18,078 · -2.9%
- By 2040
- 16,963 · -8.9%
- By 2050
- 15,662 · -15.8%
- By 2075
- 12,384 · -33.5%
- By 2100
- 8,916 · -52.1%
Race, ethnicity, and origin ACS 2023
- Neighborhood character
- Predominantly White (88%)
- Race & ethnicity
- White 88% Black 6% Hispanic / Latino 4% Two or more races 2% Native American 2%
- Common ancestry
- Slovak 2% Lithuanian 2% Serbian 2%
- Foreign-born
- 2% · Canada, Jamaica
- Languages at home
- 96% English-only · Spanish 3%
Political lean MEDSL · Crawford
- 2024 margin
- Solid R (+52.4) · D 22.9% · R 75.4% · Other 1.7%
- 2008→2024 swing
- -39.4pp toward R · 2008: -13.0pp · 2024: -52.4pp
- All cycles
- 2024: R+52.4 2020: R+51.3 2016: R+49.1 2012: R+31.6 2008: R+13.0
Not yet ingested
- Civics
- —
Market trends
- HPI YoY
- ▼ -74.37%
- Current HPI
- 105.76
- Rent YoY
- —
- Metro
- —
- State GDP YoY
- ▲ 1.59%
- F500 in state
- 60
Industry mix (Fortune 500 HQ in IL)
| Industry | F500 HQs | Revenue |
|---|---|---|
| Insurance | 4 | $201B |
|
||
| Consumer Goods | 4 | $87B |
|
||
| Industrial Machinery | 3 | $64B |
|
||
| Healthcare | 2 | $55B |
|
||
| Retail / Pharmacy | 1 | $148B |
|
||
| Agriculture / Food | 1 | $86B |
|
||
Price history
1 event — show timeline
- 2026-05-27 Listed $19,500 CIBR
Property tax history
+0.9%/yrLatest (2024): $1,727 · +14.5% YoY. Source: county tax records.
Cash-flow waterfall
monthlySold comps — $/sqft
last 12 mo · ≤1 miLoading sold comps…