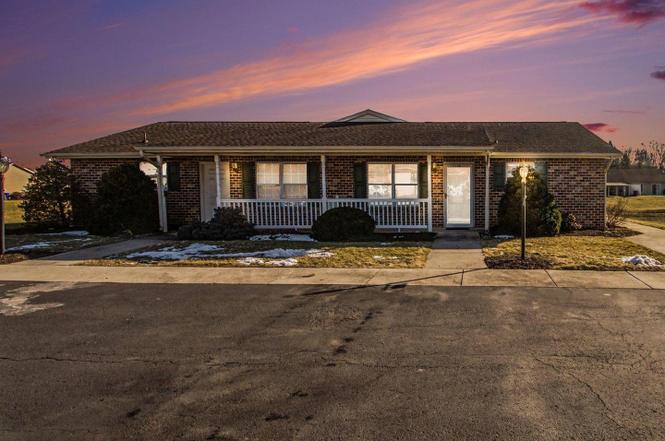
5-B Mel Ron Ct · Schlusser, PA
Flood risk No data
- FEMA flood zone
- —
- Chance of flooding over 30 yrs
- —
- Est. flood insurance / yr
- —
Fire risk No data
- Est. fire insurance / yr
- —
Heat risk No data
- Hot days now (above threshold)
- —
- Hot days in 30 yrs
- —
Wind risk No data
- Chance of severe wind over 30 yrs
- —
Air-quality risk No data
- Unhealthy air days now
- —
- Unhealthy air days in 30 yrs
- —
Risk factors via First Street. Map © Google.
Why this score? — see what drove the D- grade
The composite is a weighted blend of 9 inputs, each scored 0–100. Each bar is that input's sub-score; the figure is the points it added to the 100-point composite (weight × sub-score).
- Cash flow +10.0/30.0
- ARV discount +7.5/15.0
- Schools +5.6/10.0
- 1% rule +3.8/10.0
- Livability +3.3/5.0
- DSCR +2.8/10.0
- Rent growth +2.5/5.0
- Condition / age +2.5/5.0
- Appreciation +0.0/10.0
$210,000
🖨 Deal sheet (PDF) 📄 Offer letter ✓ Due diligence
Listing remarks MLS
This beautiful home just got a make over with new carpet and a fresh coat of paint. This 1,056 square foot home features 2 bedrooms, 1.5 baths, dining room, a and front and side covered patios. THE LARGE MASTER BEDROOM HAS A PRIVATE BATH AND HUGE WALK IN CLOSET. Lawn care & snow removal included in monthly fee
Key facts
- Porch
- Quiet setting
- Private patio
Tags
Neighborhood map
What this means for you Summary
Snapshot
- This is a 2-bed/1.5-bath condo listed at $210k.
Deal economics
- At list price, monthly cash flow is $-127 ($-2k/yr) — negative.
- The deal already cash-flows at list — no discount required.
- To meet the 1% rule (rent ≥ 1% of price), the offer needs to be $185k (12.0% below list).
- Recommended offer: $185k (12.0% below list) — sets the bar for 1% rule.
- Cap rate 5.6% vs local median 4.0% in Schlusser — top-decile yield for the area; either an underpriced asset or a hidden risk that comps aren't pricing in. Stress-test before assuming the spread holds.
Location & tenants
- Location reads 66/100 on livability (#1,058 in PA) — a middle-class / working-renter tenant base. Strengths: employment A+, cost of living A+, housing A+; Watch: amenities F, commute F, health & safety F.
- Cumberland Valley SD (suburban): math 54% / reading 71% proficiency, ranked #52 of 539 in PA (top 10%) — acceptable for families but not a draw, mixed tenant base, ~2y average lease; only 13% free/reduced lunch — higher-income household profile.
- Zoned schools: Middlesex El Sch (math 42% / reading 57%, grade D, #654 of 1,518 statewide, top 47%, 414 students, 49% FRL); Eagle View Ms (math 39% / reading 67%, grade C+, #90 of 512 statewide, top 19%, 1,021 students, 29% FRL); Cumberland Valley Hs (math 66% / reading 24%, grade D-, #191 of 437 statewide, top 44%, 3,035 students, 25% FRL) — zoned schools average 34% FRL vs 13% district-wide (21 pts higher); higher-poverty schools than district average — tighter screening recommended.
- Zoned-school proficiency averages 49% at this address vs 62% district-wide (-13 pts) — the specific schools serving this property underperform the Cumberland Valley SD average; the district grade overstates school quality for this exact location.
- Market conditions: 188 active listings in the ZIP; 5 comparable units currently listed for rent nearby; rentals at typical pace (median 16d on market — plan ~3-4 weeks tenant-placement turnaround); solid renter incomes; 1,052 units permitted in Cumberland County in 2024 (310 in 5+ unit buildings).
Forward outlook
- Local home prices are declining (-3.0%/yr); year-one equity from $1k of loan paydown is wiped out by about $6k of value loss. Plan a longer hold.
- Cumberland County population projected at +17% by 2050 — long-run rental-demand tailwind backs the buy-and-hold thesis.
Negotiation context
- It's been on market 82 days — a 6% lower offer ($197k) is reasonable based on typical stale-listing flexibility.
- 2 sale attempts since 12y ago with the ask held roughly flat each time — persistent listings suggest the price (not the market) is what's stuck; bring a comps-based counter.
- Current owner paid $92k; list at $210k implies a 128% gain — meaningful room to come down on a strong offer.
Questions for the listing agent
- What do current leases actually rent for vs. the listed asking? Can we see a recent rent roll and the last 12 months of T-12 income?
- It's been on market 82 days. Have you received any prior offers? Is the seller open to a 12% concession, seller financing, or rate buy-down credit?
- What does the HOA fee cover, when was the last increase, and are there any pending special assessments or reserve-fund shortfalls?
- Any open or pending special assessments — roof, HVAC, plumbing, elevator, façade? What's the per-unit balance and payoff schedule, and is the seller paying it off at close or rolling it to the buyer?
- Why hasn't it sold? Are there any deal-killer items the seller is aware of (foundation, flood, title, zoning, code violations)?
- Is there a deadline driving the sale (1031 exchange, divorce, estate, relocation)? That informs how much negotiation room exists.
- Schools are D-rated, which usually means shorter tenancies and higher turnover. Who's the typical renter profile here, and what's been the actual vacancy rate?
- The area grade is low — what's the realistic commute time and amenity access for the typical tenant pool here? Any planned neighborhood developments (good or bad) we should know about?
- What's the average days-on-market for RENTAL listings here right now (not sales)? A rising rental-DOM trend means longer vacancies and softer asking-rent achievability than the comps imply.
- What's the recent tenant-quality profile in this submarket — average credit score on applications, eviction rate, late-payment / NSF rate, and stable-employment percentage? A property-management company in the area should have these aggregated.
- How much new apartment / multifamily construction is in the pipeline within 1–3 miles? Heavy new supply (>2% of stock underway) typically softens rents 12–24 months out; light construction supports rent growth.
Investment metrics
- 1% rule
- 0.88% ✗
- Cap rate
- 5.57%
- Cash-on-cash
- -2.60%
- DSCR
- 0.88
- GRM
- 9.5
CMA / ARV
No comps found within radius.
Projected returns pro-forma
-3.0% appreciation · 3.0% rent growth · sell at horizon
- IRR
- -20.6%
- Equity multiple
- 0.29×
- Total profit
- $-42,029
- Equity at exit
- $31,312
- IRR
- -13.6%
- Equity multiple
- 0.21×
- Total profit
- $-46,590
- Equity at exit
- $18,157
Cash invested: $58,800 (down + closing). Projections, not guarantees.
Landlord ↔ Tenant lean methodology
- Overall (STATE)
- 62 Landlord-Friendly
- State Pennsylvania
- 62 Landlord-Friendly · EVEN
- County
- — inherits STATE
- City
- — inherits STATE
ZIP-level market 17015
- Home prices YoY
- -25.2%
- Active inventory
- 188
- Price-to-rent
- 9.5×
Monthly cashflow live
- Estimated rent
- $1,848 high interval (Pro) →
- Mortgage (P&I)
- −$1,101
- Tax est. 1.5%
- −$262 /mo · $3,150/yr
- Insurance
- −$88
- HOA est. from 2 same-building comps
- −$136
- Vacancy / Maint / Mgmt
- −$388
- Net cashflow
- $-127
Break-even live
Sensitivity live
| Price | -10% $18 | -5% $-55 | +0% $-127 | +5% $-200 | +10% $-272 |
|---|---|---|---|---|---|
| Rent | -10% $-273 | -5% $-200 | +0% $-127 | +5% $-54 | +10% $19 |
| Rate | -1.0pp $-22 | -0.5pp $-74 | base $-127 | +0.5pp $-182 | +1.0pp $-237 |
UW: 25.0% down · 7.5% · 30yr · 1.5% tax · 5.0% vac · 8.0% maint · 8.0% mgmt
Financing live
Cash to close
- Down payment
- $52,500
- Closing costs
- $6,300
- Reserves months
- —
- Total cash needed
- —
Loan-product check · same deal, 3 products live
Conventional
25% down · 7.5% · 30yr
- Down + closing
- —
- Monthly P&I
- —
- Monthly cashflow
- —
- DSCR
- —
- Eligible?
- —
Personal DTI + credit; lowest rate.
DSCR
20% down · 8.5% · 30yr
- Down + closing
- —
- Monthly P&I
- —
- Monthly cashflow
- —
- DSCR
- —
- Eligible?
- —
No personal income docs; deal must DSCR.
Hard money
10% down · 12.0% · 12mo
- Down + closing
- —
- Monthly P&I
- —
- Monthly cashflow
- —
- DSCR
- —
- Eligible?
- —
Short-term bridge; refi at stabilization.
Rent comps 5 comps
| Address | Beds | Baths | Sqft | Rent | $/sqft | DOM | Units | Dist |
|---|---|---|---|---|---|---|---|---|
| 24 Mel Ron Ct Carlisle, PA | 2.0 | 2.0 | 1168 | $1,700 | $1.46 | 25d | 1 | 0.03mi |
| 85 Harmony Hall Dr Unit 2 Carlisle, PA | 3.0 | 2.0 | 1305 | $1,875 | $1.44 | 45d | 1 | 0.28mi |
| 163 C Westpoint Dr Carlisle, PA | 2.0–3.0 | 2.0–2.5 | 1414 | $1,820 | $1.29 | 15d | 18 | 0.55mi |
| 1004 Rebecca St Carlisle, PA | 3.0 | 2.5 | 1404 | $1,720 | $1.23 | 15d | 1 | 0.84mi |
| 860 Carlwynne Mnr Carlisle, PA | 1.0–2.0 | 1.0 | 787 | $1,345 | $1.71 | 15d | 15 | 1.20mi |
HOA detail condo
- Monthly dues
- $0 · $0/yr
- Likely covers
- landscapingsnow removal
- Assessments
- None detected in remarks — confirm with the listing agent.
Listing history 4 events
-
2026-04-21status Pending
-
2026-01-29$210,000 Active
-
2015-10-30soldstatus $92,000 317-char remark
Show marketing remark (317 chars)
This beautiful home just got a make over with new carpet and a fresh coat of paint. This 1,056 square foot home features 2 bedrooms, 1.5 baths, dining room, a and front and side covered patios. THE LARGE MASTER BEDROOM HAS A PRIVATE BATH AND HUGE WALK IN CLOSET. Lawn care & snow removal included in monthly fee
-
2014-10-03$96,500 317-char remark
Show marketing remark (317 chars)
This beautiful home just got a make over with new carpet and a fresh coat of paint. This 1,056 square foot home features 2 bedrooms, 1.5 baths, dining room, a and front and side covered patios. THE LARGE MASTER BEDROOM HAS A PRIVATE BATH AND HUGE WALK IN CLOSET. Lawn care & snow removal included in monthly fee
ⓘ Source: listings_history table (triggers on properties + properties_extension) + one-shot
backfill from property_details.listing_events for pre-trigger history.
Nearby sold comps map
Loading sold comps map…
Walkable amenities ~0.75 mi
Loading nearby amenities…
Taxation est. · year 1
- Rental income
- $22,176
- − Mortgage interest
- −$11,763
- − Property taxes
- −$3,150
- − Insurance
- −$1,050
- − Repairs & maintenance
- −$1,774
- − Management
- −$1,774
- − HOA
- −$1,632
- − Depreciation
- −$6,109
- Taxable loss
- −$5,077
- Est. tax savings @ 24.0%
- +$1,218
- After-tax cash flow
- $-310/yr
For passive investors: Depreciation is non-cash, so a rental often shows a tax loss while cash-flowing — sheltering income. Rental losses are passive: they offset passive income freely, and up to $25,000/yr can offset ordinary (W-2) income if you actively participate and your MAGI is under $100k (phasing out to $0 by $150k); unused losses carry forward. On sale, claimed depreciation is recaptured at up to 25%, and gains may owe capital-gains tax (a 1031 exchange can defer both). Figures are a year-1 estimate at your 24.0% rate — not tax advice; consult a CPA.
Schools (NCES district)
- District
- Cumberland Valley SD
- NCES district ID
- 4207110
- Math proficiency
- 54% ▼ -6.00%
- Reading proficiency
- 71% ▼ -7.00%
- Median HH income
- $78,135
- Composite
- 55.77/100
- National rank
- #1218
- State rank
- #52 of 539 in PA
Livability — Schlusser
- Score
- 66/100
- State rank
- #1058
- US rank
- #11941
Category grades
Schools grade is shown separately in the Schools card above.
Census & demographics
- County
- Cumberland County · 257,673 people
- City population
- 37,738
- Metro
- Harrisburg-Carlisle, PA
- Population (ZIP)
- 24,385
- Household income
- $86,981
- Rent vs Own
- Severe rent burden
- 172.0
Population outlook (Cumberland County) Hauer SSP2
- Today (2025)
- 267,950 people
- By 2030
- 278,105 · +3.8%
- By 2040
- 296,552 · +10.7%
- By 2050
- 312,937 · +16.8%
- By 2075
- 349,233 · +30.3%
- By 2100
- 361,875 · +35.1%
Race, ethnicity, and origin ACS 2023
- Neighborhood character
- Predominantly White (94%)
- Race & ethnicity
- White 94% Two or more races 2% Hispanic / Latino 2%
- Common ancestry
- Romanian 3% Lithuanian 2% Slovak 2%
- Foreign-born
- 2% · Canada
- Languages at home
- 97% English-only · German/W. Germanic 1% Spanish 1% Other Indo-European 1%
Political lean MEDSL · Cumberland
- 2024 margin
- Lean R (+9.4) · D 44.6% · R 54.1% · Other 1.3%
- 2008→2024 swing
- +4.2pp toward D · 2008: -13.6pp · 2024: -9.4pp
- All cycles
- 2024: R+9.4 2020: R+10.6 2016: R+18.6 2012: R+18.5 2008: R+13.6
Not yet ingested
- Civics
- —
Market trends
- HPI YoY
- ▼ -89.66%
- Current HPI
- 265.9175
- Rent YoY
- —
- Metro
- Harrisburg-Carlisle, PA
- State GDP YoY
- ▲ 1.68%
- F500 in state
- 34
Industry mix (Fortune 500 HQ in PA)
| Industry | F500 HQs | Revenue |
|---|---|---|
| Healthcare | 2 | $309B |
|
||
| Insurance | 2 | $27B |
|
||
| Telecommunications / Media | 1 | $124B |
|
||
| Industrial Distribution | 1 | $22B |
|
||
| Financial Services | 1 | $20B |
|
||
| Chemicals / Materials | 1 | $18B |
|
||
Price history
+117.6% since first listed4 events — show timeline
- 2026-04-21 Pending — BRIGHT MLS
- 2026-01-29 Listed $210,000 BRIGHT MLS
- 2015-10-30 Sold (MLS) $92,000 BRIGHT MLS
- 2014-10-03 Listed $96,500 BRIGHT MLS
Cash-flow waterfall
monthlySold comps — $/sqft
last 12 mo · ≤1 miLoading sold comps…