 18-Plex
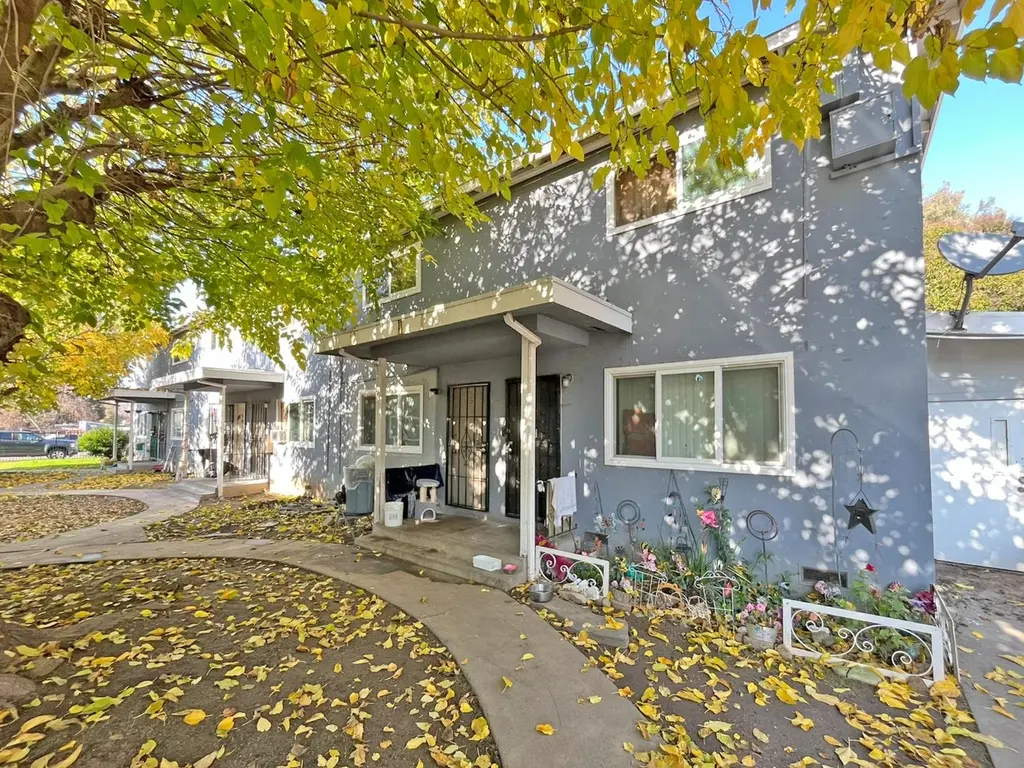
6221 39th St · Lemon Hill, CA
Flood risk 1/10 · Minimal
- FEMA flood zone
- X (shaded)
- Chance of flooding over 30 yrs
- 0.0%
- Est. flood insurance / yr
- $507 – $1,088
Fire risk 1/10 · Minimal
- Est. fire insurance / yr
- $659 – $1,223
Heat risk 7/10 · Major
- Hot days now (above 102°F)
- 7 days/yr
- Hot days in 30 yrs
- 14 days/yr
Wind risk 1/10 · Minimal
- Chance of severe wind over 30 yrs
- —
Air-quality risk 10/10 · Severe
- Unhealthy air days now
- 25 days/yr
- Unhealthy air days in 30 yrs
- 26 days/yr
Risk factors via First Street. Map © Google.
Why this score? — see what drove the B+ grade
The composite is a weighted blend of 9 inputs, each scored 0–100. Each bar is that input's sub-score; the figure is the points it added to the 100-point composite (weight × sub-score).
- Cash flow +30.0/30.0
- ARV discount +15.0/15.0
- 1% rule +10.0/10.0
- DSCR +10.0/10.0
- Rent growth +4.1/5.0
- Schools +3.5/10.0
- Condition / age +2.5/5.0
- Livability +2.2/5.0
- Appreciation +0.0/10.0
$2,000,000
🖨 Deal sheet (PDF) 📄 Offer letter ✓ Due diligence
Multi-family units
County records classify this as Multi-Family (5+ Unit). Listing-text estimate: 18 units. confirmed
5+ unit building — per-unit beds/baths from public records are typically unavailable; the breakdown below (if shown) is an estimate from the listing text.
Listing remarks MLS
18 UNITS ALL 2 BEDROOMS 1 & 1/2 BATHS RENT FROM $ 750 TO $775 EACH UNIT.PLEASE DO NOT ASK THE TENANTS OFFER SUBJECT INSPECTION THANK YOU.
Key facts
- 0.65 acre lot
- 18 parking spots
- Built 1963
Neighborhood map
What this means for you Summary
Snapshot
- This is a 18 × 2.0-bed/1.5-bath units multifamily listed at $2.00M.
Deal economics
- At list price, monthly cash flow is $12k ($142k/yr) — positive. Per door: $659/mo.
- The deal already cash-flows at list — no discount required.
- Meets the 1% rule at list price ($30k rent vs $2.00M).
- Recommended offer: $1.88M (6.0% below list) — sets the bar for market timing.
- Cap rate 13.4% vs local median 3.8% in Lemon Hill — top-decile yield for the area; either an underpriced asset or a hidden risk that comps aren't pricing in. Stress-test before assuming the spread holds.
Location & tenants
- Location reads 45/100 on livability (#1,302 in CA) — a working-class tenant base; expect higher turnover. Strengths: housing A; Watch: health & safety D, crime F, amenities F.
- Sacramento City Unified (urban): math 32% / reading 43% proficiency, ranked #804 of 1,400 in CA (top 57%) — families likely to look elsewhere, expect single-tenant / working-renter base with shorter leases; 63% free/reduced lunch — lower-income household profile, screen leases tightly.
- Zoned schools: Leonardo Da Vinci (797 students, 35% FRL); Fern Bacon Middle (671 students, 92% FRL); C. K. Mcclatchy High (2,427 students, 56% FRL) — zoned schools at 61% FRL track the district average.
- Market conditions: Rents rising fast (+6.4%/yr); 67 active listings in the ZIP; 6,825 units permitted in Sacramento County in 2024 (1,752 in 5+ unit buildings).
- At $30,462/mo this rent would consume 647% of the median local household income ($56k/yr) (locally 1671% of renters already pay >50% of income on rent) — very limited rent-growth headroom before tenants either downsize or default.
Forward outlook
- Local home prices are declining (-3.0%/yr); year-one equity from $14k of loan paydown is wiped out by about $60k of value loss. Plan a longer hold.
- Sacramento County population projected at +17% by 2050 — long-run rental-demand tailwind backs the buy-and-hold thesis.
- At projected returns (-3.0% appreciation + 6.4% rent growth), your $560k cash investment doubles in ~5 years — after that, you're playing with house money.
Negotiation context
- It's been on market 66 days — a 6% lower offer ($1.88M) is reasonable based on typical stale-listing flexibility.
- Current owner paid $660k; list at $2.00M implies a 203% gain — meaningful room to come down on a strong offer.
Risks & watch-outs
- Climate carrying-cost: extreme-heat days projected 7→14/yr by 2055 (HVAC capex compounding) — expect insurance premiums to compound above CPI over the hold.
Questions for the listing agent
- It's been on market 66 days. Have you received any prior offers? Is the seller open to a 6% concession, seller financing, or rate buy-down credit?
- Can we see the unit-by-unit rent roll, current vacancy, and any below-market leases? What's the average tenancy length?
- What capital expenditures (roof, boiler, parking lot, exteriors) have been made in the last 5 years, and what's planned in the next 2?
- Built in 1963 — when were the roof, HVAC, electrical panel, plumbing, and water heater last replaced?
- Why hasn't it sold? Are there any deal-killer items the seller is aware of (foundation, flood, title, zoning, code violations)?
- Is there a deadline driving the sale (1031 exchange, divorce, estate, relocation)? That informs how much negotiation room exists.
- Schools are F-rated, which usually means shorter tenancies and higher turnover. Who's the typical renter profile here, and what's been the actual vacancy rate?
- Crime grade is F in this area — have there been break-ins, vandalism, or insurance claims at this property in the last 3 years? What carrier currently insures it and at what premium?
- What's the average days-on-market for RENTAL listings here right now (not sales)? A rising rental-DOM trend means longer vacancies and softer asking-rent achievability than the comps imply.
- What's the recent tenant-quality profile in this submarket — average credit score on applications, eviction rate, late-payment / NSF rate, and stable-employment percentage? A property-management company in the area should have these aggregated.
- How much new apartment / multifamily construction is in the pipeline within 1–3 miles? Heavy new supply (>2% of stock underway) typically softens rents 12–24 months out; light construction supports rent growth.
Investment metrics
- 1% rule
- 1.52% ✓
- Cap rate
- 13.42%
- Cash-on-cash
- 25.44%
- DSCR
- 2.13
- GRM
- 5.5
CMA / ARV
- ARV (median comp)
- $3,280,115
- List price
- $2,000,000
- Delta
- -39.03%
- Verdict
- UNDERPRICED
- Comps
- 1 within 2.0 mi
Projected returns pro-forma
-3.0% appreciation · 6.44% rent growth · sell at horizon
- IRR
- 22.6%
- Equity multiple
- 1.97×
- Total profit
- $540,462
- Equity at exit
- $298,207
- IRR
- 32.6%
- Equity multiple
- 4.43×
- Total profit
- $1,922,334
- Equity at exit
- $172,923
Cash invested: $560,000 (down + closing). Projections, not guarantees.
Landlord ↔ Tenant lean methodology
- Overall (STATE)
- 18 Strongly Tenant-Friendly
- State California
- 18 Strongly Tenant-Friendly · D+13
- County
- — inherits STATE
- City
- — inherits STATE
ZIP-level market 95824
- Rents YoY
- 6.4%
- Active inventory
- 67
- Price-to-rent
- 98.5×
Monthly cashflow live
- Estimated rent
- $30,462 high interval (Pro) →
- Mortgage (P&I)
- −$10,488
- Tax from tax record
- −$873 /mo · $10,479/yr
- Insurance
- −$833
- HOA
- −$0
- Vacancy / Maint / Mgmt
- −$6,397
- Net cashflow
- $11,870
Break-even live
Sensitivity live
| Price | -10% $13,002 | -5% $12,436 | +0% $11,870 | +5% $11,304 | +10% $10,738 |
|---|---|---|---|---|---|
| Rent | -10% $9,464 | -5% $10,667 | +0% $11,870 | +5% $13,073 | +10% $14,277 |
| Rate | -1.0pp $12,877 | -0.5pp $12,379 | base $11,870 | +0.5pp $11,352 | +1.0pp $10,825 |
18-unit breakdown (identical units grouped — click to expand)
| Units | Beds | Baths | Est. rent |
|---|---|---|---|
| 18× units | 2.0 | 1.5 | $30,456 |
| #1 | 2.0 | 1.5 | $1,692 |
| #2 | 2.0 | 1.5 | $1,692 |
| #3 | 2.0 | 1.5 | $1,692 |
| #4 | 2.0 | 1.5 | $1,692 |
| #5 | 2.0 | 1.5 | $1,692 |
| #6 | 2.0 | 1.5 | $1,692 |
| #7 | 2.0 | 1.5 | $1,692 |
| #8 | 2.0 | 1.5 | $1,692 |
| #9 | 2.0 | 1.5 | $1,692 |
| #10 | 2.0 | 1.5 | $1,692 |
| #11 | 2.0 | 1.5 | $1,692 |
| #12 | 2.0 | 1.5 | $1,692 |
| #13 | 2.0 | 1.5 | $1,692 |
| #14 | 2.0 | 1.5 | $1,692 |
| #15 | 2.0 | 1.5 | $1,692 |
| #16 | 2.0 | 1.5 | $1,692 |
| #17 | 2.0 | 1.5 | $1,692 |
| #18 | 2.0 | 1.5 | $1,692 |
| Total (18 units) | $30,462 | ||
UW: 25.0% down · 7.5% · 30yr · 1.5% tax · 5.0% vac · 8.0% maint · 8.0% mgmt
Financing live
Cash to close
- Down payment
- $500,000
- Closing costs
- $60,000
- Reserves months
- —
- Total cash needed
- —
Loan-product check · same deal, 3 products live
Conventional
25% down · 7.5% · 30yr
- Down + closing
- —
- Monthly P&I
- —
- Monthly cashflow
- —
- DSCR
- —
- Eligible?
- —
Personal DTI + credit; lowest rate.
DSCR
20% down · 8.5% · 30yr
- Down + closing
- —
- Monthly P&I
- —
- Monthly cashflow
- —
- DSCR
- —
- Eligible?
- —
No personal income docs; deal must DSCR.
Hard money
10% down · 12.0% · 12mo
- Down + closing
- —
- Monthly P&I
- —
- Monthly cashflow
- —
- DSCR
- —
- Eligible?
- —
Short-term bridge; refi at stabilization.
Listing history 25 events
-
2026-06-21days on market $2,000,000 Active 66 DOM
-
2026-06-18days on market $2,000,000 Active 63 DOM
-
2026-06-17days on market $2,000,000 Active 62 DOM
-
2026-06-16days on market $2,000,000 Active 61 DOM
-
2026-06-15days on market $2,000,000 Active 60 DOM
-
2026-06-13days on market $2,000,000 Active 58 DOM
-
2026-06-13pricedays on market $2,000,000 Active 57 DOM
-
2026-06-09days on market $2,300,000 Active 54 DOM
-
2026-06-08days on market $2,300,000 Active 53 DOM
-
2026-06-07days on market $2,300,000 Active 52 DOM
-
2026-06-05days on market $2,300,000 Active 49 DOM
-
2026-06-03days on market $2,300,000 Active 48 DOM
-
2026-06-02days on market $2,300,000 Active 47 DOM
-
2026-06-01days on market $2,300,000 Active 46 DOM
-
2026-05-31days on market $2,300,000 Active 45 DOM
-
2010-08-09soldstatus $660,000
-
2009-12-02soldstatus $632,000
-
2005-06-24soldstatus $1,650,000
-
2005-06-23soldstatus $1,650,000 142-char remark
Show marketing remark (142 chars)
18 UNITS ALL 2 BEDROOMS 1 & 1/2 BATHS RENT FROM $ 750 TO $775 EACH UNIT.PLEASE DO NOT ASK THE TENANTS OFFER SUBJECT INSPECTION THANK YOU.
-
2005-02-22historical 142-char remark
Show marketing remark (142 chars)
18 UNITS ALL 2 BEDROOMS 1 & 1/2 BATHS RENT FROM $ 750 TO $775 EACH UNIT.PLEASE DO NOT ASK THE TENANTS OFFER SUBJECT INSPECTION THANK YOU.
-
2005-02-14$1,650,000 142-char remark
Show marketing remark (142 chars)
18 UNITS ALL 2 BEDROOMS 1 & 1/2 BATHS RENT FROM $ 750 TO $775 EACH UNIT.PLEASE DO NOT ASK THE TENANTS OFFER SUBJECT INSPECTION THANK YOU.
-
2004-05-25soldstatus $1,250,000
-
2000-04-07soldstatus $337,000
-
1986-01-08soldstatus $430,000
-
1978-12-01soldstatus $134,000
ⓘ Source: listings_history table (triggers on properties + properties_extension) + one-shot
backfill from property_details.listing_events for pre-trigger history.
Tax reassessment forecast CA · Resets to sale price
- Current annual tax
- $10,479 · $873/mo
- Projected year-2 tax
- $15,200 · $1,267/mo
- Expected delta
- +$4,721/yr (+$393/mo · 45.1%)
ⓘ Screening estimate from a state-policy table — verify with the county assessor before closing.
Climate risk First Street
- Flood 1/10 Low FEMA zone X (shaded) · 0% chance over 30 yrs
- Wildfire 1/10 Low
- Heat 7/10 Severe 7 d/yr ≥102°F today · 14 d/yr by 30 yrs out
- Wind 1/10 Low
- Air quality 10/10 Extreme 25 unhealthy d/yr today · 26 by 30 yrs out
Nearby sold comps map
Loading sold comps map…
Walkable amenities ~0.75 mi
Loading nearby amenities…
Taxation est. · year 1
- Rental income
- $365,544
- − Mortgage interest
- −$112,031
- − Property taxes
- −$10,479
- − Insurance
- −$10,000
- − Repairs & maintenance
- −$29,244
- − Management
- −$29,244
- − Depreciation
- −$58,182
- Taxable income
- $116,365
- Est. tax owed @ 24.0%
- −$27,928
- After-tax cash flow
- $114,515/yr
For passive investors: Depreciation is non-cash, so a rental often shows a tax loss while cash-flowing — sheltering income. Rental losses are passive: they offset passive income freely, and up to $25,000/yr can offset ordinary (W-2) income if you actively participate and your MAGI is under $100k (phasing out to $0 by $150k); unused losses carry forward. On sale, claimed depreciation is recaptured at up to 25%, and gains may owe capital-gains tax (a 1031 exchange can defer both). Figures are a year-1 estimate at your 24.0% rate — not tax advice; consult a CPA.
Schools (NCES district)
- District
- Sacramento City Unified
- NCES district ID
- 0633840
- Math proficiency
- 32% ▬ 0.00%
- Reading proficiency
- 43% ▲ 3.00%
- Median HH income
- $49,280
- Composite
- 34.86/100
- National rank
- #10000
- State rank
- #804 of 1400 in CA
Livability — Lemon Hill
- Score
- 45/100
- State rank
- #1302
- US rank
- #26608
Category grades
Schools grade is shown separately in the Schools card above.
Census & demographics
- Census place
- Lemon Hill, CA
- County
- Sacramento County · 1,539,646 people
- Metro
- Sacramento-Roseville-Folsom, CA
- Population (ZIP)
- 33,083
- Household income
- $56,477
- Rent vs Own
- Severe rent burden
- 1671.0
Population outlook (Sacramento County) Hauer SSP2
- Today (2025)
- 1,660,763 people
- By 2030
- 1,732,990 · +4.3%
- By 2040
- 1,855,755 · +11.7%
- By 2050
- 1,941,335 · +16.9%
- By 2075
- 2,046,162 · +23.2%
- By 2100
- 1,961,444 · +18.1%
Race, ethnicity, and origin ACS 2023
- Neighborhood character
- Highly diverse neighborhood (Simpson 0.70)
- Race & ethnicity
- Hispanic / Latino 43% Asian 29% White 13% Two or more races 12% Black 10% Native American 2% Pacific Islander 2%
- Hispanic origin (detail)
- Mexican 38%
- Common ancestry
- Lithuanian 1% Russian 1%
- Foreign-born
- 33% · Canada, Vietnam, China
- Languages at home
- 44% English-only · Spanish 29% Other Asian/Pacific 12% Vietnamese 5%
Political lean MEDSL · Sacramento
- 2024 margin
- D (+19.7) · D 58.1% · R 38.4% · Other 3.5%
- 2008→2024 swing
- +0.7pp no change · 2008: 19.0pp · 2024: 19.7pp
- All cycles
- 2024: D+19.7 2020: D+25.3 2016: D+23.7 2012: D+16.3 2008: D+19.0
Not yet ingested
- Civics
- —
Market trends
- HPI YoY
- ▼ -341.41%
- Current HPI
- 409.6203
- Rent YoY
- ▲ 6.44%
- Metro
- Sacramento-Roseville-Folsom, CA
- State GDP YoY
- ▲ 3.21%
- F500 in state
- 116
Industry mix (Fortune 500 HQ in CA)
| Industry | F500 HQs | Revenue |
|---|---|---|
| Technology | 27 | $1,492B |
|
||
| Financial Services | 3 | $174B |
|
||
| Retail | 3 | $44B |
|
||
| Insurance | 3 | $26B |
|
||
| Media / Entertainment | 2 | $115B |
|
||
| Pharmaceuticals / Biotech | 2 | $62B |
|
||
Price history
+392.5% since first listed10 events — show timeline
- 2010-08-09 Sold (Public Records) $660,000 Public Records
- 2009-12-02 Sold (Public Records) $632,000 Public Records
- 2005-06-24 Sold (Public Records) $1,650,000 Public Records
- 2005-06-23 Sold (MLS) $1,650,000 bridgeMLS, Bay East AOR, or Contra Costa AOR
- 2005-02-22 Listing Removed — bridgeMLS, Bay East AOR, or Contra Costa AOR
- 2005-02-14 Listed $1,650,000 bridgeMLS, Bay East AOR, or Contra Costa AOR
- 2004-05-25 Sold (Public Records) $1,250,000 Public Records
- 2000-04-07 Sold (Public Records) $337,000 Public Records
- 1986-01-08 Sold (Public Records) $430,000 Public Records
- 1978-12-01 Sold (Public Records) $134,000 Public Records
Property tax history
-3.7%/yrLatest (2025): $10,479 · -48.7% YoY. Source: county tax records.
Cash-flow waterfall
monthlySold comps — $/sqft
last 12 mo · ≤1 miLoading sold comps…