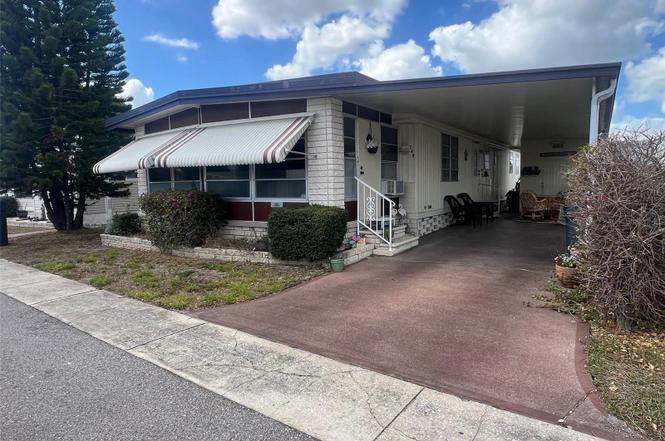
29250 US Highway 19 N #248 · Clearwater, FL
Flood risk 1/10 · Minimal
- FEMA flood zone
- A
- Chance of flooding over 30 yrs
- 0.0%
- Est. flood insurance / yr
- $1,009 – $1,996
Fire risk 1/10 · Minimal
- Est. fire insurance / yr
- $947 – $1,759
Heat risk 10/10 · Severe
- Hot days now (above 107°F)
- 7 days/yr
- Hot days in 30 yrs
- 25 days/yr
Wind risk 10/10 · Severe
- Chance of severe wind over 30 yrs
- 99.0%
Air-quality risk 3/10 · Minor
- Unhealthy air days now
- 3 days/yr
- Unhealthy air days in 30 yrs
- 3 days/yr
Risk factors via First Street. Map © Google.
Why this score? — see what drove the B grade
The composite is a weighted blend of 9 inputs, each scored 0–100. Each bar is that input's sub-score; the figure is the points it added to the 100-point composite (weight × sub-score).
- Cash flow +25.0/30.0
- ARV discount +15.0/15.0
- 1% rule +8.4/10.0
- DSCR +8.2/10.0
- Schools +4.3/10.0
- Livability +4.1/5.0
- Rent growth +2.5/5.0
- Condition / age +2.5/5.0
- Appreciation +0.0/10.0
$135,000
🖨 Deal sheet (PDF) 📄 Offer letter ✓ Due diligence
Listing remarks
NEW REDUCED PRICE! Presenting a newly listed property offering 2 bedrooms and 2 bathrooms, encompassing a spacious 1,152 square feet. This residence is conveniently located in close proximity to the clubhouse and pool. Located within Doral Village, a distinguished 55+ gated community recognized for its lively atmosphere, welcoming environment, and engaging lifestyle offerings. This community is strategically located near shopping centers, picturesque beaches, entertainment venues, sporting events, and a diverse selection of restaurants. A property offering exceptional accessibility to essential amenities, residents benefit from outstanding facilities, including a heated pool and spa, billia
Key facts
- Central heat and air
- Fully furnished home
- Heated pool and spa
Tags
Property features AI
Finance
- Other: Unit is furnished
- Financial info: Total monthly HOA fees reported as $238; Total annual fees reported as $2,856; Lease restrictions apply
- HOA & community: Has HOA (monthly fee $238); Association amenities: Clubhouse, Pool, Spa/Hot Tub, Recreation facilities, Pickleball courts, Tennis courts, Shuffleboard courts, Laundry; Association fee includes pool, reserves, grounds maintenance, management, recreational facilities, sewer, trash, water; Association approval required; Senior community; Pets allowed (cats; limits on number and size); Community features: Sidewalks, golf carts allowed
Exterior
- Parking: Carport with 2 spaces
- Security: Gated community
- Utilities: Public water; Public sewer; Electricity available and connected; Water available and connected; Sewer available and connected; Cable available
- Home design: Residential mobile home (double wide); One story; Faces east; Entry level: One
- Construction: Metal siding; Roof over; Crawlspace foundation
- Exterior features: Enclosed patio/porch (Florida Room); Awning(s); Private mailbox; Sidewalk; Tennis court(s); Shed(s)
Interior
- Kitchen: Dishwasher; Microwave; Range; Refrigerator; Electric water heater
- Bedrooms: 2 bedrooms
- Flooring: Carpet; Ceramic tile; Laminate; Vinyl
- Bathrooms: 2 full bathrooms
- Heating & cooling: Central heating; Central air conditioning
- Interior features: Ceiling fans; Living room/dining room combo; Thermostat; Walk-in closet(s); Window treatments; Aluminum window frames
- Laundry & utility: Washer; Dryer; Laundry features: Other
Neighborhood map
What this means for you Summary
Snapshot
- This is a 2-bed/2.0-bath manufactured listed at $135k.
Deal economics
- At list price, monthly cash flow is $170 ($2k/yr) — positive.
- The deal already cash-flows at list — no discount required.
- Meets the 1% rule at list price ($2k rent vs $135k).
- Recommended offer: $123k (9.0% below list) — sets the bar for market timing.
- Cap rate 8.9% vs local median 2.9% in Clearwater — top-decile yield for the area; either an underpriced asset or a hidden risk that comps aren't pricing in. Stress-test before assuming the spread holds.
Location & tenants
- Location reads 82/100 on livability (#60 in FL, #988 nationally) — a professional / high-income tenant draw. Strengths: commute A+, housing A+, health & safety A+; Watch: schools C-, employment C-.
- Pinellas (suburban): math 51% / reading 51% proficiency, ranked #31 of 73 in FL (top 42%) — acceptable for families but not a draw, mixed tenant base, ~2y average lease.
- Market conditions: Rents flat; 201 active listings in the ZIP; 22 comparable units currently listed for rent nearby; rentals leasing fast (median 12d on market — plan ~1-2 weeks tenant-placement turnaround); 2,676 units permitted in Pinellas County in 2024 (1,422 in 5+ unit buildings).
Forward outlook
- Local home prices are declining (-3.0%/yr); year-one equity from $933 of loan paydown is wiped out by about $4k of value loss. Plan a longer hold.
- Pinellas County population projected at +14% by 2050 — modest demand growth; plan on rents tracking national, not racing it.
Negotiation context
- It's been on market 120 days — a 9% lower offer ($123k) is reasonable based on typical stale-listing flexibility.
- Current owner paid $28k; list at $135k implies a 382% gain — meaningful room to come down on a strong offer.
Risks & watch-outs
- Watch-outs: flood insurance adds $125/mo.
- Climate carrying-cost: in FEMA flood zone A (mandatory federal flood insurance); severe wind risk, 99% chance of damaging wind over 30y; extreme-heat days projected 7→25/yr by 2055 (HVAC capex compounding) — expect insurance premiums to compound above CPI over the hold.
Questions for the listing agent
- It's been on market 120 days. Have you received any prior offers? Is the seller open to a 9% concession, seller financing, or rate buy-down credit?
- Built in 1972 — when were the roof, HVAC, electrical panel, plumbing, and water heater last replaced?
- What's the actual annual flood-insurance premium (NFIP or private), and is the property in a SFHA with mandatory coverage?
- What does the HOA fee cover, when was the last increase, and are there any pending special assessments or reserve-fund shortfalls?
- Why hasn't it sold? Are there any deal-killer items the seller is aware of (foundation, flood, title, zoning, code violations)?
- Is there a deadline driving the sale (1031 exchange, divorce, estate, relocation)? That informs how much negotiation room exists.
- What's the average days-on-market for RENTAL listings here right now (not sales)? A rising rental-DOM trend means longer vacancies and softer asking-rent achievability than the comps imply.
- What's the recent tenant-quality profile in this submarket — average credit score on applications, eviction rate, late-payment / NSF rate, and stable-employment percentage? A property-management company in the area should have these aggregated.
- How much new for-sale + rental construction is in the pipeline within 1–3 miles? Heavy new supply typically softens prices + rents 12–24 months out; constrained supply supports both.
Investment metrics
- 1% rule
- 1.34% ✓
- Cap rate
- 8.92%
- Cash-on-cash
- 9.37%
- DSCR
- 1.42
- GRM
- 6.2
CMA / ARV
- ARV (on-the-fly)
- $185,472
- Comps found
- 4
Show comp detail 4 sales within ~0.75 mi
| Address | Dist | Beds/Ba | Sqft | Sold | Price | $/sf | Match |
|---|---|---|---|---|---|---|---|
| 29250 US Highway 19 N #446 | 0.00mi | 2/2.0 | 1,056 (-8%) | 3mo | $140,000 | $133 | 83 |
| 29250 US Highway 19 N #555 | 0.00mi | 2/2.0 | 1,056 (-8%) | 12mo | $170,000 | $161 | 76 |
| 29250 US Highway 19 N #403 | 0.00mi | 2/2.0 | 1,303 (+13%) | 5mo | $250,000 | $192 | 74 |
| 29250 US Highway 19 N #116 | 0.00mi | 2/2.0 | 1,004 (-13%) | 6mo | $145,000 | $144 | 73 |
Match score weights: distance 35% · size 25% · config 20% · recency 20%. Top-matched comps best support the ARV.
Projected returns pro-forma
-3.0% appreciation · 0.11% rent growth · sell at horizon
- IRR
- -12.1%
- Equity multiple
- 0.58×
- Total profit
- $-15,941
- Equity at exit
- $20,129
- IRR
- -9.8%
- Equity multiple
- 0.50×
- Total profit
- $-18,824
- Equity at exit
- $11,672
Cash invested: $37,800 (down + closing). Projections, not guarantees.
Landlord ↔ Tenant lean methodology
- Overall (STATE)
- 87 Strongly Landlord-Friendly
- State Florida
- 87 Strongly Landlord-Friendly · R+3
- County
- — inherits STATE
- City
- — inherits STATE
ZIP-level market 33761
- Rents YoY
- 0.1%
- Active inventory
- 201
- Price-to-rent
- 6.2×
Monthly cashflow live
- Estimated rent
- $1,809 high interval (Pro) →
- Mortgage (P&I)
- −$708
- Tax from tax record
- −$132 /mo · $1,579/yr
- Insurance
- −$56
- Flood insurance flood zone
- −$125 /mo · $1,502/yr
- HOA
- −$238
- Vacancy / Maint / Mgmt
- −$380
- Net cashflow
- $170
Break-even live
Sensitivity live
| Price | -10% $246 | -5% $208 | +0% $170 | +5% $132 | +10% $93 |
|---|---|---|---|---|---|
| Rent | -10% $27 | -5% $98 | +0% $170 | +5% $241 | +10% $313 |
| Rate | -1.0pp $238 | -0.5pp $204 | base $170 | +0.5pp $135 | +1.0pp $99 |
UW: 25.0% down · 7.5% · 30yr · 1.5% tax · 5.0% vac · 8.0% maint · 8.0% mgmt
Financing live
Cash to close
- Down payment
- $33,750
- Closing costs
- $4,050
- Reserves months
- —
- Total cash needed
- —
Loan-product check · same deal, 3 products live
Conventional
25% down · 7.5% · 30yr
- Down + closing
- —
- Monthly P&I
- —
- Monthly cashflow
- —
- DSCR
- —
- Eligible?
- —
Personal DTI + credit; lowest rate.
DSCR
20% down · 8.5% · 30yr
- Down + closing
- —
- Monthly P&I
- —
- Monthly cashflow
- —
- DSCR
- —
- Eligible?
- —
No personal income docs; deal must DSCR.
Hard money
10% down · 12.0% · 12mo
- Down + closing
- —
- Monthly P&I
- —
- Monthly cashflow
- —
- DSCR
- —
- Eligible?
- —
Short-term bridge; refi at stabilization.
Rent comps 22 comps
| Address | Beds | Baths | Sqft | Rent | $/sqft | DOM | Units | Dist |
|---|---|---|---|---|---|---|---|---|
| 2228 Richter St Unit A Dunedin, FL | 2.0 | 2.0 | 1225 | $1,900 | $1.55 | 24d | 1 | 0.35mi |
| 28488 U.S. 19 Unit 150 Clearwater, FL | 3.0 | 1.5 | 990 | $1,500 | $1.52 | 12d | 1 | 0.40mi |
| 2500 Winding Creek Blvd Unit C205 Clearwater, FL | 2.0 | 2.0 | 946 | $1,700 | $1.80 | 5d | 1 | 0.42mi |
| 2500 Winding Creek Blvd Clearwater, FL | 1.0–2.0 | 1.0–2.0 | 812 | $1,700 | $2.09 | 2d | 3 | 0.43mi |
| 2500 Winding Creek Blvd Clearwater, FL | 2.0 | 2.0 | 946 | $1,675 | $1.77 | 3d | 2 | 0.43mi |
| 3052 Park Ln Unit B Dunedin, FL | 2.0 | 1.0 | 821 | $1,700 | $2.07 | 24d | 1 | 0.49mi |
| 3055 Belcher Rd Dunedin, FL | 2.0 | 1.0 | 750 | $1,345 | $1.79 | 22d | 1 | 0.51mi |
| 2971 Estancia Blvd #321 Clearwater, FL | 2.0 | 2.0 | 995 | $1,975 | $1.98 | 4d | 1 | 0.56mi |
| 373 Majesty Dr Unit 373 Clearwater, FL | 2.0 | 2.0 | 1200 | $1,600 | $1.33 | 24d | 1 | 0.60mi |
| 2999 Fieldbrook Pl Clearwater, FL | 2.0 | 2.0 | 1164 | $2,300 | $1.98 | 24d | 1 | 0.68mi |
| 305 Hammock Pine Blvd #305 Clearwater, FL | 1.0 | 1.5 | 760 | $1,500 | $1.97 | 24d | 1 | 0.69mi |
| 2307 Cumberland Cir Clearwater, FL | 1.0–2.0 | 1.0–2.0 | 873 | $2,099 | $2.40 | 4d | 15 | 0.92mi |
| 2780 Cypress Dr Unit A Clearwater, FL | 2.0 | 1.0 | 900 | $1,749 | $1.94 | 22d | 1 | 1.01mi |
| 2780 Park Dr Unit D 4 Clearwater, FL | 2.0 | 1.5 | 900 | $1,625 | $1.81 | 24d | 1 | 1.05mi |
| 1430 Heather Ridge Blvd #304 Dunedin, FL | 1.0 | 1.0 | 915 | $1,500 | $1.64 | 24d | 1 | 1.16mi |
| 762 Barbara St Palm Harbor, FL | 2.0 | 2.0 | 1146 | $2,200 | $1.92 | 24d | 1 | 1.25mi |
| 1515 County Road 1 Dunedin, FL | 1.0–2.0 | 1.0 | 719 | $1,750 | $2.43 | 8d | 1 | 1.36mi |
| 2673 Sabal Springs Cir #201 Clearwater, FL | 1.0 | 1.5 | 805 | $2,675 | $3.32 | 8d | 1 | 1.36mi |
| 3610 Sammy Ct Palm Harbor, FL | 2.0 | 1.0 | 797 | $2,000 | $2.51 | 5d | 1 | 1.39mi |
| 2257 Palmwood Dr Dunedin, FL | 3.0 | 2.0 | 1150 | $2,475 | $2.15 | 5d | 1 | 1.42mi |
| 3460 Countryside Blvd #60 Clearwater, FL | 2.0 | 2.5 | 1349 | $2,500 | $1.85 | 8d | 1 | 1.45mi |
| 1454 Michigan Blvd Dunedin, FL | 2.0 | 1.0 | 1000 | $2,300 | $2.30 | 4d | 1 | 1.47mi |
HOA detail
- Monthly dues
- $238 · $2,856/yr
- Likely covers
- poolsecurity
Listing history 15 events
-
2026-06-18days on market $135,000 Active 120 DOM
-
2026-06-17days on market $135,000 Active 119 DOM
-
2026-06-16days on market $135,000 Active 118 DOM
-
2026-06-15days on market $135,000 Active 117 DOM
-
2026-06-13days on market $135,000 Active 115 DOM
-
2026-06-09days on market $135,000 Active 111 DOM
-
2026-06-08days on market $135,000 Active 110 DOM
-
2026-06-07days on market $135,000 Active 109 DOM
-
2026-06-04days on market $135,000 Active 106 DOM
-
2026-06-03days on market $135,000 Active 105 DOM
-
2026-06-01days on market $135,000 Active 103 DOM
-
2026-05-31days on market $135,000 Active 102 DOM
-
2026-05-19price $135,000
-
2026-02-18$149,900 Active
-
2001-11-01soldstatus $28,000
ⓘ Source: listings_history table (triggers on properties + properties_extension) + one-shot
backfill from property_details.listing_events for pre-trigger history.
Tax reassessment forecast FL · Resets to sale price
- Current annual tax
- $1,579 · $132/mo
- Projected year-2 tax
- $1,579 · $132/mo
- Expected delta
- $0/yr ($0/mo · 0.0%)
ⓘ Screening estimate from a state-policy table — verify with the county assessor before closing.
Climate risk First Street
- Flood 1/10 Low FEMA zone A · 0% chance over 30 yrs
- Wildfire 1/10 Low
- Heat 10/10 Extreme 7 d/yr ≥107°F today · 25 d/yr by 30 yrs out
- Wind 10/10 Extreme 99% chance of damaging wind over 30 yrs
- Air quality 3/10 Moderate 3 unhealthy d/yr today · 3 by 30 yrs out
Nearby sold comps map
Loading sold comps map…
Walkable amenities ~0.75 mi
Loading nearby amenities…
Taxation est. · year 1
- Rental income
- $21,705
- − Mortgage interest
- −$7,562
- − Property taxes
- −$1,579
- − Insurance
- −$2,178
- − Repairs & maintenance
- −$1,736
- − Management
- −$1,736
- − HOA
- −$2,856
- − Depreciation
- −$3,927
- Taxable income
- $130
- Est. tax owed @ 24.0%
- −$31
- After-tax cash flow
- $2,007/yr
For passive investors: Depreciation is non-cash, so a rental often shows a tax loss while cash-flowing — sheltering income. Rental losses are passive: they offset passive income freely, and up to $25,000/yr can offset ordinary (W-2) income if you actively participate and your MAGI is under $100k (phasing out to $0 by $150k); unused losses carry forward. On sale, claimed depreciation is recaptured at up to 25%, and gains may owe capital-gains tax (a 1031 exchange can defer both). Figures are a year-1 estimate at your 24.0% rate — not tax advice; consult a CPA.
Schools (NCES district)
- District
- Pinellas
- NCES district ID
- 1201560
- Math proficiency
- 51% ▼ -5.00%
- Reading proficiency
- 51% ▼ -3.00%
- Median HH income
- $46,270
- Composite
- 43.27/100
- National rank
- #3046
- State rank
- #31 of 73 in FL
Livability — Clearwater
- Score
- 82/100
- State rank
- #60
- US rank
- #988
Category grades
Schools grade is shown separately in the Schools card above.
Census & demographics
- County
- Pinellas County · 939,478 people
- City population
- 170,933
- Metro
- Tampa-St. Petersburg-Clearwater, FL
- Population (ZIP)
- 18,290
- Household income
- $74,728
- Rent vs Own
- Severe rent burden
- 336.0
Population outlook (Pinellas County) Hauer SSP2
- Today (2025)
- 1,027,532 people
- By 2030
- 1,063,586 · +3.5%
- By 2040
- 1,125,020 · +9.5%
- By 2050
- 1,168,637 · +13.7%
- By 2075
- 1,265,188 · +23.1%
- By 2100
- 1,260,357 · +22.7%
Race, ethnicity, and origin ACS 2023
- Neighborhood character
- Predominantly White (86%)
- Race & ethnicity
- White 86% Hispanic / Latino 7% Two or more races 6% Asian 4%
- Hispanic origin (detail)
- Puerto Rican 1% Cuban 1%
- Common ancestry
- Romanian 5% Lithuanian 4% Italian 2%
- Foreign-born
- 15% · Canada, Jamaica, Vietnam
- Languages at home
- 83% English-only · Spanish 5% Russian/Polish/Slavic 4% Other Indo-European 3%
Political lean MEDSL · Pinellas
- 2024 margin
- Lean R (+5.2) · D 46.9% · R 52.1%
- 2008→2024 swing
- -13.5pp toward R · 2008: 8.3pp · 2024: -5.2pp
- All cycles
- 2024: R+5.2 2020: D+0.2 2016: R+1.1 2012: D+5.6 2008: D+8.3
Not yet ingested
- Civics
- —
Market trends
- HPI YoY
- ▼ -316.31%
- Current HPI
- 281.6948
- Rent YoY
- ▲ 0.11%
- Metro
- Tampa-St. Petersburg-Clearwater, FL
- State GDP YoY
- ▲ 3.28%
- F500 in state
- 36
Industry mix (Fortune 500 HQ in FL)
| Industry | F500 HQs | Revenue |
|---|---|---|
| Industrial Technology | 2 | $29B |
|
||
| Insurance | 2 | $17B |
|
||
| Retail | 1 | $60B |
|
||
| Technology Distribution | 1 | $58B |
|
||
| Homebuilding | 1 | $35B |
|
||
| Technology Manufacturing | 1 | $35B |
|
||
Price history
+382.1% since first listed3 events — show timeline
- 2026-05-19 Price Changed $135,000 Stellar MLS as Distributed by MLS Grid
- 2026-02-18 Listed $149,900 Stellar MLS as Distributed by MLS Grid
- 2001-11-01 Sold (Public Records) $28,000 Public Records
Property tax history
+7.3%/yrLatest (2025): $1,579 · +3.7% YoY. Source: county tax records.
Cash-flow waterfall
monthlySold comps — $/sqft
last 12 mo · ≤1 miLoading sold comps…