15 Morris Rd · Peekskill, NY
Flood risk 1/10 · Minimal
- FEMA flood zone
- X (unshaded)
- Chance of flooding over 30 yrs
- 0.0%
- Est. flood insurance / yr
- $473 – $860
Fire risk 5/10 · Moderate
- Est. fire insurance / yr
- $691 – $1,283
Heat risk 5/10 · Moderate
- Hot days now (above 100°F)
- 7 days/yr
- Hot days in 30 yrs
- 15 days/yr
Wind risk 4/10 · Minor
- Chance of severe wind over 30 yrs
- 16.0%
Air-quality risk 3/10 · Minor
- Unhealthy air days now
- 2 days/yr
- Unhealthy air days in 30 yrs
- 4 days/yr
Risk factors via First Street. Map © Google.
Why this score? — see what drove the C+ grade
The composite is a weighted blend of 9 inputs, each scored 0–100. Each bar is that input's sub-score; the figure is the points it added to the 100-point composite (weight × sub-score).
- Cash flow +19.9/30.0
- ARV discount +15.0/15.0
- 1% rule +6.8/10.0
- DSCR +6.3/10.0
- Schools +5.9/10.0
- Livability +4.0/5.0
- Rent growth +2.5/5.0
- Condition / age +2.5/5.0
- Appreciation +0.0/10.0
$400,000
🖨 Deal sheet 📄 Offer letter ✓ Due diligence
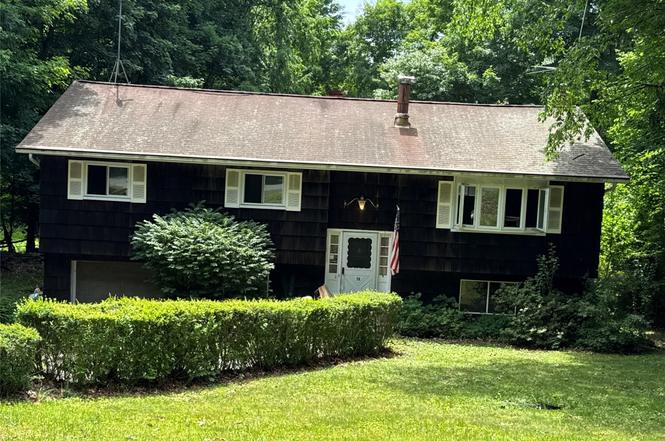
Listing remarks
Diamond in the rough waiting for someone to make it their dream home! Tucked away in a private wooded setting in Continental Village, this 3 bedroom, 3 bathroom home offers 2,568 square feet of living space set on a . 31 acre lot with endless potential for renovation and customization. Main level addition provides extra living space and flexibility featuring a large eat-in kitchen, formal dining room, spacious living room with wood burning stove and a family room. Lower level offers a fireplace, large storage room and additional space with endless possibilities. One car garage and attic storage provide even more room for storage. Enjoy the beauty of every season with a pond around the corne
Key facts
- Large eat-in kitchen
- Formal dining room
- Main level addition
Tags
Property features AI
Exterior
- Parking: Attached parking; Driveway; 1-car garage
- Utilities: Septic tank; Electricity connected
- Home design: Single family residence; Property listed as fixer/estimated condition
- Construction: Shake siding
- Exterior features: Wooded lot
Interior
- Kitchen: No appliances listed
- Bedrooms: Total of 8 rooms (bedroom count not specified)
- Flooring: Hardwood floors
- Bathrooms: 1 full bathroom; 1 half bathroom
- Heating & cooling: Hot water heating; No central air
- Interior features: Eat-in kitchen; Formal dining room; Finished partial basement; Pull-down attic stairs
- Laundry & utility: Laundry in basement
Neighborhood map
What this means for you Summary
Snapshot
- This is a 3-bed/1.5-bath single-family listed at $400k.
Deal economics
- At list price, monthly cash flow is $483 ($6k/yr) — positive.
- The deal already cash-flows at list — no discount required.
- Meets the 1% rule at list price ($5k rent vs $400k).
- Cap rate 7.7% vs local median 3.2% in Peekskill — top-decile yield for the area; either an underpriced asset or a hidden risk that comps aren't pricing in. Stress-test before assuming the spread holds.
Location & tenants
- Location reads 79/100 on livability (#132 in NY, #2,121 nationally) — a middle-class / working-renter tenant base. Strengths: commute A+, health & safety A+, crime A-; Watch: amenities F, cost of living F.
- Lakeland Central School District (suburban): math 60% / reading 70% proficiency, ranked #149 of 590 in NY (top 25%) — acceptable for families but not a draw, mixed tenant base, ~2y average lease; only 12% free/reduced lunch — higher-income household profile.
- Zoned schools: Van Cortlandtville School (math 42% / reading 62%, grade C-, #988 of 2,108 statewide, top 49%, 575 students, 32% FRL); Lakeland-Copper Beech Middle School (math 38% / reading 66%, grade C+, #241 of 729 statewide, top 35%, 1,247 students, 29% FRL); Walter Panas High School (math 97% / reading 82%, grade A+, #265 of 1,100 statewide, top 26%, 901 students, 30% FRL) — zoned schools average 30% FRL vs 12% district-wide (19 pts higher); higher-poverty schools than district average — tighter screening recommended.
- Market conditions: 45 active listings in the ZIP; 142 units permitted in Putnam County in 2024 (75 in 5+ unit buildings).
Forward outlook
- Local home prices are declining (-3.0%/yr); year-one equity from $3k of loan paydown is wiped out by about $12k of value loss. Plan a longer hold.
- Putnam County population projected to shrink 3% by 2050 — rents likely to lag national; underwrite the cash flow, not the appreciation.
Negotiation context
- Only 8 days on market — expect competitive offers; lowballing is unlikely to land.
Risks & watch-outs
- Watch-outs: property tax is 3.0% of price.
- Climate carrying-cost: moderate wildfire risk; extreme-heat days projected 7→15/yr by 2055 (HVAC capex compounding) — expect insurance premiums to compound above CPI over the hold.
Questions for the listing agent
- Built in 1961 — when were the roof, HVAC, electrical panel, plumbing, and water heater last replaced?
- Property tax is high relative to price — has the assessment been appealed recently, and will the sale trigger a re-assessment?
- Is there a deadline driving the sale (1031 exchange, divorce, estate, relocation)? That informs how much negotiation room exists.
- What's the average days-on-market for RENTAL listings here right now (not sales)? A rising rental-DOM trend means longer vacancies and softer asking-rent achievability than the comps imply.
- What's the recent tenant-quality profile in this submarket — average credit score on applications, eviction rate, late-payment / NSF rate, and stable-employment percentage? A property-management company in the area should have these aggregated.
- How much new for-sale + rental construction is in the pipeline within 1–3 miles? Heavy new supply typically softens prices + rents 12–24 months out; constrained supply supports both.
Investment metrics
- 1% rule
- 1.18% ✓
- Cap rate
- 7.74%
- Cash-on-cash
- 5.18%
- DSCR
- 1.23
- GRM
- 7.0
CMA / ARV
- ARV (on-the-fly)
- $695,928
- Comps found
- 5
Show comp detail 5 sales within ~0.75 mi
| Address | Dist | Beds/Ba | Sqft | Sold | Price | $/sf | Match |
|---|---|---|---|---|---|---|---|
| 44 Birch Brook Rd | 0.66mi | 3/3.0 | 2,410 (-6%) | 1mo | $775,000 | $322 | 52 |
| 9 Ernst Rd | 0.24mi | 4/3.0 (+1) | 2,464 (-4%) | 23mo | $708,000 | $287 | 52 |
| 4 Fowler Ave | 0.21mi | 3/3.5 | 2,932 (+14%) | 11mo | $716,000 | $244 | 50 |
| 36 Sylvan Rd | 0.64mi | 4/2.0 (+1) | 2,494 (-3%) | 14mo | $675,000 | $271 | 47 |
| 7 Ox Yoke Rd | 0.71mi | 3/3.0 | 2,788 (+9%) | 4mo | $459,000 | $165 | 43 |
Match score weights: distance 35% · size 25% · config 20% · recency 20%. Top-matched comps best support the ARV.
Projected returns pro-forma
-3.0% appreciation · 3.0% rent growth · sell at horizon
- IRR
- -8.2%
- Equity multiple
- 0.70×
- Total profit
- $-33,666
- Equity at exit
- $59,641
- IRR
- 1.5%
- Equity multiple
- 1.11×
- Total profit
- $11,831
- Equity at exit
- $34,585
Cash invested: $112,000 (down + closing). Projections, not guarantees.
Landlord ↔ Tenant lean methodology
- Overall (STATE)
- 15 Strongly Tenant-Friendly
- State New York
- 15 Strongly Tenant-Friendly · D+10
- County
- — inherits STATE
- City
- — inherits STATE
ZIP-level market 10524
- Home prices YoY
- -10.3%
- Active inventory
- 45
- Price-to-rent
- 7.0×
Monthly cashflow live
- Estimated rent
- $4,732 medium interval (Pro) →
- Mortgage (P&I)
- −$2,098
- Tax from tax record
- −$991 /mo · $11,886/yr
- Insurance
- −$167
- HOA
- −$0
- Vacancy / Maint / Mgmt
- −$994
- Net cashflow
- $483
Break-even live
UW: 25.0% down · 7.5% · 30yr · 1.5% tax · 5.0% vac · 8.0% maint · 8.0% mgmt
Financing live
Cash to close
- Down payment
- $100,000
- Closing costs
- $12,000
- Reserves months
- —
- Total cash needed
- —
Loan-product check · same deal, 3 products live
Conventional
25% down · 7.5% · 30yr
- Down + closing
- —
- Monthly P&I
- —
- Monthly cashflow
- —
- DSCR
- —
- Eligible?
- —
Personal DTI + credit; lowest rate.
DSCR
20% down · 8.5% · 30yr
- Down + closing
- —
- Monthly P&I
- —
- Monthly cashflow
- —
- DSCR
- —
- Eligible?
- —
No personal income docs; deal must DSCR.
Hard money
10% down · 12.0% · 12mo
- Down + closing
- —
- Monthly P&I
- —
- Monthly cashflow
- —
- DSCR
- —
- Eligible?
- —
Short-term bridge; refi at stabilization.
Listing history 6 events
-
2026-06-18days on market $400,000 Active 8 DOM
-
2026-06-17days on market $400,000 Active 7 DOM
-
2026-06-16days on market $400,000 Active 6 DOM
-
2026-06-15days on market $400,000 Active 5 DOM
-
2026-06-13remarks 699-char remark
-
2026-06-13$400,000 Active 3 DOM
ⓘ Source: listings_history table (triggers on properties + properties_extension) + one-shot
backfill from property_details.listing_events for pre-trigger history.
Tax reassessment forecast NY · Partial reset (capped growth)
- Current annual tax
- $11,886 · $991/mo
- Projected year-2 tax
- $11,886 · $991/mo
- Expected delta
- $0/yr ($0/mo · 0.0%)
ⓘ Screening estimate from a state-policy table — verify with the county assessor before closing.
Climate risk First Street
- Flood 1/10 Low FEMA zone X (unshaded) · 0% chance over 30 yrs
- Wildfire 5/10 Major
- Heat 5/10 Major 7 d/yr ≥100°F today · 15 d/yr by 30 yrs out
- Wind 4/10 Moderate 16% chance of damaging wind over 30 yrs
- Air quality 3/10 Moderate 2 unhealthy d/yr today · 4 by 30 yrs out
Nearby sold comps map
Loading sold comps map…
Walkable amenities ~0.75 mi
Loading nearby amenities…
Taxation est. · year 1
- Rental income
- $56,781
- − Mortgage interest
- −$22,406
- − Property taxes
- −$11,886
- − Insurance
- −$2,000
- − Repairs & maintenance
- −$4,542
- − Management
- −$4,542
- − Depreciation
- −$11,636
- Taxable loss
- −$233
- Est. tax savings @ 24.0%
- +$56
- After-tax cash flow
- $5,855/yr
For passive investors: Depreciation is non-cash, so a rental often shows a tax loss while cash-flowing — sheltering income. Rental losses are passive: they offset passive income freely, and up to $25,000/yr can offset ordinary (W-2) income if you actively participate and your MAGI is under $100k (phasing out to $0 by $150k); unused losses carry forward. On sale, claimed depreciation is recaptured at up to 25%, and gains may owe capital-gains tax (a 1031 exchange can defer both). Figures are a year-1 estimate at your 24.0% rate — not tax advice; consult a CPA.
Schools (NCES district)
- District
- Lakeland Central School District
- NCES district ID
- 3616620
- Math proficiency
- 60% ▼ -11.00%
- Reading proficiency
- 70% ▲ 4.00%
- Median HH income
- $91,965
- Composite
- 59.2/100
- National rank
- #944
- State rank
- #149 of 590 in NY
Livability — Peekskill
- Score
- 79/100
- State rank
- #132
- US rank
- #2121
Category grades
Schools grade is shown separately in the Schools card above.
Census & demographics
- City population
- 25,625
- Population (ZIP)
- 4,298
Population outlook (Putnam County) Hauer SSP2
- Today (2025)
- 99,705 people
- By 2030
- 99,650 · -0.1%
- By 2040
- 98,641 · -1.1%
- By 2050
- 96,348 · -3.4%
- By 2075
- 94,412 · -5.3%
- By 2100
- 88,728 · -11.0%
Race, ethnicity, and origin ACS 2023
- Neighborhood character
- Predominantly White (85%)
- Race & ethnicity
- White 85% Hispanic / Latino 8% Two or more races 7% Black 1% Asian 1%
- Hispanic origin (detail)
- Puerto Rican 3% Dominican 1%
- Common ancestry
- Romanian 4% Scotch-Irish 4% Italian 2%
- Foreign-born
- 6% · Canada
- Languages at home
- 91% English-only · Spanish 5% Other Indo-European 2% Russian/Polish/Slavic 1%
Political lean MEDSL · Putnam
- 2024 margin
- R (+13.7) · D 43.2% · R 56.8%
- 2008→2024 swing
- -6.2pp toward R · 2008: -7.5pp · 2024: -13.7pp
- All cycles
- 2024: R+13.7 2020: R+7.9 2016: R+17.8 2012: R+11.2 2008: R+7.5
Not yet ingested
- Civics
- —
Market trends
- HPI YoY
- ▼ -27.97%
- Current HPI
- 243.0481
- Rent YoY
- —
- Metro
- —
- State GDP YoY
- ▲ 2.60%
- F500 in state
- 92
Industry mix (Fortune 500 HQ in NY)
| Industry | F500 HQs | Revenue |
|---|---|---|
| Financial Services | 10 | $950B |
|
||
| Consumer Goods | 9 | $162B |
|
||
| Insurance | 4 | $225B |
|
||
| Telecommunications | 2 | $144B |
|
||
| Pharmaceuticals | 2 | $112B |
|
||
| Media / Entertainment | 2 | $69B |
|
||
Price history
1 event — show timeline
- 2026-06-10 Listed $400,000 OneKey® MLS as Distributed by MLS Grid
Property tax history
+10.7%/yrLatest (2025): $11,886 · +4.1% YoY. Source: county tax records.
Cash-flow waterfall
monthlySold comps — $/sqft
last 12 mo · ≤1 miLoading sold comps…