407 N 2nd St · Garfield, WA
Flood risk 7/10 · Major
- FEMA flood zone
- —
- Chance of flooding over 30 yrs
- 0.99%
- Est. flood insurance / yr
- —
Fire risk 1/10 · Minimal
- Est. fire insurance / yr
- $604 – $1,122
Heat risk 3/10 · Minor
- Hot days now (above 92°F)
- 7 days/yr
- Hot days in 30 yrs
- 15 days/yr
Wind risk 1/10 · Minimal
- Chance of severe wind over 30 yrs
- —
Air-quality risk 7/10 · Major
- Unhealthy air days now
- 12 days/yr
- Unhealthy air days in 30 yrs
- 14 days/yr
Risk factors via First Street. Map © Google.
Why this score? — see what drove the B+ grade
The composite is a weighted blend of 9 inputs, each scored 0–100. Each bar is that input's sub-score; the figure is the points it added to the 100-point composite (weight × sub-score).
- Cash flow +30.0/30.0
- 1% rule +10.0/10.0
- DSCR +10.0/10.0
- ARV discount +7.5/15.0
- Appreciation +6.1/10.0
- Schools +5.2/10.0
- Livability +3.0/5.0
- Rent growth +2.5/5.0
- Condition / age +2.2/5.0
$79,000
🖨 Deal sheet 📄 Offer letter ✓ Due diligence
Listing remarks
MLS# 293795 Huge potential with this spacious . 63 acre lot with mature trees. 24 X 28 shop. Includes parcels 804800000000061, 804800000000068. Buyer to verify all information.
Key facts
- 24 x 28 shop
- 63 acre lot
- Mature trees
Tags
Property features AI
Finance
- Financial info: Annual tax amount listed
Exterior
- Parking: Two total parking spaces; Two covered parking spaces; Two-car garage
- Home design: One-story manufactured home (manufactured-owned lot); New construction
- Construction: Built as a manufactured home
- Exterior features: Lot approximately 0.63 acres (27,442.8 sq ft); Zoned for residential mobile home
Interior
- Bathrooms: Two half bathrooms
- Interior features: No basement
Neighborhood map
What this means for you Summary
Snapshot
- This is a 3-bed/1.0-bath manufactured listed at $79k. Condition is rated fair.
Deal economics
- At list price, monthly cash flow is $454 ($5k/yr) — positive.
- The deal already cash-flows at list — no discount required.
- Meets the 1% rule at list price ($1k rent vs $79k).
Location & tenants
- Location reads 59/100 on livability (#492 in WA) — a working-class tenant base; expect higher turnover. Strengths: cost of living A+, housing A+, schools B+; Watch: health & safety C-, crime F, amenities F.
- Garfield School District (rural): math 50% / reading 70% proficiency, ranked #69 of 291 in WA (top 24%) — acceptable for families but not a draw, mixed tenant base, ~2y average lease.
- Market conditions: 9 active listings in the ZIP; 49 units permitted in Whitman County in 2024 (0 in 5+ unit buildings).
Forward outlook
- In year one you build about $2k of equity ($546 loan paydown + $2k appreciation (2.3% local appreciation)).
- Whitman County population projected at +57% by 2050 — long-run rental-demand tailwind backs the buy-and-hold thesis.
- At projected returns (2.3% appreciation + 3.0% rent growth), your $22k cash investment doubles in ~3 years — after that, you're playing with house money.
Negotiation context
- Only 5 days on market — expect competitive offers; lowballing is unlikely to land.
Risks & watch-outs
- Climate carrying-cost: major flood risk — expect insurance premiums to compound above CPI over the hold.
Questions for the listing agent
- Have any recent inspections been done? Can we get a copy of the seller's disclosures and any deferred-maintenance estimates?
- Built in 1967 — when were the roof, HVAC, electrical panel, plumbing, and water heater last replaced?
- Is there a deadline driving the sale (1031 exchange, divorce, estate, relocation)? That informs how much negotiation room exists.
- Schools are B-rated — typically a magnet for longer-tenancy family renters. What's the average tenant stay here, and is there a school-zone premium baked into asking?
- Crime grade is F in this area — have there been break-ins, vandalism, or insurance claims at this property in the last 3 years? What carrier currently insures it and at what premium?
- What's the average days-on-market for RENTAL listings here right now (not sales)? A rising rental-DOM trend means longer vacancies and softer asking-rent achievability than the comps imply.
- What's the recent tenant-quality profile in this submarket — average credit score on applications, eviction rate, late-payment / NSF rate, and stable-employment percentage? A property-management company in the area should have these aggregated.
- How much new for-sale + rental construction is in the pipeline within 1–3 miles? Heavy new supply typically softens prices + rents 12–24 months out; constrained supply supports both.
Investment metrics
- 1% rule
- 1.60% ✓
- Cap rate
- 13.19%
- Cash-on-cash
- 24.65%
- DSCR
- 2.10
- GRM
- 5.2
CMA / ARV
No comps found within radius.
Projected returns pro-forma
2.26% appreciation · 3.0% rent growth · sell at horizon
- IRR
- 29.3%
- Equity multiple
- 2.60×
- Total profit
- $35,440
- Equity at exit
- $32,297
- IRR
- 30.5%
- Equity multiple
- 5.05×
- Total profit
- $89,537
- Equity at exit
- $47,399
Cash invested: $22,120 (down + closing). Projections, not guarantees.
Landlord ↔ Tenant lean methodology
- Overall (STATE)
- 28 Tenant-Leaning
- State Washington
- 28 Tenant-Leaning · D+8
- County
- — inherits STATE
- City
- — inherits STATE
ZIP-level market 99130
- Home prices YoY
- 1.3%
- Active inventory
- 9
- Price-to-rent
- 5.2×
Monthly cashflow live
- Estimated rent
- $1,266 medium interval (Pro) →
- Mortgage (P&I)
- −$414
- Tax est. 1.5%
- −$99 /mo · $1,185/yr
- Insurance
- −$33
- HOA
- −$0
- Vacancy / Maint / Mgmt
- −$266
- Net cashflow
- $454
Break-even live
UW: 25.0% down · 7.5% · 30yr · 1.5% tax · 5.0% vac · 8.0% maint · 8.0% mgmt
Financing live
Cash to close
- Down payment
- $19,750
- Closing costs
- $2,370
- Reserves months
- —
- Total cash needed
- —
Loan-product check · same deal, 3 products live
Conventional
25% down · 7.5% · 30yr
- Down + closing
- —
- Monthly P&I
- —
- Monthly cashflow
- —
- DSCR
- —
- Eligible?
- —
Personal DTI + credit; lowest rate.
DSCR
20% down · 8.5% · 30yr
- Down + closing
- —
- Monthly P&I
- —
- Monthly cashflow
- —
- DSCR
- —
- Eligible?
- —
No personal income docs; deal must DSCR.
Hard money
10% down · 12.0% · 12mo
- Down + closing
- —
- Monthly P&I
- —
- Monthly cashflow
- —
- DSCR
- —
- Eligible?
- —
Short-term bridge; refi at stabilization.
Listing history 8 events
-
2026-06-18remarks 176-char remark
-
2026-06-18status $79,000 Pending 5 DOM
-
2026-06-17days on market $79,000 Active 5 DOM
-
2026-06-16days on market $79,000 Active 4 DOM
-
2026-06-15days on market $79,000 Active 3 DOM
-
2026-06-15days on market $79,000 Active 2 DOM
-
2026-06-12remarks 164-char remark
-
2026-06-12$79,000 Active 1 DOM
ⓘ Source: listings_history table (triggers on properties + properties_extension) + one-shot
backfill from property_details.listing_events for pre-trigger history.
Climate risk First Street
- Flood 7/10 Severe 99% chance over 30 yrs
- Wildfire 1/10 Low
- Heat 3/10 Moderate 7 d/yr ≥92°F today · 15 d/yr by 30 yrs out
- Wind 1/10 Low
- Air quality 7/10 Severe 12 unhealthy d/yr today · 14 by 30 yrs out
Nearby sold comps map
Loading sold comps map…
Walkable amenities ~0.75 mi
Loading nearby amenities…
Taxation est. · year 1
- Rental income
- $15,194
- − Mortgage interest
- −$4,425
- − Property taxes
- −$1,185
- − Insurance
- −$395
- − Repairs & maintenance
- −$1,216
- − Management
- −$1,216
- − Depreciation
- −$2,298
- Taxable income
- $4,459
- Est. tax owed @ 24.0%
- −$1,070
- After-tax cash flow
- $4,382/yr
For passive investors: Depreciation is non-cash, so a rental often shows a tax loss while cash-flowing — sheltering income. Rental losses are passive: they offset passive income freely, and up to $25,000/yr can offset ordinary (W-2) income if you actively participate and your MAGI is under $100k (phasing out to $0 by $150k); unused losses carry forward. On sale, claimed depreciation is recaptured at up to 25%, and gains may owe capital-gains tax (a 1031 exchange can defer both). Figures are a year-1 estimate at your 24.0% rate — not tax advice; consult a CPA.
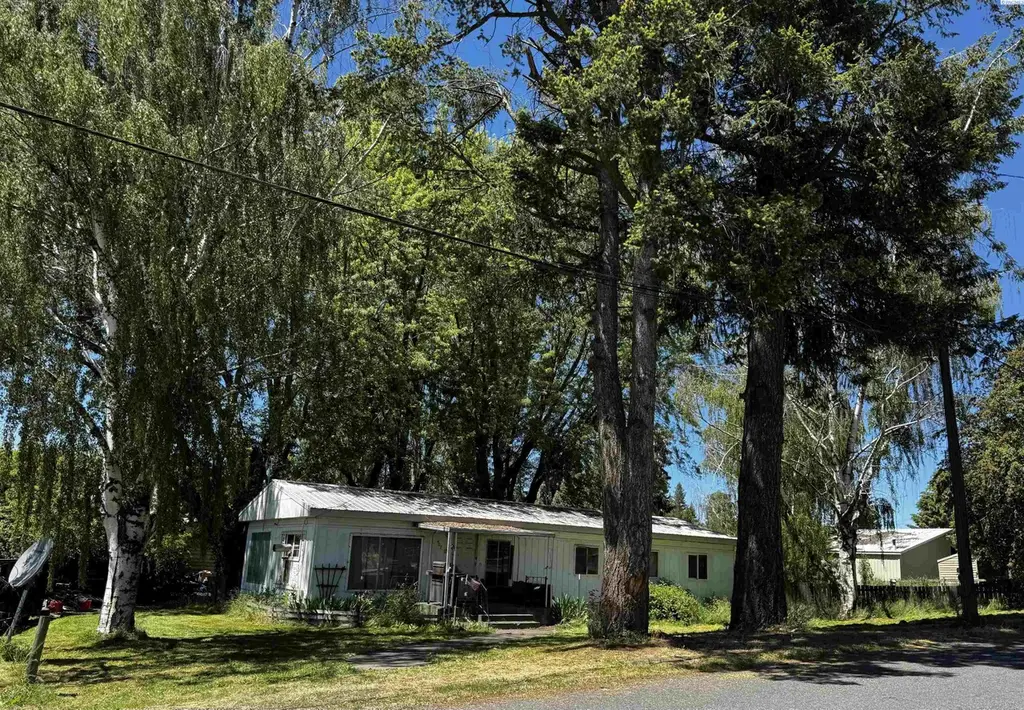
Condition & rehab AI · 7 photos
The property requires moderate renovations, including repairs to the siding and landscaping, to improve its curb appeal and property value.
Repairs flagged
- Major siding — Peeling paint
- Major landscaping — Overgrown vegetation
Value-add opportunities
- Both landscaping — Improves curb appeal and property value
- Both paint exterior walls — Enhances curb appeal and property value
Renovation cost estimate screening
| Repair item | Severity | Est. cost |
|---|---|---|
| siding · Peeling paint | Major | $15,000–50,000 |
| landscaping · Overgrown vegetation | Major | $15,000–50,000 |
| Total estimated repair cost · 2 items | $30,000–100,000 |
Value-add ROI direction
- Both landscaping — Improves curb appeal and property value ↑
- Both paint exterior walls — Enhances curb appeal and property value ↑
ⓘ Cost ranges are severity-bucket heuristics (US national rule-of-thumb). Get contractor quotes + a written scope before underwriting a rehab budget.
Schools (NCES district)
- District
- Garfield School District
- NCES district ID
- 5303000
- Math proficiency
- 50% ▼ -5.00%
- Reading proficiency
- 70% ▼ -5.00%
- Median HH income
- $47,329
- Composite
- 52.39/100
- National rank
- #3420
- State rank
- #69 of 291 in WA
Livability — Garfield
- Score
- 59/100
- State rank
- #492
- US rank
- #20467
Category grades
Schools grade is shown separately in the Schools card above.
Census & demographics
- Census place
- Garfield, WA
- Population (ZIP)
- 847
Population outlook (Whitman County) Hauer SSP2
- Today (2025)
- 57,639 people
- By 2030
- 63,440 · +10.1%
- By 2040
- 75,870 · +31.6%
- By 2050
- 90,294 · +56.7%
- By 2075
- 131,756 · +128.6%
- By 2100
- 169,239 · +193.6%
Race, ethnicity, and origin ACS 2023
- Neighborhood character
- Predominantly White (89%)
- Race & ethnicity
- White 89% Two or more races 10%
- Common ancestry
- Iranian 8% Portuguese 5% Italian 4%
Political lean MEDSL · Whitman
- 2024 margin
- Lean D (+9.0) · D 52.8% · R 43.8% · Other 3.4%
- 2008→2024 swing
- +3.5pp toward D · 2008: 5.5pp · 2024: 9.0pp
- All cycles
- 2024: D+9.0 2020: D+10.0 2016: D+0.5 2012: R+3.7 2008: D+5.5
Not yet ingested
- Civics
- —
Market trends
- HPI YoY
- ▲ 2.26%
- Current HPI
- 171.9793
- Rent YoY
- —
- Metro
- —
- State GDP YoY
- ▲ 4.65%
- F500 in state
- 22
Industry mix (Fortune 500 HQ in WA)
| Industry | F500 HQs | Revenue |
|---|---|---|
| Retail | 2 | $269B |
|
||
| Technology / Retail | 1 | $638B |
|
||
| Technology | 1 | $245B |
|
||
| Telecommunications | 1 | $38B |
|
||
| Food / Beverage | 1 | $36B |
|
||
| Automotive / Trucks | 1 | $34B |
|
||
Price history
1 event — show timeline
- 2026-06-12 Listed $79,000 PACMLS
Cash-flow waterfall
monthlySold comps — $/sqft
last 12 mo · ≤1 miLoading sold comps…