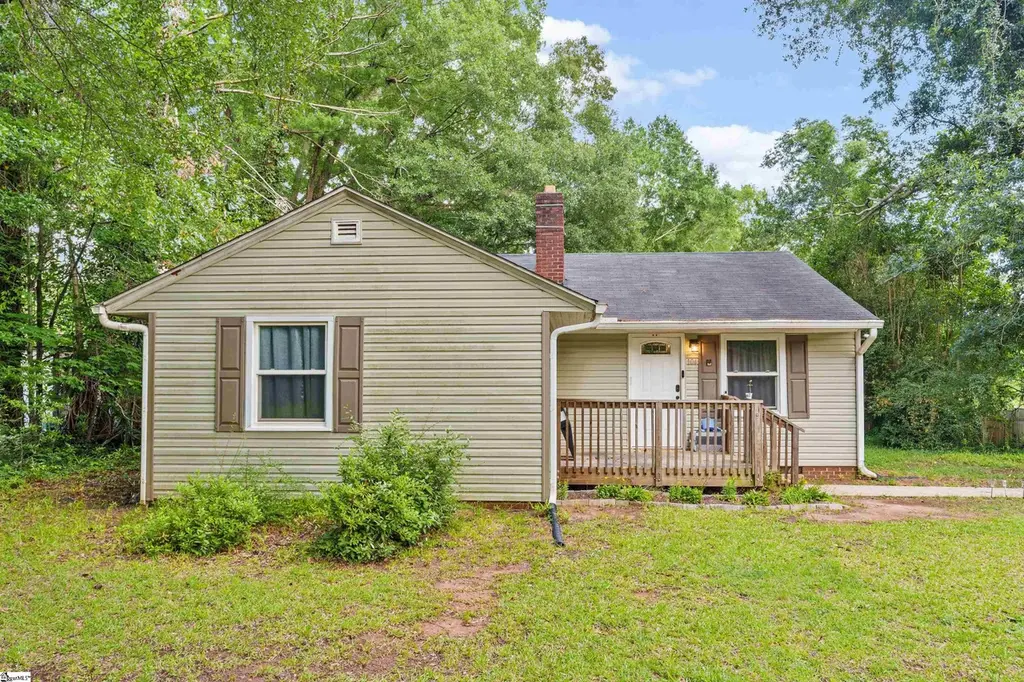
104 Carolyn Dr · Spartanburg, SC
Flood risk 1/10 · Minimal
- FEMA flood zone
- X (unshaded)
- Chance of flooding over 30 yrs
- 0.0%
- Est. flood insurance / yr
- $507 – $1,088
Fire risk 2/10 · Minimal
- Est. fire insurance / yr
- $783 – $1,453
Heat risk 6/10 · Moderate
- Hot days now (above 105°F)
- 7 days/yr
- Hot days in 30 yrs
- 16 days/yr
Wind risk 2/10 · Minimal
- Chance of severe wind over 30 yrs
- 2.0%
Air-quality risk 4/10 · Minor
- Unhealthy air days now
- 4 days/yr
- Unhealthy air days in 30 yrs
- 4 days/yr
Risk factors via First Street. Map © Google.
Why this score? — see what drove the B- grade
The composite is a weighted blend of 9 inputs, each scored 0–100. Each bar is that input's sub-score; the figure is the points it added to the 100-point composite (weight × sub-score).
- Cash flow +23.8/30.0
- ARV discount +15.0/15.0
- DSCR +7.7/10.0
- 1% rule +5.9/10.0
- Livability +3.8/5.0
- Rent growth +3.4/5.0
- Schools +3.1/10.0
- Condition / age +2.5/5.0
- Appreciation +0.0/10.0
$160,000
🖨 Deal sheet (PDF) 📄 Offer letter ✓ Due diligence
Listing remarks MLS
Lots of potential for this 3 bedroom, 1 bath bungalow. Home features gas heat, central air, hardwood floors and an open floor plan. Great investment.
Key facts
- Single level
- Outdoor entertaining
- Front porch
Tags
Property features AI
Finance
- HOA & community: No HOA fees
Exterior
- Parking: Driveway parking (paved and unpaved); No garage
- Utilities: Public water; Public sewer; Public garbage pickup; Electric power
- Home design: Single-story home; Built in 1953; Crawl space foundation; Vinyl siding exterior; Composition shingle roof; Residential property disclosure required; Lead-based paint disclosure required
- Construction: Built in 1953; Vinyl siding; Composition shingle roof; Crawl space foundation
- Exterior features: Front porch; Deck; Level to gently sloped lot with some trees
Interior
- Kitchen: Kitchen (12 x 12); Refrigerator; Electric oven; Convection microwave
- Bedrooms: Primary bedroom on main level (15 x 13); Second bedroom (13 x 12); Third bedroom (13 x 12); Three bedrooms on the main level
- Flooring: Laminate flooring
- Bathrooms: One full bathroom (on main level)
- Heating & cooling: Natural gas heating; Electric cooling; Electric water heater
- Interior features: Ceiling fan; Smoke detector; Laminate countertops; Gas log fireplace (1)
- Laundry & utility: Laundry on first floor; Attic storage
Neighborhood map
What this means for you Summary
Snapshot
- This is a 4-bed/1.0-bath single-family listed at $160k.
Deal economics
- At list price, monthly cash flow is $306 ($4k/yr) — positive.
- The deal already cash-flows at list — no discount required.
- Meets the 1% rule at list price ($2k rent vs $160k).
- Recommended offer: $158k (1.5% below list) — sets the bar for market timing.
- Cap rate 8.6% vs local median 3.9% in Spartanburg — top-decile yield for the area; either an underpriced asset or a hidden risk that comps aren't pricing in. Stress-test before assuming the spread holds.
Location & tenants
- Location reads 76/100 on livability (#24 in SC, #3,679 nationally) — a middle-class / working-renter tenant base. Strengths: amenities A+, commute A+, cost of living A+; Watch: crime F, employment F.
- Spartanburg 07 (urban): math 34% / reading 41% proficiency, ranked #39 of 80 in SC (top 49%) — families likely to look elsewhere, expect single-tenant / working-renter base with shorter leases; 62% free/reduced lunch — lower-income household profile, screen leases tightly.
- Zoned schools: Pine St. Elementary (math 70% / reading 69%, grade A-, #38 of 597 statewide, top 7%, 646 students, 39% FRL); Spartanburg High (math 67% / reading 79%, grade B+, #44 of 196 statewide, top 23%, 2,056 students, 85% FRL) — zoned schools at 62% FRL track the district average.
- Zoned-school proficiency averages 71% at this address vs 38% district-wide (+34 pts) — the actual schools serving this property are materially stronger than the Spartanburg 07 average implies; a family-tenant draw the district grade alone would hide.
- Market conditions: Rents rising (+3.5%/yr); 236 active listings in the ZIP; 3 comparable units currently listed for rent nearby; rentals at typical pace (median 23d on market — plan ~3-4 weeks tenant-placement turnaround); lower-income renter base — watch delinquency; 3,129 units permitted in Spartanburg County in 2024 (40 in 5+ unit buildings).
- At $1,748/mo this rent would consume 51% of the median local household income ($41k/yr) (locally 1064% of renters already pay >50% of income on rent) — very limited rent-growth headroom before tenants either downsize or default.
Forward outlook
- Local home prices are declining (-3.0%/yr); year-one equity from $1k of loan paydown is wiped out by about $5k of value loss. Plan a longer hold.
- Spartanburg County population projected at +18% by 2050 — long-run rental-demand tailwind backs the buy-and-hold thesis.
Negotiation context
- It's been on market 19 days — a 2% lower offer ($158k) is reasonable based on typical stale-listing flexibility.
- 3 sale attempts since 7y ago with the ask held roughly flat each time — persistent listings suggest the price (not the market) is what's stuck; bring a comps-based counter.
Risks & watch-outs
- Watch-outs: built in 1953 — expect roof / HVAC / electrical / plumbing capex.
- Climate carrying-cost: extreme-heat days projected 7→16/yr by 2055 (HVAC capex compounding) — expect insurance premiums to compound above CPI over the hold.
Questions for the listing agent
- Built in 1953 — when were the roof, HVAC, electrical panel, plumbing, and water heater last replaced?
- Is there a deadline driving the sale (1031 exchange, divorce, estate, relocation)? That informs how much negotiation room exists.
- Schools are D-rated, which usually means shorter tenancies and higher turnover. Who's the typical renter profile here, and what's been the actual vacancy rate?
- Crime grade is F in this area — have there been break-ins, vandalism, or insurance claims at this property in the last 3 years? What carrier currently insures it and at what premium?
- What's the average days-on-market for RENTAL listings here right now (not sales)? A rising rental-DOM trend means longer vacancies and softer asking-rent achievability than the comps imply.
- What's the recent tenant-quality profile in this submarket — average credit score on applications, eviction rate, late-payment / NSF rate, and stable-employment percentage? A property-management company in the area should have these aggregated.
- How much new for-sale + rental construction is in the pipeline within 1–3 miles? Heavy new supply typically softens prices + rents 12–24 months out; constrained supply supports both.
Investment metrics
- 1% rule
- 1.09% ✓
- Cap rate
- 8.59%
- Cash-on-cash
- 8.21%
- DSCR
- 1.37
- GRM
- 7.6
CMA / ARV
- ARV (on-the-fly)
- $200,408
- Comps found
- 12
Show comp detail 12 sales within ~0.75 mi
| Address | Dist | Beds/Ba | Sqft | Sold | Price | $/sf | Match |
|---|---|---|---|---|---|---|---|
| 524 Caulder Ave | 0.11mi | 3/2.0 (-1) | 1,240 (+2%) | 1mo | $252,000 | $203 | 83 |
| 136 Prospect Ave | 0.35mi | 3/2.0 (-1) | 1,097 (-10%) | 2mo | $180,600 | $165 | 57 |
| 290 Caulder Cir | 0.53mi | 3/3.0 (-1) | 1,271 (+4%) | 0mo | $220,000 | $173 | 55 |
| 815 S Liberty St | 0.67mi | 3/2.0 (-1) | 1,253 (+2%) | 1mo | $195,000 | $156 | 55 |
| 111 Kreswell Cir | 0.75mi | 3/1.5 (-1) | 1,250 (+2%) | 2mo | $147,000 | $118 | 53 |
| 306 Carolyn Dr | 0.22mi | 3/2.5 (-1) | 1,364 (+12%) | 7mo | $258,000 | $189 | 53 |
| 226 Woodview Ave Ave | 0.23mi | 3/2.5 (-1) | 1,400 (+15%) | 2mo | $230,000 | $164 | 52 |
| 106 Nevada St | 0.43mi | 3/1.0 (-1) | 1,041 (-15%) | 1mo | $119,900 | $115 | 49 |
| 207 High St | 0.28mi | 3/2.5 (-1) | 1,401 (+15%) | 4mo | $259,000 | $185 | 48 |
| 425 E Shore Dr | 0.59mi | 3/1.5 (-1) | 1,320 (+8%) | 6mo | $177,500 | $134 | 48 |
| 101 Beth Ct | 0.50mi | 3/1.5 (-1) | 1,398 (+14%) | 1mo | $179,000 | $128 | 44 |
| 120 First Ave Ave | 0.73mi | 3/2.0 (-1) | 1,100 (-10%) | 2mo | $135,000 | $123 | 38 |
Match score weights: distance 35% · size 25% · config 20% · recency 20%. Top-matched comps best support the ARV.
Projected returns pro-forma
-3.0% appreciation · 3.46% rent growth · sell at horizon
- IRR
- -3.3%
- Equity multiple
- 0.88×
- Total profit
- $-5,591
- Equity at exit
- $23,857
- IRR
- 6.9%
- Equity multiple
- 1.53×
- Total profit
- $23,656
- Equity at exit
- $13,834
Cash invested: $44,800 (down + closing). Projections, not guarantees.
Landlord ↔ Tenant lean methodology
- Overall (STATE)
- 90 Strongly Landlord-Friendly
- State South Carolina
- 90 Strongly Landlord-Friendly · R+6
- County
- — inherits STATE
- City
- — inherits STATE
ZIP-level market 29306
- Home prices YoY
- -29.9%
- Rents YoY
- 3.5%
- Active inventory
- 236
- Price-to-rent
- 7.6×
Monthly cashflow live
- Estimated rent
- $1,748 medium interval (Pro) →
- Mortgage (P&I)
- −$839
- Tax from tax record
- −$168 /mo · $2,021/yr
- Insurance
- −$67
- HOA
- −$0
- Vacancy / Maint / Mgmt
- −$367
- Net cashflow
- $306
Break-even live
Sensitivity live
| Price | -10% $397 | -5% $352 | +0% $306 | +5% $261 | +10% $216 |
|---|---|---|---|---|---|
| Rent | -10% $168 | -5% $237 | +0% $306 | +5% $375 | +10% $444 |
| Rate | -1.0pp $387 | -0.5pp $347 | base $306 | +0.5pp $265 | +1.0pp $223 |
UW: 25.0% down · 7.5% · 30yr · 1.5% tax · 5.0% vac · 8.0% maint · 8.0% mgmt
Financing live
Cash to close
- Down payment
- $40,000
- Closing costs
- $4,800
- Reserves months
- —
- Total cash needed
- —
Loan-product check · same deal, 3 products live
Conventional
25% down · 7.5% · 30yr
- Down + closing
- —
- Monthly P&I
- —
- Monthly cashflow
- —
- DSCR
- —
- Eligible?
- —
Personal DTI + credit; lowest rate.
DSCR
20% down · 8.5% · 30yr
- Down + closing
- —
- Monthly P&I
- —
- Monthly cashflow
- —
- DSCR
- —
- Eligible?
- —
No personal income docs; deal must DSCR.
Hard money
10% down · 12.0% · 12mo
- Down + closing
- —
- Monthly P&I
- —
- Monthly cashflow
- —
- DSCR
- —
- Eligible?
- —
Short-term bridge; refi at stabilization.
Rent comps 3 comps
| Address | Beds | Baths | Sqft | Rent | $/sqft | DOM | Units | Dist |
|---|---|---|---|---|---|---|---|---|
| 249 E Hampton Ave Spartanburg, SC | 3.0 | 2.0 | 1450 | $1,475 | $1.02 | 23d | 1 | 0.99mi |
| 318 Alexander Ave Spartanburg, SC | 4.0 | 2.0 | 1480 | $1,695 | $1.15 | 23d | 1 | 1.01mi |
| 717 Connecticut Ave Spartanburg, SC | 3.0 | 1.0 | 1320 | $1,895 | $1.44 | 15d | 1 | 1.31mi |
Listing history 13 events
-
2026-06-21days on market $160,000 Active 19 DOM
-
2026-06-18days on market $160,000 Active 16 DOM
-
2026-06-17days on market $160,000 Active 15 DOM
-
2026-06-16days on market $160,000 Active 14 DOM
-
2026-06-15days on market $160,000 Active 13 DOM
-
2026-06-14days on market $160,000 Active 11 DOM
-
2026-06-13days on market $160,000 Active 10 DOM
-
2026-06-10days on market $160,000 Active 8 DOM
-
2026-06-09days on market $160,000 Active 7 DOM
-
2026-06-08days on market $160,000 Active 6 DOM
-
2026-06-07days on market $160,000 Active 5 DOM
-
2026-06-03remarks 699-char remark
-
2026-06-03$160,000 Active 1 DOM
ⓘ Source: listings_history table (triggers on properties + properties_extension) + one-shot
backfill from property_details.listing_events for pre-trigger history.
Tax reassessment forecast SC · Resets to sale price
- Current annual tax
- $2,021 · $168/mo
- Projected year-2 tax
- $2,021 · $168/mo
- Expected delta
- $0/yr ($0/mo · 0.0%)
ⓘ Screening estimate from a state-policy table — verify with the county assessor before closing.
Climate risk First Street
- Flood 1/10 Low FEMA zone X (unshaded) · 0% chance over 30 yrs
- Wildfire 2/10 Low
- Heat 6/10 Major 7 d/yr ≥105°F today · 16 d/yr by 30 yrs out
- Wind 2/10 Low 2% chance of damaging wind over 30 yrs
- Air quality 4/10 Moderate 4 unhealthy d/yr today · 4 by 30 yrs out
Nearby sold comps map
Loading sold comps map…
Walkable amenities ~0.75 mi
Loading nearby amenities…
Taxation est. · year 1
- Rental income
- $20,970
- − Mortgage interest
- −$8,962
- − Property taxes
- −$2,021
- − Insurance
- −$800
- − Repairs & maintenance
- −$1,678
- − Management
- −$1,678
- − Depreciation
- −$4,655
- Taxable income
- $1,177
- Est. tax owed @ 24.0%
- −$283
- After-tax cash flow
- $3,395/yr
For passive investors: Depreciation is non-cash, so a rental often shows a tax loss while cash-flowing — sheltering income. Rental losses are passive: they offset passive income freely, and up to $25,000/yr can offset ordinary (W-2) income if you actively participate and your MAGI is under $100k (phasing out to $0 by $150k); unused losses carry forward. On sale, claimed depreciation is recaptured at up to 25%, and gains may owe capital-gains tax (a 1031 exchange can defer both). Figures are a year-1 estimate at your 24.0% rate — not tax advice; consult a CPA.
Schools (NCES district)
- District
- Spartanburg 07
- NCES district ID
- 4503660
- Math proficiency
- 34% ▼ -1.00%
- Reading proficiency
- 41% ▼ -1.00%
- Median HH income
- $35,825
- Composite
- 31.04/100
- National rank
- #6087
- State rank
- #39 of 80 in SC
Livability — Spartanburg
- Score
- 76/100
- State rank
- #24
- US rank
- #3679
Category grades
Schools grade is shown separately in the Schools card above.
Census & demographics
- Census place
- Spartanburg, SC
- County
- Spartanburg County · 258,607 people
- City population
- 120,406
- Metro
- Spartanburg, SC
- Population (ZIP)
- 16,714
- Household income
- $41,356
- Rent vs Own
- Severe rent burden
- 1064.0
Population outlook (Spartanburg County) Hauer SSP2
- Today (2025)
- 325,495 people
- By 2030
- 338,800 · +4.1%
- By 2040
- 363,471 · +11.7%
- By 2050
- 384,156 · +18.0%
- By 2075
- 430,137 · +32.1%
- By 2100
- 442,733 · +36.0%
Race, ethnicity, and origin ACS 2023
- Neighborhood character
- Diverse neighborhood (Simpson 0.61)
- Race & ethnicity
- Black 50% White 36% Hispanic / Latino 10% Two or more races 9% Asian 1%
- Hispanic origin (detail)
- Mexican 7% Puerto Rican 2%
- Common ancestry
- Slovak 1% Serbian 1% Iranian 1%
- Foreign-born
- 7% · Canada
- Languages at home
- 90% English-only · Spanish 7% Other Indo-European 2%
Political lean MEDSL · Spartanburg
- 2024 margin
- Solid R (+33.6) · D 32.6% · R 66.2% · Other 1.2%
- 2008→2024 swing
- -12.0pp toward R · 2008: -21.6pp · 2024: -33.6pp
- All cycles
- 2024: R+33.6 2020: R+27.3 2016: R+30.0 2012: R+23.1 2008: R+21.6
Not yet ingested
- Civics
- —
Market trends
- HPI YoY
- ▼ -90.67%
- Current HPI
- 213.1266
- Rent YoY
- ▲ 3.46%
- Metro
- Spartanburg, SC
- State GDP YoY
- ▲ 4.51%
- F500 in state
- 2
Industry mix (Fortune 500 HQ in SC)
| Industry | F500 HQs | Revenue |
|---|---|---|
| Packaging | 1 | $7B |
|
||
Price history
+540.0% since first listed8 events — show timeline
- 2026-06-02 Listed $160,000 Greater Greenville MLS
- 2024-02-07 Sold (Public Records) $166,000 Public Records
- 2020-01-17 Sold (MLS) $45,000 Greater Greenville MLS
- 2019-12-05 Pending — Greater Greenville MLS
- 2019-11-11 Relisted — Greater Greenville MLS
- 2019-11-07 Contingent — Greater Greenville MLS
- 2019-10-04 Listed $45,000 Greater Greenville MLS
- 1987-05-01 Sold (Public Records) $25,000 Public Records
Property tax history
+19.7%/yrLatest (2025): $2,021 · -36.6% YoY. Source: county tax records.
Cash-flow waterfall
monthlySold comps — $/sqft
last 12 mo · ≤1 miLoading sold comps…