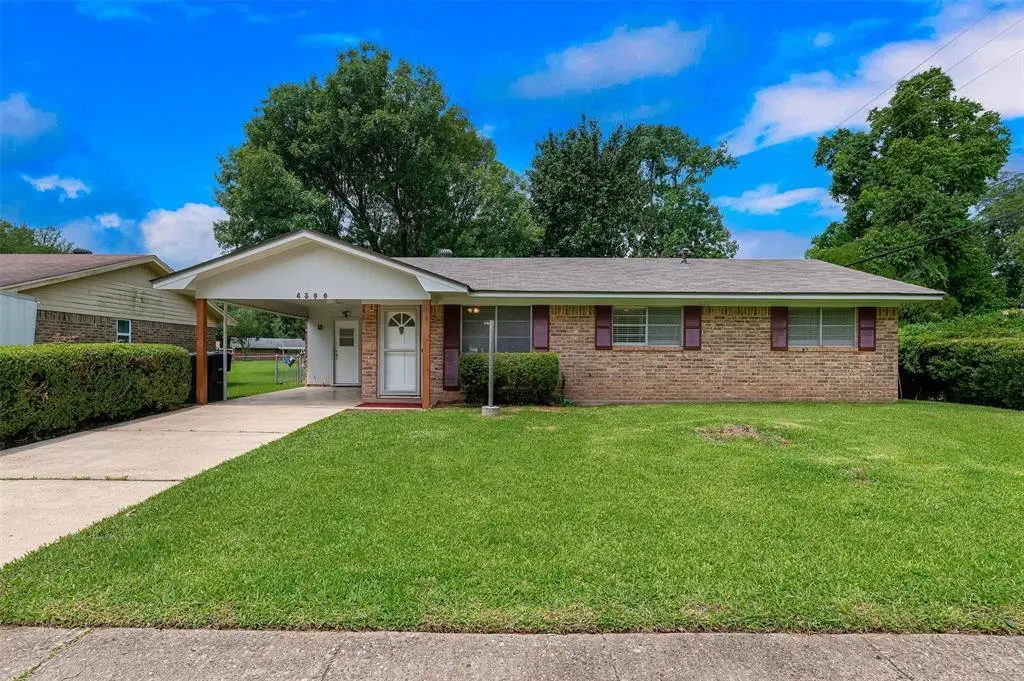
4300 Helene St · Bossier City, LA
Flood risk 1/10 · Minimal
- FEMA flood zone
- X
- Chance of flooding over 30 yrs
- 0.0%
- Est. flood insurance / yr
- $507 – $1,088
Fire risk 3/10 · Minor
- Est. fire insurance / yr
- $1,269 – $2,357
Heat risk 7/10 · Major
- Hot days now (above 110°F)
- 7 days/yr
- Hot days in 30 yrs
- 22 days/yr
Wind risk 6/10 · Moderate
- Chance of severe wind over 30 yrs
- 73.0%
Air-quality risk 2/10 · Minimal
- Unhealthy air days now
- 1 days/yr
- Unhealthy air days in 30 yrs
- 2 days/yr
Risk factors via First Street. Map © Google.
Why this score? — see what drove the C grade
The composite is a weighted blend of 9 inputs, each scored 0–100. Each bar is that input's sub-score; the figure is the points it added to the 100-point composite (weight × sub-score).
- Cash flow +20.7/30.0
- ARV discount +9.3/15.0
- DSCR +6.6/10.0
- 1% rule +5.5/10.0
- Schools +3.8/10.0
- Livability +3.6/5.0
- Rent growth +3.4/5.0
- Condition / age +2.5/5.0
- Appreciation +0.0/10.0
$145,500
🖨 Deal sheet (PDF) 📄 Offer letter ✓ Due diligence
Listing remarks
Completely remodeled and move-in ready! This beautifully updated home features new flooring, fresh paint, new interior doors, updated lighting and ceiling fans throughout, creating a modern and inviting feel. The kitchen shines with granite countertops, a stylish new backsplash, and a new gas oven to be installed prior to closing. Additional updates include new blinds throughout the home and a new toilet, offering both comfort and peace of mind. With so many recent improvements, this home is the perfect blend of style, function, and value.
Key facts
- Remodeled
- Fresh paint
- New flooring
Tags
Property features AI
Finance
- Financial info: No second mortgage; Loan type treated as clear
- HOA & community: No association
Exterior
- Parking: Carport; 1 covered parking space; Driveway; Off-street parking; 1 carport space
- Utilities: City water; City sewer; Not in a municipal utility district
- Home design: Single family residence; Residential property; One level; Not attached; Year built in 1968; Preowned
- Construction: Brick construction; Composition roof; Slab foundation
- Exterior features: Covered porch(es); Covered patio/porch; Exterior lighting; Outdoor storage; Back yard fencing; Chain link fence; Full yard fence; Large backyard with grass; Many trees
Interior
- Kitchen: Microwave; Refrigerator
- Bedrooms: 3 bedrooms (primary bedroom on main level)
- Flooring: Ceramic tile
- Bathrooms: 1 full bath; 1 half bath
- Interior features: Built-in features; Decorative lighting; Window coverings; One living area; One dining area; Two total rooms
- Laundry & utility: Utility room
Neighborhood map
What this means for you Summary
Snapshot
- This is a 3-bed/1.5-bath single-family listed at $146k.
Deal economics
- At list price, monthly cash flow is $196 ($2k/yr) — positive.
- The deal already cash-flows at list — no discount required.
- Meets the 1% rule at list price ($2k rent vs $146k).
- Cap rate 7.9% vs local median 4.7% in Bossier City — top-decile yield for the area; either an underpriced asset or a hidden risk that comps aren't pricing in. Stress-test before assuming the spread holds.
Location & tenants
- Location reads 71/100 on livability (#47 in LA) — a middle-class / working-renter tenant base. Strengths: commute A+, cost of living A+, housing A+; Watch: employment D+, crime F, amenities F.
- Bossier Parish (urban): math 40% / reading 47% proficiency, ranked #17 of 98 in LA (top 17%) — families likely to look elsewhere, expect single-tenant / working-renter base with shorter leases.
- Zoned schools: Sun City Elementary School (math 47% / reading 52%, grade D, #129 of 646 statewide, top 21%, 567 students, 55% FRL); Elm Grove Middle School (math 29% / reading 47%, grade F, #73 of 218 statewide, top 34%, 952 students, 57% FRL); Parkway High School (math 25% / reading 51%, grade F, #90 of 265 statewide, top 34%, 1,360 students, 48% FRL).
- Market conditions: Rents rising (+3.6%/yr); 148 active listings in the ZIP; 8 comparable units currently listed for rent nearby; rentals lingering (median 45d on market — plan ~5-8 weeks vacancy on turnover, expect pricing pressure); 50% of comp listings sitting > 30 days — soft ceiling on asking rent; 716 units permitted in Bossier Parish in 2024 (0 in 5+ unit buildings).
Forward outlook
- Local home prices are declining (-3.0%/yr); year-one equity from $1k of loan paydown is wiped out by about $4k of value loss. Plan a longer hold.
- Bossier County population projected at +28% by 2050 — long-run rental-demand tailwind backs the buy-and-hold thesis.
Negotiation context
- Only 3 days on market — expect competitive offers; lowballing is unlikely to land.
Risks & watch-outs
- Climate carrying-cost: major wind risk, 73% chance of damaging wind over 30y; extreme-heat days projected 7→22/yr by 2055 (HVAC capex compounding) — expect insurance premiums to compound above CPI over the hold.
Questions for the listing agent
- Built in 1968 — when were the roof, HVAC, electrical panel, plumbing, and water heater last replaced?
- Is there a deadline driving the sale (1031 exchange, divorce, estate, relocation)? That informs how much negotiation room exists.
- Schools are B-rated — typically a magnet for longer-tenancy family renters. What's the average tenant stay here, and is there a school-zone premium baked into asking?
- Crime grade is F in this area — have there been break-ins, vandalism, or insurance claims at this property in the last 3 years? What carrier currently insures it and at what premium?
- What's the average days-on-market for RENTAL listings here right now (not sales)? A rising rental-DOM trend means longer vacancies and softer asking-rent achievability than the comps imply.
- What's the recent tenant-quality profile in this submarket — average credit score on applications, eviction rate, late-payment / NSF rate, and stable-employment percentage? A property-management company in the area should have these aggregated.
- How much new for-sale + rental construction is in the pipeline within 1–3 miles? Heavy new supply typically softens prices + rents 12–24 months out; constrained supply supports both.
Investment metrics
- 1% rule
- 1.05% ✓
- Cap rate
- 7.91%
- Cash-on-cash
- 5.78%
- DSCR
- 1.26
- GRM
- 8.0
CMA / ARV
- ARV (on-the-fly)
- $151,434
- Comps found
- 12
Show comp detail 12 sales within ~0.75 mi
| Address | Dist | Beds/Ba | Sqft | Sold | Price | $/sf | Match |
|---|---|---|---|---|---|---|---|
| 4215 Evelyn St | 0.10mi | 3/1.0 | 1,085 (+1%) | 4mo | $165,000 | $152 | 88 |
| 2044 Orbit Dr | 0.28mi | 3/1.5 | 1,087 (+1%) | 1mo | $149,000 | $137 | 84 |
| 4216 Evelyn St | 0.09mi | 3/1.0 | 1,172 (+9%) | 2mo | $164,900 | $141 | 77 |
| 1920 Alison Ave | 0.09mi | 3/1.0 | 990 (-8%) | 5mo | $137,500 | $139 | 77 |
| 2102 Orbit Dr | 0.31mi | 3/1.5 | 1,151 (+7%) | 0mo | $167,500 | $146 | 73 |
| 2037 Orbit Dr | 0.24mi | 3/1.0 | 1,180 (+10%) | 1mo | $159,999 | $136 | 69 |
| 5310 Aster St | 0.60mi | 3/1.0 | 1,052 (-2%) | 0mo | $150,000 | $143 | 67 |
| 513 Linnhurst Dr | 0.46mi | 3/2.0 | 1,134 (+6%) | 1mo | $210,000 | $185 | 66 |
| 5310 Aster St | 0.60mi | 3/1.0 | 1,052 (-2%) | 2mo | $95,000 | $90 | 65 |
| 2104 Gen Forrest Dr | 0.67mi | 3/1.0 | 1,019 (-5%) | 2mo | $97,000 | $95 | 57 |
| 5305 Daffodil Ave | 0.50mi | 3/1.0 | 966 (-10%) | 5mo | $138,000 | $143 | 54 |
| 1408 Azalea St | 0.58mi | 3/1.0 | 1,215 (+13%) | 5mo | $149,900 | $123 | 45 |
Match score weights: distance 35% · size 25% · config 20% · recency 20%. Top-matched comps best support the ARV.
Projected returns pro-forma
-3.0% appreciation · 3.6% rent growth · sell at horizon
- IRR
- -6.7%
- Equity multiple
- 0.75×
- Total profit
- $-10,130
- Equity at exit
- $21,695
- IRR
- 3.7%
- Equity multiple
- 1.28×
- Total profit
- $11,206
- Equity at exit
- $12,580
Cash invested: $40,740 (down + closing). Projections, not guarantees.
Landlord ↔ Tenant lean methodology
- Overall (STATE)
- 90 Strongly Landlord-Friendly
- State Louisiana
- 90 Strongly Landlord-Friendly · R+12
- County
- — inherits STATE
- City
- — inherits STATE
ZIP-level market 71112
- Rents YoY
- 3.6%
- Active inventory
- 148
- Price-to-rent
- 8.0×
Monthly cashflow live
- Estimated rent
- $1,521 high interval (Pro) →
- Mortgage (P&I)
- −$763
- Tax est. 1.5%
- −$182 /mo · $2,182/yr
- Insurance
- −$61
- HOA
- −$0
- Vacancy / Maint / Mgmt
- −$319
- Net cashflow
- $196
Break-even live
Sensitivity live
| Price | -10% $297 | -5% $247 | +0% $196 | +5% $146 | +10% $96 |
|---|---|---|---|---|---|
| Rent | -10% $76 | -5% $136 | +0% $196 | +5% $256 | +10% $316 |
| Rate | -1.0pp $270 | -0.5pp $233 | base $196 | +0.5pp $159 | +1.0pp $120 |
UW: 25.0% down · 7.5% · 30yr · 1.5% tax · 5.0% vac · 8.0% maint · 8.0% mgmt
Financing live
Cash to close
- Down payment
- $36,375
- Closing costs
- $4,365
- Reserves months
- —
- Total cash needed
- —
Loan-product check · same deal, 3 products live
Conventional
25% down · 7.5% · 30yr
- Down + closing
- —
- Monthly P&I
- —
- Monthly cashflow
- —
- DSCR
- —
- Eligible?
- —
Personal DTI + credit; lowest rate.
DSCR
20% down · 8.5% · 30yr
- Down + closing
- —
- Monthly P&I
- —
- Monthly cashflow
- —
- DSCR
- —
- Eligible?
- —
No personal income docs; deal must DSCR.
Hard money
10% down · 12.0% · 12mo
- Down + closing
- —
- Monthly P&I
- —
- Monthly cashflow
- —
- DSCR
- —
- Eligible?
- —
Short-term bridge; refi at stabilization.
Rent comps 8 comps
| Address | Beds | Baths | Sqft | Rent | $/sqft | DOM | Units | Dist |
|---|---|---|---|---|---|---|---|---|
| 4223 Elaine St Bossier City, LA | 3.0 | 1.0 | 1030 | $1,475 | $1.43 | 45d | 1 | 0.23mi |
| 1711 San Saba St Bossier City, LA | 3.0 | 1.5 | 1119 | $1,250 | $1.12 | 22d | 1 | 0.48mi |
| 1401 Gardenia St Bossier City, LA | 2.0 | 1.0 | 878 | $1,100 | $1.25 | 22d | 1 | 0.66mi |
| 4708 Longstreet Pl Bossier City, LA | 3.0 | 1.5 | 1108 | $1,500 | $1.35 | 45d | 1 | 0.70mi |
| 4720 Longstreet Pl Bossier City, LA | 3.0 | 2.0 | 1407 | $1,500 | $1.07 | 46d | 1 | 0.73mi |
| 3979 Stuart Ave Bossier City, LA | 3.0 | 1.5 | 1135 | $1,300 | $1.15 | 15d | 1 | 0.88mi |
| 5005 Longstreet Pl Unit 19 Bossier City, LA | 2.0 | 2.0 | 1200 | $1,500 | $1.25 | 22d | 1 | 1.28mi |
| 5005 Longstreet Pl #72 Bossier City, LA | 3.0 | 2.0 | 1309 | $1,650 | $1.26 | 45d | 1 | 1.28mi |
Listing history 2 events
-
2026-06-07remarks 545-char remark
-
2026-06-07$145,500 Pending 3 DOM
ⓘ Source: listings_history table (triggers on properties + properties_extension) + one-shot
backfill from property_details.listing_events for pre-trigger history.
Climate risk First Street
- Flood 1/10 Low FEMA zone X · 0% chance over 30 yrs
- Wildfire 3/10 Moderate
- Heat 7/10 Severe 7 d/yr ≥110°F today · 22 d/yr by 30 yrs out
- Wind 6/10 Major 73% chance of damaging wind over 30 yrs
- Air quality 2/10 Low 1 unhealthy d/yr today · 2 by 30 yrs out
Nearby sold comps map
Loading sold comps map…
Walkable amenities ~0.75 mi
Loading nearby amenities…
Taxation est. · year 1
- Rental income
- $18,255
- − Mortgage interest
- −$8,150
- − Property taxes
- −$2,182
- − Insurance
- −$728
- − Repairs & maintenance
- −$1,460
- − Management
- −$1,460
- − Depreciation
- −$4,233
- Taxable income
- $41
- Est. tax owed @ 24.0%
- −$10
- After-tax cash flow
- $2,345/yr
For passive investors: Depreciation is non-cash, so a rental often shows a tax loss while cash-flowing — sheltering income. Rental losses are passive: they offset passive income freely, and up to $25,000/yr can offset ordinary (W-2) income if you actively participate and your MAGI is under $100k (phasing out to $0 by $150k); unused losses carry forward. On sale, claimed depreciation is recaptured at up to 25%, and gains may owe capital-gains tax (a 1031 exchange can defer both). Figures are a year-1 estimate at your 24.0% rate — not tax advice; consult a CPA.
Schools (NCES district)
- District
- Bossier Parish
- NCES district ID
- 2200270
- Math proficiency
- 40% ▼ -32.00%
- Reading proficiency
- 47% ▼ -28.00%
- Median HH income
- $51,326
- Composite
- 37.5/100
- National rank
- #4402
- State rank
- #17 of 98 in LA
Livability — Bossier City
- Score
- 71/100
- State rank
- #47
- US rank
- #7044
Category grades
Schools grade is shown separately in the Schools card above.
Census & demographics
- Census place
- Bossier City, LA
- County
- Bossier Parish · 98,704 people
- City population
- 91,925
- Metro
- Shreveport-Bossier City, LA
- Population (ZIP)
- 33,587
- Household income
- $61,760
- Rent vs Own
- Severe rent burden
- 1391.0
Population outlook (Bossier County) Hauer SSP2
- Today (2025)
- 143,247 people
- By 2030
- 151,802 · +6.0%
- By 2040
- 168,194 · +17.4%
- By 2050
- 183,533 · +28.1%
- By 2075
- 217,009 · +51.5%
- By 2100
- 230,091 · +60.6%
Race, ethnicity, and origin ACS 2023
- Neighborhood character
- Diverse neighborhood (Simpson 0.57)
- Race & ethnicity
- White 59% Black 24% Hispanic / Latino 12% Two or more races 8% Asian 2%
- Hispanic origin (detail)
- Mexican 9%
- Common ancestry
- Lithuanian 2% Slovak 1% Scottish 1%
- Foreign-born
- 5% · Canada, Vietnam
- Languages at home
- 89% English-only · Spanish 7% Other Indo-European 1% Tagalog/Filipino 1%
Political lean MEDSL · Bossier
- 2024 margin
- Solid R (+43.3) · D 27.7% · R 71.0% · Other 1.3%
- 2008→2024 swing
- +0.3pp no change · 2008: -43.7pp · 2024: -43.3pp
- All cycles
- 2024: R+43.3 2020: R+41.0 2016: R+45.8 2012: R+45.4 2008: R+43.7
Not yet ingested
- Civics
- —
Market trends
- HPI YoY
- ▼ -77.48%
- Current HPI
- 127.9821
- Rent YoY
- ▲ 3.60%
- Metro
- Shreveport-Bossier City, LA
- State GDP YoY
- ▲ 3.29%
- F500 in state
- 10
Industry mix (Fortune 500 HQ in LA)
| Industry | F500 HQs | Revenue |
|---|---|---|
| Telecommunications | 2 | $23B |
|
||
| Utilities | 1 | $12B |
|
||
| Wholesale / Distribution | 1 | $5B |
|
||
| Advertising | 1 | $2B |
|
||
Price history
2 events — show timeline
- 2026-06-07 Pending — NTREIS
- 2026-06-04 Listed $145,500 NTREIS
Property tax history
-0.0%/yrLatest (2023): $92 · -1.5% YoY. Source: county tax records.
Cash-flow waterfall
monthlySold comps — $/sqft
last 12 mo · ≤1 miLoading sold comps…