 🏷️ Likely Rental
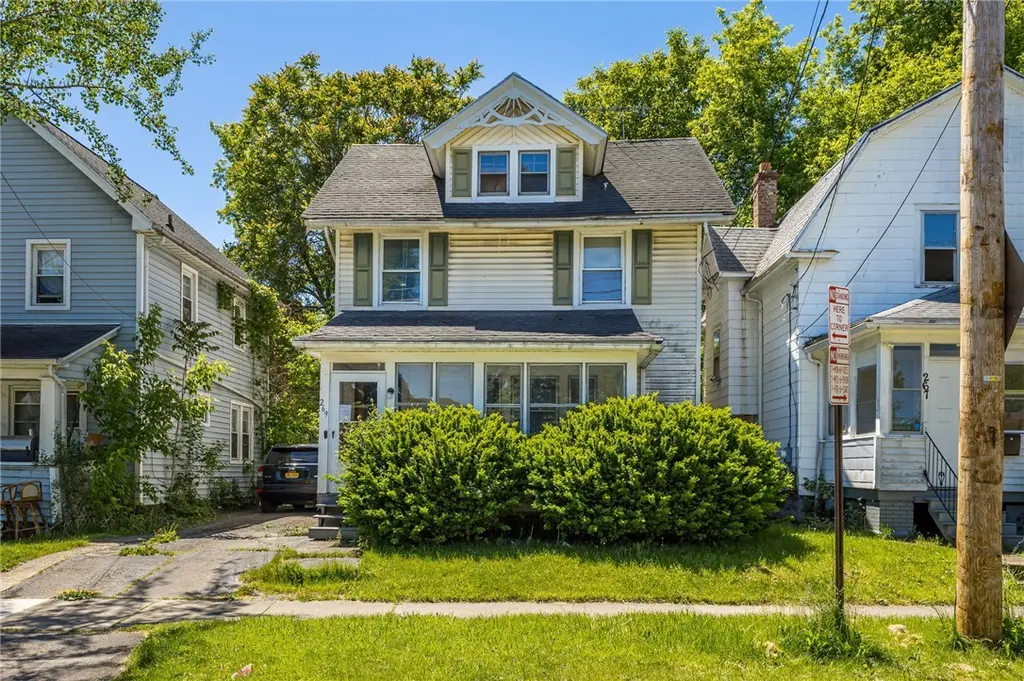
269 Fernwood Ave · Rochester, NY
Flood risk 1/10 · Minimal
- FEMA flood zone
- X (unshaded)
- Chance of flooding over 30 yrs
- 0.0%
- Est. flood insurance / yr
- $473 – $860
Fire risk 1/10 · Minimal
- Est. fire insurance / yr
- $691 – $1,283
Heat risk 2/10 · Minimal
- Hot days now (above 95°F)
- 7 days/yr
- Hot days in 30 yrs
- 15 days/yr
Wind risk 1/10 · Minimal
- Chance of severe wind over 30 yrs
- —
Air-quality risk 2/10 · Minimal
- Unhealthy air days now
- 1 days/yr
- Unhealthy air days in 30 yrs
- 2 days/yr
Risk factors via First Street. Map © Google.
Why this score? — see what drove the B grade
The composite is a weighted blend of 9 inputs, each scored 0–100. Each bar is that input's sub-score; the figure is the points it added to the 100-point composite (weight × sub-score).
- Cash flow +29.3/30.0
- ARV discount +15.0/15.0
- DSCR +10.0/10.0
- 1% rule +7.5/10.0
- Rent growth +4.7/5.0
- Livability +3.8/5.0
- Condition / age +2.5/5.0
- Schools +1.9/10.0
- Appreciation +0.0/10.0
$125,000
🖨 Deal sheet 📄 Offer letter ✓ Due diligence
Listing remarks
NO DELAYED Attention investors and owner-occupants! This 3-bedroom, 1.5-bath home offers a great opportunity to add to your portfolio or move right in. This property offers flexibility and value, currently rented for $1,300 per month with a month-to-month tenant, the next owner can continue collecting rental income or make the home their own. Inside you'll find classic Rochester charm including original hardwood floors, natural woodwork, spacious living and dining rooms, and an enclosed front porch perfect for enjoying your morning coffee. Upstairs offers generous bedroom space plus a walk-up attic providing excellent storage or future expansion potential. Outside, enjoy a detached garage,
Key facts
- Natural woodwork
- Private driveway
- Walk-up attic
Tags
Property features AI
Exterior
- Parking: Detached garage; Approximately 1.5 garage spaces
- Utilities: Public water connected; Sewer connected
- Home design: 2-story; Resale property
- Construction: Vinyl siding; Block foundation; Existing structure
- Exterior features: Blacktop driveway; Porch; Screened porch; Near public transit; Rectangular lot (33 x 99)
Interior
- Kitchen: Gas water heater; See remarks for additional kitchen details
- Bedrooms: 6 rooms total (includes living room and laundry)
- Flooring: Hardwood; Vinyl; Varies
- Bathrooms: 1 full bathroom
- Heating & cooling: Gas forced-air heating
- Interior features: Separate formal dining room; Separate formal living room; Full basement
- Laundry & utility: Laundry in basement
Neighborhood map
What this means for you Summary
Snapshot
- This is a 3-bed/1.5-bath single-family listed at $125k.
Deal economics
- At list price, monthly cash flow is $439 ($5k/yr) — positive.
- The deal already cash-flows at list — no discount required.
- Meets the 1% rule at list price ($2k rent vs $125k).
- Recommended offer: $123k (1.5% below list) — sets the bar for market timing.
Location & tenants
- Location reads 76/100 on livability (#222 in NY, #3,482 nationally) — a middle-class / working-renter tenant base. Strengths: commute A+, cost of living A+, housing A+; Watch: schools D+, crime F, employment F.
- Rochester City School District (urban): math 21% / reading 26% proficiency, ranked #589 of 590 in NY (top 100%) — low school quality limits family demand, transient renter base, plan for 1-2y turnover; 82% free/reduced lunch — lower-income household profile, screen leases tightly.
- Market conditions: Rents rising fast (+8.9%/yr); 114 active listings in the ZIP; 40 comparable units currently listed for rent nearby; rentals at typical pace (median 19d on market — plan ~3-4 weeks tenant-placement turnaround); lower-income renter base — watch delinquency; 1,169 units permitted in Monroe County in 2024 (591 in 5+ unit buildings).
- At $1,566/mo this rent would consume 53% of the median local household income ($35k/yr) (locally 2756% of renters already pay >50% of income on rent) — very limited rent-growth headroom before tenants either downsize or default.
Forward outlook
- Local home prices are declining (-3.0%/yr); year-one equity from $864 of loan paydown is wiped out by about $4k of value loss. Plan a longer hold.
- Monroe County population projected to shrink 6% by 2050 — rents likely to lag national; underwrite the cash flow, not the appreciation.
- At projected returns (-3.0% appreciation + 8.0% rent growth), your $35k cash investment doubles in ~6 years — after that, you're playing with house money.
Negotiation context
- It's been on market 16 days — a 2% lower offer ($123k) is reasonable based on typical stale-listing flexibility.
- Current owner paid $40k; list at $125k implies a 213% gain — meaningful room to come down on a strong offer.
Risks & watch-outs
- Watch-outs: built in 1910 — expect roof / HVAC / electrical / plumbing capex.
Questions for the listing agent
- Built in 1910 — when were the roof, HVAC, electrical panel, plumbing, and water heater last replaced?
- Is there a deadline driving the sale (1031 exchange, divorce, estate, relocation)? That informs how much negotiation room exists.
- Schools are D-rated, which usually means shorter tenancies and higher turnover. Who's the typical renter profile here, and what's been the actual vacancy rate?
- Crime grade is F in this area — have there been break-ins, vandalism, or insurance claims at this property in the last 3 years? What carrier currently insures it and at what premium?
- What's the average days-on-market for RENTAL listings here right now (not sales)? A rising rental-DOM trend means longer vacancies and softer asking-rent achievability than the comps imply.
- What's the recent tenant-quality profile in this submarket — average credit score on applications, eviction rate, late-payment / NSF rate, and stable-employment percentage? A property-management company in the area should have these aggregated.
- How much new for-sale + rental construction is in the pipeline within 1–3 miles? Heavy new supply typically softens prices + rents 12–24 months out; constrained supply supports both.
Investment metrics
- 1% rule
- 1.25% ✓
- Cap rate
- 10.50%
- Cash-on-cash
- 15.04%
- DSCR
- 1.67
- GRM
- 6.7
CMA / ARV
- ARV (on-the-fly)
- $163,442
- Comps found
- 12
Show comp detail 12 sales within ~0.75 mi
| Address | Dist | Beds/Ba | Sqft | Sold | Price | $/sf | Match |
|---|---|---|---|---|---|---|---|
| 201 Arbutus St | 0.31mi | 4/1.5 (+1) | 1,180 (+2%) | 0mo | $210,000 | $178 | 76 |
| 1824 Clifford Ave | 0.50mi | 3/1.0 | 1,188 (+3%) | 2mo | $62,500 | $53 | 68 |
| 82 Willmont St | 0.46mi | 2/1.0 (-1) | 1,100 (-4%) | 1mo | $155,000 | $141 | 63 |
| 116 Barberry | 0.50mi | 4/2.0 (+1) | 1,220 (+6%) | 2mo | $175,000 | $143 | 58 |
| 157 Cummings St | 0.50mi | 3/2.0 | 1,272 (+10%) | 2mo | $250,000 | $197 | 56 |
| 865 N Goodman St | 0.55mi | 4/1.5 (+1) | 1,245 (+8%) | 2mo | $76,000 | $61 | 54 |
| 62 Sylvester St | 0.63mi | 3/1.5 | 1,036 (-10%) | 2mo | $195,000 | $188 | 53 |
| 51 Sylvester St | 0.60mi | 3/1.0 | 1,040 (-10%) | 2mo | $90,000 | $87 | 52 |
| 207 Herald St | 0.55mi | 3/2.0 | 1,288 (+12%) | 1mo | $60,000 | $47 | 52 |
| 93 Willmont St | 0.48mi | 2/2.0 (-1) | 1,022 (-11%) | 2mo | $145,000 | $142 | 50 |
| 265 Springfield Ave | 0.73mi | 4/1.5 (+1) | 1,268 (+10%) | 0mo | $200,000 | $158 | 44 |
| 1271 North St | 0.74mi | 4/1.5 (+1) | 1,276 (+11%) | 2mo | $128,900 | $101 | 41 |
Match score weights: distance 35% · size 25% · config 20% · recency 20%. Top-matched comps best support the ARV.
Projected returns pro-forma
-3.0% appreciation · 8.0% rent growth · sell at horizon
- IRR
- 10.9%
- Equity multiple
- 1.46×
- Total profit
- $15,946
- Equity at exit
- $18,638
- IRR
- 23.5%
- Equity multiple
- 3.50×
- Total profit
- $87,459
- Equity at exit
- $10,808
Cash invested: $35,000 (down + closing). Projections, not guarantees.
Landlord ↔ Tenant lean methodology
- Overall (STATE)
- 15 Strongly Tenant-Friendly
- State New York
- 15 Strongly Tenant-Friendly · D+10
- County
- — inherits STATE
- City
- — inherits STATE
ZIP-level market 14621
- Home prices YoY
- -4.0%
- Rents YoY
- 8.9%
- Active inventory
- 114
- Price-to-rent
- 6.7×
Monthly cashflow live
- Estimated rent
- $1,566 high interval (Pro) →
- Mortgage (P&I)
- −$656
- Tax from tax record
- −$91 /mo · $1,087/yr
- Insurance
- −$52
- HOA
- −$0
- Vacancy / Maint / Mgmt
- −$329
- Net cashflow
- $439
Break-even live
UW: 25.0% down · 7.5% · 30yr · 1.5% tax · 5.0% vac · 8.0% maint · 8.0% mgmt
Financing live
Cash to close
- Down payment
- $31,250
- Closing costs
- $3,750
- Reserves months
- —
- Total cash needed
- —
Loan-product check · same deal, 3 products live
Conventional
25% down · 7.5% · 30yr
- Down + closing
- —
- Monthly P&I
- —
- Monthly cashflow
- —
- DSCR
- —
- Eligible?
- —
Personal DTI + credit; lowest rate.
DSCR
20% down · 8.5% · 30yr
- Down + closing
- —
- Monthly P&I
- —
- Monthly cashflow
- —
- DSCR
- —
- Eligible?
- —
No personal income docs; deal must DSCR.
Hard money
10% down · 12.0% · 12mo
- Down + closing
- —
- Monthly P&I
- —
- Monthly cashflow
- —
- DSCR
- —
- Eligible?
- —
Short-term bridge; refi at stabilization.
Rent comps 40 comps
| Address | Beds | Baths | Sqft | Rent | $/sqft | DOM | Units | Dist |
|---|---|---|---|---|---|---|---|---|
| 47 Priscilla St Rochester, NY | 4.0 | 1.5 | 1250 | $1,900 | $1.52 | 21d | 1 | 0.19mi |
| 25 Trust St Rochester, NY | 3.0 | 1.5 | 1003 | $1,600 | $1.60 | 3d | 1 | 0.40mi |
| 52 Frances St Rochester, NY | 4.0 | 1.0 | 1256 | $1,595 | $1.27 | 43d | 1 | 0.42mi |
| 127 Carter St #125 Rochester, NY | 2.0 | 1.0 | 1320 | $1,400 | $1.06 | 43d | 1 | 0.48mi |
| 86-88 Baycliff Dr Unit 86 Rochester, NY | 2.0 | 1.0 | 900 | $1,030 | $1.14 | 21d | 1 | 0.49mi |
| 326 Northland Ave Rochester, NY | 3.0 | 1.0 | 1168 | $1,500 | $1.28 | 2d | 1 | 0.52mi |
| 171 Mohawk St Rochester, NY | 3.0 | 2.0 | 1054 | $1,775 | $1.68 | 43d | 1 | 0.56mi |
| 1890 Clifford Ave Rochester, NY | 3.0 | 1.0 | 936 | $1,800 | $1.92 | 23d | 1 | 0.56mi |
| 222 Ellison St Rochester, NY | 2.0 | 1.0 | 971 | $1,000 | $1.03 | 14d | 1 | 0.58mi |
| 16 Cummings St Rochester, NY | 2.0 | 1.0 | 782 | $1,250 | $1.60 | 19d | 1 | 0.58mi |
| 16 Cummings St Rochester, NY | 2.0 | 1.0 | 782 | $1,250 | $1.60 | 43d | 1 | 0.58mi |
| — Rochester, NY | 2.0 | 1.0 | 896 | $1,100 | $1.23 | 14d | 1 | 0.58mi |
| 147 5th St Rochester, NY | 4.0 | 1.0 | 1289 | $1,950 | $1.51 | 21d | 1 | 0.59mi |
| 176 Roycroft Dr Rochester, NY | 3.0 | 1.0 | 1169 | $950 | $0.81 | 10d | 1 | 0.67mi |
| 21 Portland Ct Rochester, NY | 2.0 | 1.0 | 850 | $1,210 | $1.42 | 43d | 1 | 0.74mi |
| 117 Northaven Ter Rochester, NY | 4.0 | 2.0 | 1460 | $1,975 | $1.35 | 10d | 1 | 0.87mi |
| 32 Portland Pkwy Rochester, NY | 2.0 | 1.0 | 652 | $1,485 | $2.28 | 2d | 8 | 0.89mi |
| 195 Parsells Ave Rochester, NY | 4.0 | 1.0 | 1413 | $1,265 | $0.90 | 3d | 1 | 0.96mi |
| 100 Fairbanks St Rochester, NY | 2.0 | 1.0 | 1456 | $1,100 | $0.76 | 44d | 1 | 0.97mi |
| 95 Onondaga Rd Rochester, NY | 1.0–2.0 | 1.0 | 825 | $1,630 | $1.98 | 2d | 1 | 1.00mi |
| 239 Weyl St Rochester, NY | 3.0 | 1.0 | 1208 | $1,600 | $1.32 | 19d | 1 | 1.04mi |
| 500 Garson Ave Rochester, NY | 2.0 | 1.0 | 740 | $1,050 | $1.42 | 3d | 1 | 1.06mi |
| 2145 Norton St Rochester, NY | 2.0 | 1.0 | 700 | $902 | $1.29 | 43d | 1 | 1.09mi |
| 14 Beechwood St Rochester, NY | 2.0 | 1.0 | 850 | $1,200 | $1.41 | 23d | 1 | 1.12mi |
| 36 Charwood Cir Irondequoit, NY | 2.0 | 1.0–1.5 | 1000 | $1,675 | $1.68 | 43d | 3 | 1.15mi |
| 36 Charwood Cir Irondequoit, NY | 1.0–2.0 | 1.0–1.5 | 930 | $2,005 | $2.16 | 2d | 9 | 1.15mi |
| 420 Rosewood Ter Rochester, NY | 3.0 | 1.0 | 1246 | $1,300 | $1.04 | 3d | 1 | 1.15mi |
| 459-461 Parsells Ave Rochester, NY | 2.0 | 1.0 | 1053 | $1,450 | $1.38 | 23d | 1 | 1.16mi |
| 182 Laurelton Rd Unit 182 Rochester, NY | 2.0 | 1.5 | 1000 | $1,600 | $1.60 | 10d | 1 | 1.22mi |
| 11 Maria St Unit 1 DN Rochester, NY | 2.0 | 1.0 | 800 | $895 | $1.12 | 43d | 1 | 1.25mi |
| 1159 Culver Rd Unit A2 UP Rochester, NY | 3.0 | 1.0 | 1313 | $1,500 | $1.14 | 43d | 1 | 1.25mi |
| 50 Harwick Rd Rochester, NY | 1.0–2.0 | 1.0 | 687 | $1,350 | $1.96 | 3d | 3 | 1.28mi |
| 56 Brambury Dr Rochester, NY | 1.0–2.0 | 1.0 | 720 | $1,425 | $1.98 | 10d | 1 | 1.31mi |
| 2362 Culver Rd Irondequoit, NY | 1.0–2.0 | 1.0 | 675 | $1,455 | $2.16 | 2d | 3 | 1.37mi |
| 405 Alexander St Rochester, NY | 2.0 | 1.0 | 800 | $1,425 | $1.78 | 3d | 1 | 1.41mi |
| 2450 Culver Rd Rochester, NY | 3.0 | 1.5 | 1380 | $2,400 | $1.74 | 3d | 1 | 1.42mi |
| 1196 E Ridge Rd Rochester, NY | 1.0–2.0 | 1.0 | 800 | $1,265 | $1.58 | 23d | 1 | 1.44mi |
| 2519 Culver Rd Rochester, NY | 1.0–2.0 | 1.0 | 800 | $1,395 | $1.74 | 10d | 4 | 1.44mi |
| 395 Alexander St Unit UN12 Rochester, NY | 2.0 | 1.5 | 1226 | $2,200 | $1.79 | 14d | 1 | 1.45mi |
| 250 Anderson Ave Rochester, NY | 2.0 | 1.0 | 832 | $1,675 | $2.01 | 43d | 1 | 1.47mi |
Listing history 13 events
-
2026-06-18days on market $125,000 Active 16 DOM
-
2026-06-17days on market $125,000 Active 15 DOM
-
2026-06-16days on market $125,000 Active 14 DOM
-
2026-06-15days on market $125,000 Active 13 DOM
-
2026-06-13days on market $125,000 Active 11 DOM
-
2026-06-13days on market $125,000 Active 10 DOM
-
2026-06-10days on market $125,000 Active 8 DOM
-
2026-06-09days on market $125,000 Active 7 DOM
-
2026-06-09days on market $125,000 Active 6 DOM
-
2026-06-07days on market $125,000 Active 5 DOM
-
2026-06-05days on market $125,000 Active 2 DOM
-
2026-06-03remarks 699-char remark
-
2026-06-03$125,000 Active 1 DOM
ⓘ Source: listings_history table (triggers on properties + properties_extension) + one-shot
backfill from property_details.listing_events for pre-trigger history.
Tax reassessment forecast NY · Partial reset (capped growth)
- Current annual tax
- $1,087 · $91/mo
- Projected year-2 tax
- $1,600 · $133/mo
- Expected delta
- +$513/yr (+$43/mo · 47.2%)
ⓘ Screening estimate from a state-policy table — verify with the county assessor before closing.
Climate risk First Street
- Flood 1/10 Low FEMA zone X (unshaded) · 0% chance over 30 yrs
- Wildfire 1/10 Low
- Heat 2/10 Low 7 d/yr ≥95°F today · 15 d/yr by 30 yrs out
- Wind 1/10 Low
- Air quality 2/10 Low 1 unhealthy d/yr today · 2 by 30 yrs out
Nearby sold comps map
Loading sold comps map…
Walkable amenities ~0.75 mi
Loading nearby amenities…
Taxation est. · year 1
- Rental income
- $18,788
- − Mortgage interest
- −$7,002
- − Property taxes
- −$1,087
- − Insurance
- −$625
- − Repairs & maintenance
- −$1,503
- − Management
- −$1,503
- − Depreciation
- −$3,636
- Taxable income
- $3,432
- Est. tax owed @ 24.0%
- −$824
- After-tax cash flow
- $4,441/yr
For passive investors: Depreciation is non-cash, so a rental often shows a tax loss while cash-flowing — sheltering income. Rental losses are passive: they offset passive income freely, and up to $25,000/yr can offset ordinary (W-2) income if you actively participate and your MAGI is under $100k (phasing out to $0 by $150k); unused losses carry forward. On sale, claimed depreciation is recaptured at up to 25%, and gains may owe capital-gains tax (a 1031 exchange can defer both). Figures are a year-1 estimate at your 24.0% rate — not tax advice; consult a CPA.
Schools (NCES district)
- District
- Rochester City School District
- NCES district ID
- 3624750
- Math proficiency
- 21% ▬ 0.00%
- Reading proficiency
- 26% ▲ 4.00%
- Median HH income
- $30,923
- Composite
- 18.98/100
- National rank
- #8850
- State rank
- #589 of 590 in NY
Livability — Rochester
- Score
- 76/100
- State rank
- #222
- US rank
- #3482
Category grades
Schools grade is shown separately in the Schools card above.
Census & demographics
- Census place
- Rochester, NY
- County
- Monroe County · 674,131 people
- City population
- 432,803
- Metro
- Rochester, NY
- Population (ZIP)
- 32,381
- Household income
- $35,383
- Rent vs Own
- Severe rent burden
- 2756.0
Population outlook (Monroe County) Hauer SSP2
- Today (2025)
- 759,460 people
- By 2030
- 757,154 · -0.3%
- By 2040
- 740,644 · -2.5%
- By 2050
- 714,443 · -5.9%
- By 2075
- 645,883 · -15.0%
- By 2100
- 547,084 · -28.0%
Race, ethnicity, and origin ACS 2023
- Neighborhood character
- Diverse neighborhood (Simpson 0.66)
- Race & ethnicity
- Hispanic / Latino 40% Black 40% White 14% Two or more races 12% Asian 1%
- Hispanic origin (detail)
- Mexican 1% Puerto Rican 32% Dominican 3%
- Common ancestry
- Romanian 1% Lithuanian 1% Serbian 1%
- Foreign-born
- 8% · Canada, Jamaica
- Languages at home
- 65% English-only · Spanish 30% Other Asian/Pacific 2% French/Haitian/Cajun 1%
Political lean MEDSL · Monroe
- 2024 margin
- D (+19.1) · D 59.5% · R 40.5%
- 2008→2024 swing
- +1.4pp toward D · 2008: 17.7pp · 2024: 19.1pp
- All cycles
- 2024: D+19.1 2020: D+21.0 2016: D+14.1 2012: D+17.4 2008: D+17.7
Not yet ingested
- Civics
- —
Market trends
- HPI YoY
- ▼ -10.66%
- Current HPI
- 254.1805
- Rent YoY
- ▲ 8.88%
- Metro
- Rochester, NY
- State GDP YoY
- ▲ 2.60%
- F500 in state
- 92
Industry mix (Fortune 500 HQ in NY)
| Industry | F500 HQs | Revenue |
|---|---|---|
| Financial Services | 10 | $950B |
|
||
| Consumer Goods | 9 | $162B |
|
||
| Insurance | 4 | $225B |
|
||
| Telecommunications | 2 | $144B |
|
||
| Pharmaceuticals | 2 | $112B |
|
||
| Media / Entertainment | 2 | $69B |
|
||
Price history
+125.2% since first listed3 events — show timeline
- 2026-06-02 Listed $125,000 UNYREIS
- 2009-12-24 Sold (Public Records) $39,900 Public Records
- 2000-11-22 Sold (Public Records) $55,500 Public Records
Property tax history
+6.3%/yrLatest (2025): $1,087 · +0.0% YoY. Source: county tax records.
Cash-flow waterfall
monthlySold comps — $/sqft
last 12 mo · ≤1 miLoading sold comps…