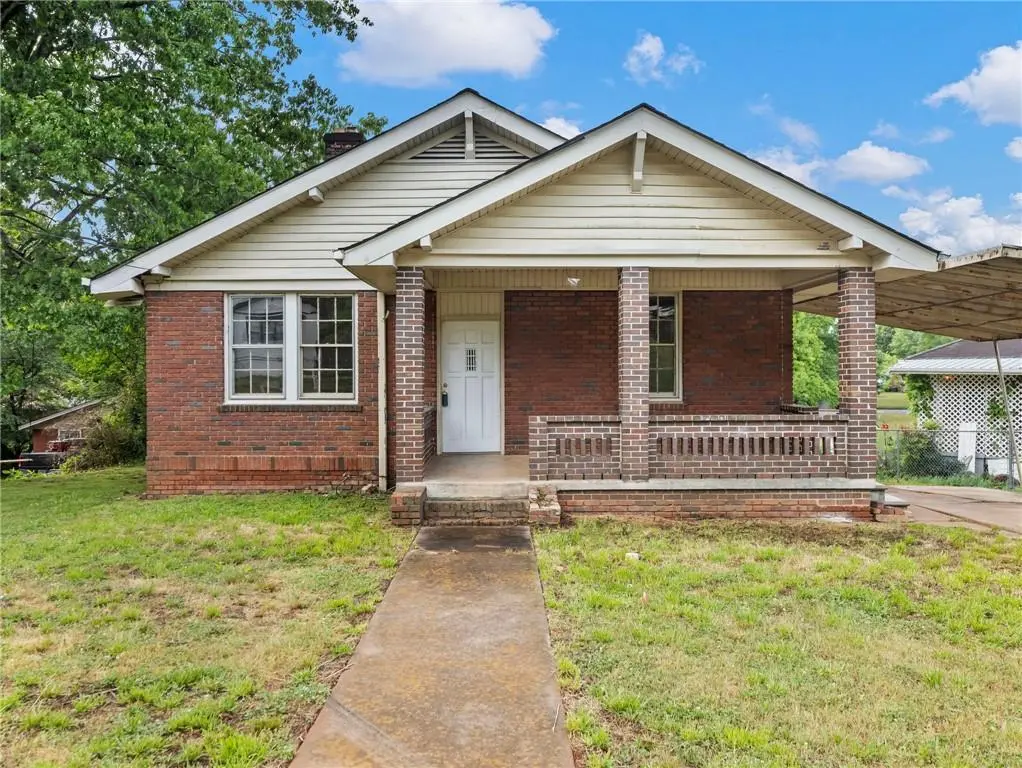
22 C Ave · Gainesville, GA
Flood risk 1/10 · Minimal
- FEMA flood zone
- X (unshaded)
- Chance of flooding over 30 yrs
- 0.0%
- Est. flood insurance / yr
- $473 – $860
Fire risk 2/10 · Minimal
- Est. fire insurance / yr
- $963 – $1,789
Heat risk 4/10 · Minor
- Hot days now (above 102°F)
- 7 days/yr
- Hot days in 30 yrs
- 17 days/yr
Wind risk 4/10 · Minor
- Chance of severe wind over 30 yrs
- 11.0%
Air-quality risk 4/10 · Minor
- Unhealthy air days now
- 3 days/yr
- Unhealthy air days in 30 yrs
- 6 days/yr
Risk factors via First Street. Map © Google.
Why this score? — see what drove the C+ grade
The composite is a weighted blend of 9 inputs, each scored 0–100. Each bar is that input's sub-score; the figure is the points it added to the 100-point composite (weight × sub-score).
- Cash flow +24.3/30.0
- ARV discount +15.0/15.0
- DSCR +7.8/10.0
- 1% rule +5.4/10.0
- Livability +3.3/5.0
- Schools +2.7/10.0
- Condition / age +2.5/5.0
- Rent growth +1.3/5.0
- Appreciation +0.0/10.0
$199,900
🖨 Deal sheet 📄 Offer letter ✓ Due diligence
Listing remarks MLS
Great opportunity to fix up a piece of history in the heart of Gainesville. Call today to schedule an appointment!
Key facts
- 0.23 acre lot
- 2 parking spots
- Built 1926
Neighborhood map
What this means for you Summary
Snapshot
- This is a 3-bed/1.0-bath single-family listed at $200k.
Deal economics
- At list price, monthly cash flow is $403 ($5k/yr) — positive.
- The deal already cash-flows at list — no discount required.
- Meets the 1% rule at list price ($2k rent vs $200k).
- Recommended offer: $194k (3.0% below list) — sets the bar for market timing.
- Cap rate 8.7% vs local median 2.7% in Gainesville — top-decile yield for the area; either an underpriced asset or a hidden risk that comps aren't pricing in. Stress-test before assuming the spread holds.
Location & tenants
- Location reads 66/100 on livability (#181 in GA) — a middle-class / working-renter tenant base. Strengths: housing A+, cost of living A-; Watch: amenities D+, schools F, crime F.
- Hall County (rural): math 28% / reading 33% proficiency, ranked #81 of 174 in GA (top 47%) — families likely to look elsewhere, expect single-tenant / working-renter base with shorter leases.
- Market conditions: Rents falling (-4.7%/yr); 252 active listings in the ZIP; 17 comparable units currently listed for rent nearby; rentals at typical pace (median 21d on market — plan ~3-4 weeks tenant-placement turnaround); solid renter incomes; 2,274 units permitted in Hall County in 2024 (620 in 5+ unit buildings).
- This rent runs 33% of the median local income ($76k/yr) — at the standard rent-burdened threshold; future hikes will face affordability resistance.
Forward outlook
- Local home prices are declining (-3.0%/yr); year-one equity from $1k of loan paydown is wiped out by about $6k of value loss. Plan a longer hold.
- Hall County population projected at +30% by 2050 — long-run rental-demand tailwind backs the buy-and-hold thesis.
Negotiation context
- It's been on market 33 days — a 3% lower offer ($194k) is reasonable based on typical stale-listing flexibility.
- 2 sale attempts with the ask held roughly flat each time — persistent listings suggest the price (not the market) is what's stuck; bring a comps-based counter.
Risks & watch-outs
- Watch-outs: built in 1926 — expect roof / HVAC / electrical / plumbing capex.
Questions for the listing agent
- It's been on market 33 days. Have you received any prior offers? Is the seller open to a 3% concession, seller financing, or rate buy-down credit?
- Built in 1926 — when were the roof, HVAC, electrical panel, plumbing, and water heater last replaced?
- Is there a deadline driving the sale (1031 exchange, divorce, estate, relocation)? That informs how much negotiation room exists.
- Schools are F-rated, which usually means shorter tenancies and higher turnover. Who's the typical renter profile here, and what's been the actual vacancy rate?
- Crime grade is F in this area — have there been break-ins, vandalism, or insurance claims at this property in the last 3 years? What carrier currently insures it and at what premium?
- What's the average days-on-market for RENTAL listings here right now (not sales)? A rising rental-DOM trend means longer vacancies and softer asking-rent achievability than the comps imply.
- What's the recent tenant-quality profile in this submarket — average credit score on applications, eviction rate, late-payment / NSF rate, and stable-employment percentage? A property-management company in the area should have these aggregated.
- How much new for-sale + rental construction is in the pipeline within 1–3 miles? Heavy new supply typically softens prices + rents 12–24 months out; constrained supply supports both.
Investment metrics
- 1% rule
- 1.04% ✓
- Cap rate
- 8.71%
- Cash-on-cash
- 8.63%
- DSCR
- 1.38
- GRM
- 8.0
CMA / ARV
- ARV (median comp)
- $244,243
- List price
- $199,900
- Delta
- -18.16%
- Verdict
- UNDERPRICED
- Comps
- 20 within 1.0 mi
Show comp detail 12 sales within ~0.75 mi
| Address | Dist | Beds/Ba | Sqft | Sold | Price | $/sf | Match |
|---|---|---|---|---|---|---|---|
| 25 Fourth St | 0.03mi | 3/1.0 | 1,279 (0%) | 2mo | $280,000 | $219 | 97 |
| 22 B Ave | 0.07mi | 2/2.0 (-1) | 1,279 (0%) | 14mo | $309,000 | $242 | 76 |
| 14 J Ave | 0.45mi | 3/1.0 | 1,279 (0%) | 10mo | $235,000 | $184 | 71 |
| 4 B Ave | 0.15mi | 2/1.0 (-1) | 1,196 (-6%) | 13mo | $255,000 | $213 | 66 |
| 105 First St | 0.39mi | 4/2.0 (+1) | 1,344 (+5%) | 6mo | $334,000 | $249 | 59 |
| 6 N Ave | 0.23mi | 2/1.5 (-1) | 1,320 (+3%) | 22mo | $248,500 | $188 | 59 |
| 4 I Ave | 0.48mi | 2/1.0 (-1) | 1,201 (-6%) | 10mo | $235,000 | $196 | 54 |
| 41 Sixth St | 0.49mi | 2/1.0 (-1) | 1,201 (-6%) | 11mo | $269,000 | $224 | 52 |
| 2428 Buena Vista Cir | 0.70mi | 3/2.0 | 1,314 (+3%) | 9mo | $295,000 | $225 | 51 |
| 3618 Titshaw Dr | 0.74mi | 3/1.5 | 1,318 (+3%) | 9mo | $245,000 | $186 | 51 |
| 19 Fourth St | 0.44mi | 2/2.0 (-1) | 1,459 (+14%) | 1mo | $328,000 | $225 | 47 |
| 3611 Titshaw Dr | 0.72mi | 3/2.0 | 1,300 (+2%) | 23mo | $307,000 | $236 | 41 |
Match score weights: distance 35% · size 25% · config 20% · recency 20%. Top-matched comps best support the ARV.
Projected returns pro-forma
-3.0% appreciation · 0.0% rent growth · sell at horizon
- IRR
- -6.4%
- Equity multiple
- 0.77×
- Total profit
- $-12,885
- Equity at exit
- $29,806
- IRR
- -0.6%
- Equity multiple
- 0.97×
- Total profit
- $-1,933
- Equity at exit
- $17,284
Cash invested: $55,972 (down + closing). Projections, not guarantees.
Landlord ↔ Tenant lean methodology
- Overall (STATE)
- 90 Strongly Landlord-Friendly
- State Georgia
- 90 Strongly Landlord-Friendly · R+3
- County
- — inherits STATE
- City
- — inherits STATE
ZIP-level market 30504
- Home prices YoY
- -32.5%
- Rents YoY
- -4.7%
- Active inventory
- 252
- Price-to-rent
- 8.0×
Monthly cashflow live
- Estimated rent
- $2,075 high interval (Pro) →
- Mortgage (P&I)
- −$1,048
- Tax from tax record
- −$105 /mo · $1,261/yr
- Insurance
- −$83
- HOA
- −$0
- Vacancy / Maint / Mgmt
- −$436
- Net cashflow
- $403
Break-even live
UW: 25.0% down · 7.5% · 30yr · 1.5% tax · 5.0% vac · 8.0% maint · 8.0% mgmt
Financing live
Cash to close
- Down payment
- $49,975
- Closing costs
- $5,997
- Reserves months
- —
- Total cash needed
- —
Loan-product check · same deal, 3 products live
Conventional
25% down · 7.5% · 30yr
- Down + closing
- —
- Monthly P&I
- —
- Monthly cashflow
- —
- DSCR
- —
- Eligible?
- —
Personal DTI + credit; lowest rate.
DSCR
20% down · 8.5% · 30yr
- Down + closing
- —
- Monthly P&I
- —
- Monthly cashflow
- —
- DSCR
- —
- Eligible?
- —
No personal income docs; deal must DSCR.
Hard money
10% down · 12.0% · 12mo
- Down + closing
- —
- Monthly P&I
- —
- Monthly cashflow
- —
- DSCR
- —
- Eligible?
- —
Short-term bridge; refi at stabilization.
Rent comps 17 comps
| Address | Beds | Baths | Sqft | Rent | $/sqft | DOM | Units | Dist |
|---|---|---|---|---|---|---|---|---|
| 2283 Birch Mountain Run Gainesville, GA | 4.0 | 2.5 | 1700 | $2,025 | $1.19 | 12d | 1 | 0.44mi |
| 2223 Birch Mountain Run Gainesville, GA | 4.0 | 2.5 | 1767 | $2,025 | $1.15 | 43d | 1 | 0.45mi |
| 2309 Deerhaven Xing Gainesville, GA | 4.0 | 2.5 | 1700 | $2,025 | $1.19 | 12d | 1 | 0.50mi |
| 2313 Deerhaven Xing Gainesville, GA | 4.0 | 2.5 | 1767 | $2,025 | $1.15 | 12d | 1 | 0.51mi |
| 2354 Deerhaven Xing Gainesville, GA | 4.0 | 2.5 | 1700 | $2,025 | $1.19 | 43d | 1 | 0.60mi |
| 2765 Valley Green Dr Gainesville, GA | 3.0 | 2.5 | 1558 | $1,890 | $1.21 | 21d | 1 | 1.18mi |
| Valley Green Dr Gainesville, GA | 3.0 | 2.5 | 1344 | $1,750 | $1.30 | 43d | 4 | 1.19mi |
| 5296 Magnolia Pl Gainesville, GA | 3.0 | 2.5 | 1742 | $2,150 | $1.23 | 13d | 1 | 1.20mi |
| 2883 Creek Bottom Ct Gainesville, GA | 3.0 | 2.5 | 1528 | $1,699 | $1.11 | 13d | 1 | 1.23mi |
| 2883 Creek Bottom Ct Gainesville, GA | 3.0 | 2.5 | 1528 | $1,749 | $1.14 | 21d | 1 | 1.23mi |
| 4654 Cypress Landing Way Gainesville, GA | 3.0 | 2.5 | 1850 | $2,200 | $1.19 | 13d | 1 | 1.33mi |
| 4741 Cypress Park Dr Gainesville, GA | 3.0 | 3.0 | 1850 | $2,100 | $1.14 | 43d | 1 | 1.35mi |
| 3055 Tumbling Creek Rd Gainesville, GA | 3.0 | 3.0 | 1413 | $2,024 | $1.43 | 1d | 2 | 1.41mi |
| 3019 Ivy Hill Cir Unit 3019-IHC , GA | 3.0 | 3.0 | 1413 | $2,050 | $1.45 | 43d | 1 | 1.42mi |
| 3080 Ivy Hill Cir Unit 3080-IHC , GA | 3.0 | 3.0 | 1413 | $2,050 | $1.45 | 24d | 1 | 1.42mi |
| 3100 Ivy Hill Cir Unit 3100-IHC , GA | 3.0 | 3.0 | 1413 | $2,000 | $1.42 | 24d | 1 | 1.42mi |
| 3064 Ivy Hill Cir Unit 3064-IHC , GA | 3.0 | 3.0 | 1413 | $1,999 | $1.41 | 24d | 1 | 1.42mi |
Listing history 3 events
-
2026-04-17$199,900 New 115-char remark
Show marketing remark (115 chars)
Great opportunity to fix up a piece of history in the heart of Gainesville. Call today to schedule an appointment!
-
2026-04-17$199,900 Active 115-char remark
Show marketing remark (115 chars)
Great opportunity to fix up a piece of history in the heart of Gainesville. Call today to schedule an appointment!
-
2026-04-17soldstatus $267,000
Show marketing remark (115 chars)
Great opportunity to fix up a piece of history in the heart of Gainesville. Call today to schedule an appointment!
ⓘ Source: listings_history table (triggers on properties + properties_extension) + one-shot
backfill from property_details.listing_events for pre-trigger history.
Tax reassessment forecast GA · Resets to sale price
- Current annual tax
- $1,261 · $105/mo
- Projected year-2 tax
- $1,839 · $153/mo
- Expected delta
- +$578/yr (+$48/mo · 45.9%)
ⓘ Screening estimate from a state-policy table — verify with the county assessor before closing.
Climate risk First Street
- Flood 1/10 Low FEMA zone X (unshaded) · 0% chance over 30 yrs
- Wildfire 2/10 Low
- Heat 4/10 Moderate 7 d/yr ≥102°F today · 17 d/yr by 30 yrs out
- Wind 4/10 Moderate 11% chance of damaging wind over 30 yrs
- Air quality 4/10 Moderate 3 unhealthy d/yr today · 6 by 30 yrs out
Nearby sold comps map
Loading sold comps map…
Walkable amenities ~0.75 mi
Loading nearby amenities…
Taxation est. · year 1
- Rental income
- $24,901
- − Mortgage interest
- −$11,198
- − Property taxes
- −$1,261
- − Insurance
- −$1,000
- − Repairs & maintenance
- −$1,992
- − Management
- −$1,992
- − Depreciation
- −$5,815
- Taxable income
- $1,644
- Est. tax owed @ 24.0%
- −$395
- After-tax cash flow
- $4,437/yr
For passive investors: Depreciation is non-cash, so a rental often shows a tax loss while cash-flowing — sheltering income. Rental losses are passive: they offset passive income freely, and up to $25,000/yr can offset ordinary (W-2) income if you actively participate and your MAGI is under $100k (phasing out to $0 by $150k); unused losses carry forward. On sale, claimed depreciation is recaptured at up to 25%, and gains may owe capital-gains tax (a 1031 exchange can defer both). Figures are a year-1 estimate at your 24.0% rate — not tax advice; consult a CPA.
Schools (NCES district)
- District
- Hall County
- NCES district ID
- 1302610
- Math proficiency
- 28% ▼ -12.00%
- Reading proficiency
- 33% ▼ -5.00%
- Median HH income
- $55,708
- Composite
- 27.15/100
- National rank
- #7029
- State rank
- #81 of 174 in GA
Livability — Gainesville
- Score
- 66/100
- State rank
- #181
- US rank
- #11362
Category grades
Schools grade is shown separately in the Schools card above.
Census & demographics
- County
- Hall County · 188,353 people
- City population
- 140,301
- Metro
- Gainesville, GA
- Population (ZIP)
- 29,422
- Household income
- $75,885
- Rent vs Own
- Severe rent burden
- 787.0
Population outlook (Hall County) Hauer SSP2
- Today (2025)
- 225,275 people
- By 2030
- 240,204 · +6.6%
- By 2040
- 268,440 · +19.2%
- By 2050
- 293,596 · +30.3%
- By 2075
- 350,293 · +55.5%
- By 2100
- 389,329 · +72.8%
Race, ethnicity, and origin ACS 2023
- Neighborhood character
- Diverse neighborhood (Simpson 0.60)
- Race & ethnicity
- Hispanic / Latino 49% White 39% Two or more races 22% Black 6% Asian 4%
- Hispanic origin (detail)
- Mexican 33%
- Common ancestry
- Lithuanian 1% Italian 1% Serbian 1%
- Foreign-born
- 27% · Canada, Vietnam, Jamaica
- Languages at home
- 52% English-only · Spanish 43% Vietnamese 3% French/Haitian/Cajun 1%
Political lean MEDSL · Hall
- 2024 margin
- Solid R (+43.8) · D 27.8% · R 71.6%
- 2008→2024 swing
- +7.1pp toward D · 2008: -50.9pp · 2024: -43.8pp
- All cycles
- 2024: R+43.8 2020: R+43.2 2016: R+50.7 2012: R+56.4 2008: R+50.9
Not yet ingested
- Civics
- —
Market trends
- HPI YoY
- ▼ -115.54%
- Current HPI
- 239.8544
- Rent YoY
- ▼ -4.73%
- Metro
- Gainesville, GA
- State GDP YoY
- ▲ 2.66%
- F500 in state
- 28
Industry mix (Fortune 500 HQ in GA)
| Industry | F500 HQs | Revenue |
|---|---|---|
| Paper / Packaging | 2 | $29B |
|
||
| Retail | 1 | $160B |
|
||
| Transportation / Logistics | 1 | $91B |
|
||
| Airlines | 1 | $62B |
|
||
| Consumer Goods | 1 | $47B |
|
||
| Utilities | 1 | $25B |
|
||
Price history
+33.6% since first listed3 events — show timeline
- 2026-04-17 Sold (Public Records) $267,000 Public Records
- 2026-04-17 Listed $199,900 FMLS
- 2026-04-17 Listed $199,900 GAMLS
Property tax history
+13.2%/yrLatest (2025): $1,261 · +1.2% YoY. Source: county tax records.
Cash-flow waterfall
monthlySold comps — $/sqft
last 12 mo · ≤1 miLoading sold comps…