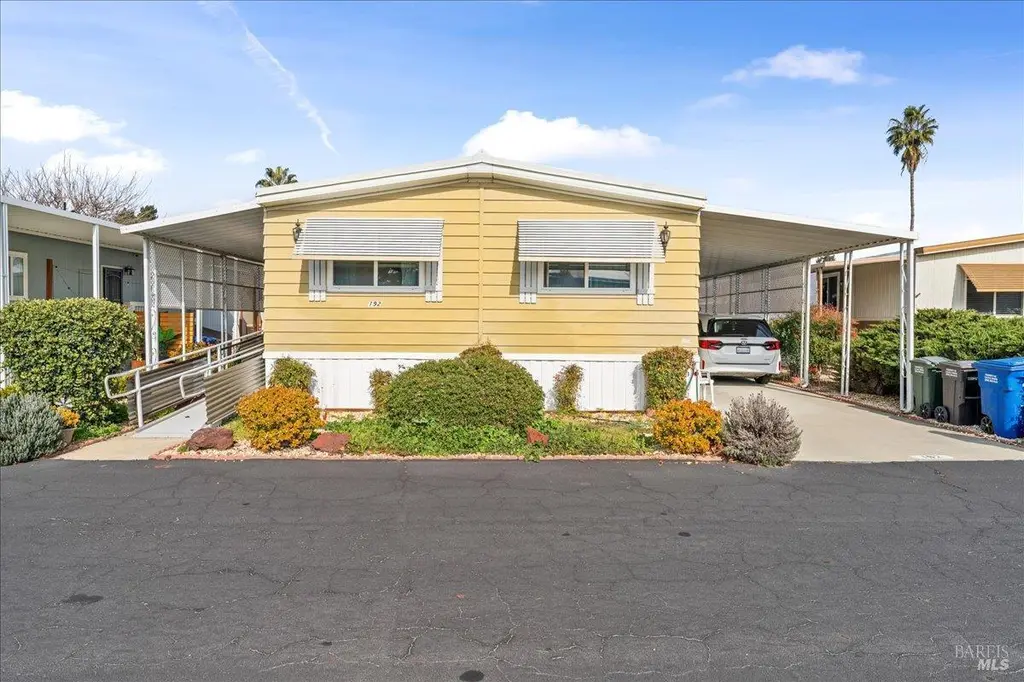
192 Kona Cir · Pittsburg, CA
Flood risk 1/10 · Minimal
- FEMA flood zone
- X (unshaded)
- Chance of flooding over 30 yrs
- 0.0%
- Est. flood insurance / yr
- $507 – $1,088
Fire risk 6/10 · Moderate
- Est. fire insurance / yr
- $659 – $1,223
Heat risk 5/10 · Moderate
- Hot days now (above 99°F)
- 7 days/yr
- Hot days in 30 yrs
- 14 days/yr
Wind risk 1/10 · Minimal
- Chance of severe wind over 30 yrs
- —
Air-quality risk 8/10 · Major
- Unhealthy air days now
- 14 days/yr
- Unhealthy air days in 30 yrs
- 14 days/yr
Risk factors via First Street. Map © Google.
Why this score? — see what drove the B- grade
The composite is a weighted blend of 9 inputs, each scored 0–100. Each bar is that input's sub-score; the figure is the points it added to the 100-point composite (weight × sub-score).
- Cash flow +30.0/30.0
- 1% rule +10.0/10.0
- DSCR +10.0/10.0
- ARV discount +7.5/15.0
- Livability +2.9/5.0
- Rent growth +2.8/5.0
- Schools +2.8/10.0
- Condition / age +2.5/5.0
- Appreciation +0.0/10.0
$150,000
🖨 Deal sheet 📄 Offer letter ✓ Due diligence
Listing remarks MLS
A wonderful opportunity to own in the Delta Hawaii senior community. This manufactured home has been well cared for and reflects true pride of ownership. This 3 bedroom 2 bathroom home presents an opportunity for customization while remaining functional and livable in its current as is condition. Located in a quiet, established senior park with community amenities, club house along with a swimming pool. Close proximity to shopping, dining, and major commuter routes. A great option for those seeking affordability, comfort, and long term potential. Home features a laundry room, large family room, dining room, porch area, and a shed in the carport area. Close to lots of amenities, come and see!
Key facts
- Large family room
- Community amenities
- Laundry room
Tags
Neighborhood map
What this means for you Summary
Snapshot
- This is a 3-bed/2.0-bath manufactured listed at $150k.
Deal economics
- At list price, monthly cash flow is $1k ($17k/yr) — positive.
- The deal already cash-flows at list — no discount required.
- Meets the 1% rule at list price ($3k rent vs $150k).
- Recommended offer: $132k (12.0% below list) — sets the bar for market timing.
- Cap rate 17.8% vs local median 3.4% in Pittsburg — top-decile yield for the area; either an underpriced asset or a hidden risk that comps aren't pricing in. Stress-test before assuming the spread holds.
Location & tenants
- Location reads 58/100 on livability (#687 in CA) — a working-class tenant base; expect higher turnover. Strengths: employment A+, housing A+; Watch: schools F, crime D-, amenities F.
- Pittsburg Unified (suburban): math 21% / reading 35% proficiency, ranked #1,069 of 1,400 in CA (top 76%) — low school quality limits family demand, transient renter base, plan for 1-2y turnover; 66% free/reduced lunch — lower-income household profile, screen leases tightly.
- Market conditions: Rents rising (+1.1%/yr); 265 active listings in the ZIP; 16 comparable units currently listed for rent nearby; rentals at typical pace (median 24d on market — plan ~3-4 weeks tenant-placement turnaround); 44% of comp listings sitting > 30 days — soft ceiling on asking rent; solid renter incomes; 2,169 units permitted in Contra Costa County in 2024 (896 in 5+ unit buildings).
- This rent runs 39% of the median local income ($96k/yr) — at the standard rent-burdened threshold; future hikes will face affordability resistance.
Forward outlook
- Local home prices are declining (-3.0%/yr); year-one equity from $1k of loan paydown is wiped out by about $4k of value loss. Plan a longer hold.
- Contra Costa County population projected at +26% by 2050 — long-run rental-demand tailwind backs the buy-and-hold thesis.
- At projected returns (-3.0% appreciation + 1.1% rent growth), your $42k cash investment doubles in ~3 years — after that, you're playing with house money.
Negotiation context
- It's been on market 136 days — a 12% lower offer ($132k) is reasonable based on typical stale-listing flexibility.
Risks & watch-outs
- Climate carrying-cost: major wildfire risk; extreme-heat days projected 7→14/yr by 2055 (HVAC capex compounding) — expect insurance premiums to compound above CPI over the hold.
Questions for the listing agent
- It's been on market 136 days. Have you received any prior offers? Is the seller open to a 12% concession, seller financing, or rate buy-down credit?
- Built in 1976 — when were the roof, HVAC, electrical panel, plumbing, and water heater last replaced?
- Why hasn't it sold? Are there any deal-killer items the seller is aware of (foundation, flood, title, zoning, code violations)?
- Is there a deadline driving the sale (1031 exchange, divorce, estate, relocation)? That informs how much negotiation room exists.
- Schools are F-rated, which usually means shorter tenancies and higher turnover. Who's the typical renter profile here, and what's been the actual vacancy rate?
- Crime grade is D in this area — have there been break-ins, vandalism, or insurance claims at this property in the last 3 years? What carrier currently insures it and at what premium?
- What's the average days-on-market for RENTAL listings here right now (not sales)? A rising rental-DOM trend means longer vacancies and softer asking-rent achievability than the comps imply.
- What's the recent tenant-quality profile in this submarket — average credit score on applications, eviction rate, late-payment / NSF rate, and stable-employment percentage? A property-management company in the area should have these aggregated.
- How much new for-sale + rental construction is in the pipeline within 1–3 miles? Heavy new supply typically softens prices + rents 12–24 months out; constrained supply supports both.
Investment metrics
- 1% rule
- 2.08% ✓
- Cap rate
- 17.75%
- Cash-on-cash
- 40.92%
- DSCR
- 2.82
- GRM
- 4.0
CMA / ARV
- ARV (median comp)
- $86,700
- List price
- $150,000
- Delta
- 73.01%
- Verdict
- OVERPRICED
- Comps
- 18 within 1.0 mi
Show comp detail 12 sales within ~0.75 mi
| Address | Dist | Beds/Ba | Sqft | Sold | Price | $/sf | Match |
|---|---|---|---|---|---|---|---|
| 77 Hilo Dr | 0.19mi | 3/2.0 | 1,566 (+2%) | 2mo | $270,000 | $172 | 86 |
| 210 Kona Crk | 0.05mi | 3/2.0 | 1,440 (-6%) | 1mo | $70,000 | $49 | 86 |
| 237 Aloha Way | 0.08mi | 2/2.0 (-1) | 1,464 (-5%) | 4mo | $175,000 | $120 | 80 |
| 141 Maui Dr | 0.08mi | 2/2.0 (-1) | 1,440 (-6%) | 2mo | $84,000 | $58 | 80 |
| 215 Maui Dr #215 | 0.10mi | 2/2.0 (-1) | 1,440 (-6%) | 4mo | $85,500 | $59 | 76 |
| 232 Queens Way | 0.06mi | 2/2.0 (-1) | 1,400 (-9%) | 4mo | $87,500 | $63 | 74 |
| 16 Surf Dr | 0.27mi | 2/2.0 (-1) | 1,440 (-6%) | 0mo | $54,900 | $38 | 72 |
| 224 Queens Way #224 | 0.11mi | 2/2.0 (-1) | 1,344 (-12%) | 2mo | $85,900 | $64 | 68 |
| 61 Pali Way | 0.23mi | 2/2.0 (-1) | 1,400 (-9%) | 3mo | $50,000 | $36 | 67 |
| 134 Banyon Dr | 0.10mi | 2/2.0 (-1) | 1,344 (-12%) | 3mo | $133,000 | $99 | 67 |
| 169 Sunset Way | 0.05mi | 2/2.0 (-1) | 1,320 (-14%) | 9mo | $249,500 | $189 | 62 |
| 223 Queens Way | 0.12mi | 3/2.0 | 1,740 (+13%) | 12mo | $149,500 | $86 | 62 |
Match score weights: distance 35% · size 25% · config 20% · recency 20%. Top-matched comps best support the ARV.
Projected returns pro-forma
-3.0% appreciation · 1.11% rent growth · sell at horizon
- IRR
- 35.3%
- Equity multiple
- 2.46×
- Total profit
- $61,130
- Equity at exit
- $22,365
- IRR
- 41.1%
- Equity multiple
- 4.52×
- Total profit
- $147,841
- Equity at exit
- $12,969
Cash invested: $42,000 (down + closing). Projections, not guarantees.
Landlord ↔ Tenant lean methodology
- Overall (STATE)
- 18 Strongly Tenant-Friendly
- State California
- 18 Strongly Tenant-Friendly · D+13
- County
- — inherits STATE
- City
- — inherits STATE
ZIP-level market 94565
- Rents YoY
- 1.1%
- Active inventory
- 265
- Price-to-rent
- 4.0×
Monthly cashflow live
- Estimated rent
- $3,125 high interval (Pro) →
- Mortgage (P&I)
- −$787
- Tax est. 1.5%
- −$188 /mo · $2,250/yr
- Insurance
- −$62
- HOA
- −$0
- Vacancy / Maint / Mgmt
- −$656
- Net cashflow
- $1,432
Break-even live
UW: 25.0% down · 7.5% · 30yr · 1.5% tax · 5.0% vac · 8.0% maint · 8.0% mgmt
Financing live
Cash to close
- Down payment
- $37,500
- Closing costs
- $4,500
- Reserves months
- —
- Total cash needed
- —
Loan-product check · same deal, 3 products live
Conventional
25% down · 7.5% · 30yr
- Down + closing
- —
- Monthly P&I
- —
- Monthly cashflow
- —
- DSCR
- —
- Eligible?
- —
Personal DTI + credit; lowest rate.
DSCR
20% down · 8.5% · 30yr
- Down + closing
- —
- Monthly P&I
- —
- Monthly cashflow
- —
- DSCR
- —
- Eligible?
- —
No personal income docs; deal must DSCR.
Hard money
10% down · 12.0% · 12mo
- Down + closing
- —
- Monthly P&I
- —
- Monthly cashflow
- —
- DSCR
- —
- Eligible?
- —
Short-term bridge; refi at stabilization.
Rent comps 16 comps
| Address | Beds | Baths | Sqft | Rent | $/sqft | DOM | Units | Dist |
|---|---|---|---|---|---|---|---|---|
| 4 Meadowbrook Ave Pittsburg, CA | 2.0 | 2.0 | 1122 | $2,600 | $2.32 | 43d | 1 | 0.19mi |
| 948 Golden Leaf Way Pittsburg, CA | 3.0 | 2.0 | 1386 | $3,400 | $2.45 | 43d | 1 | 0.31mi |
| 2221 Lynbrook Dr Pittsburg, CA | 3.0 | 2.0 | 1365 | $3,195 | $2.34 | 43d | 1 | 0.36mi |
| 1 Addison Ct Pittsburg, CA | 4.0 | 2.5 | 1805 | $3,295 | $1.83 | 24d | 1 | 0.46mi |
| 3809 Lassen Dr Pittsburg, CA | 3.0 | 1.5 | 1650 | $2,995 | $1.82 | 3d | 1 | 0.50mi |
| 4225 McFaul Dr Pittsburg, CA | 4.0 | 2.0 | 1500 | $4,100 | $2.73 | 24d | 1 | 0.70mi |
| 17 Lorraine Ave Pittsburg, CA | 3.0 | 1.5 | 1180 | $2,700 | $2.29 | 18d | 1 | 0.74mi |
| 240 Benjamin Ave Pittsburg, CA | 3.0 | 2.0 | 1379 | $3,139 | $2.28 | 2d | 1 | 0.75mi |
| 4317 Campbell Dr Pittsburg, CA | 4.0 | 3.0 | 1965 | $3,400 | $1.73 | 43d | 1 | 0.84mi |
| 60 Xena Ct Pittsburg, CA | 3.0 | 2.5 | 1805 | $3,200 | $1.77 | 43d | 1 | 0.84mi |
| 1000 Pheasant Dr Pittsburg, CA | 1.0–2.0 | 1.0–2.5 | 879 | $2,795 | $3.18 | 24d | 29 | 1.10mi |
| 1353 Pine St Pittsburg, CA | 3.0 | 2.0 | 1369 | $2,750 | $2.01 | 5d | 1 | 1.12mi |
| 1341 Maple St Pittsburg, CA | 2.0 | 1.0 | 1299 | $2,550 | $1.96 | 21d | 1 | 1.13mi |
| 1346 Redwood St Pittsburg, CA | 3.0 | 1.5 | 1066 | $2,915 | $2.73 | 16d | 1 | 1.15mi |
| 99 Liberty Ct Pittsburg, CA | 3.0 | 2.5 | 1802 | $3,600 | $2.00 | 43d | 1 | 1.22mi |
| 34 Kingswood Dr Pittsburg, CA | 4.0 | 2.0 | 1755 | $3,900 | $2.22 | 43d | 1 | 1.30mi |
Listing history 11 events
-
2026-06-13days on market $150,000 Active 136 DOM
-
2026-06-13days on market $150,000 Active 135 DOM
-
2026-06-09days on market $150,000 Active 132 DOM
-
2026-06-08days on market $150,000 Active 131 DOM
-
2026-06-07days on market $150,000 Active 130 DOM
-
2026-06-04days on market $150,000 Active 127 DOM
-
2026-06-03days on market $150,000 Active 126 DOM
-
2026-06-02days on market $150,000 Active 125 DOM
-
2026-06-01days on market $150,000 Active 124 DOM
-
2026-05-31days on market $150,000 Active 123 DOM
-
2026-01-28$150,000 Active 700-char remark
Show marketing remark (700 chars)
A wonderful opportunity to own in the Delta Hawaii senior community. This manufactured home has been well cared for and reflects true pride of ownership. This 3 bedroom 2 bathroom home presents an opportunity for customization while remaining functional and livable in its current as is condition. Located in a quiet, established senior park with community amenities, club house along with a swimming pool. Close proximity to shopping, dining, and major commuter routes. A great option for those seeking affordability, comfort, and long term potential. Home features a laundry room, large family room, dining room, porch area, and a shed in the carport area. Close to lots of amenities, come and see!
ⓘ Source: listings_history table (triggers on properties + properties_extension) + one-shot
backfill from property_details.listing_events for pre-trigger history.
Climate risk First Street
- Flood 1/10 Low FEMA zone X (unshaded) · 0% chance over 30 yrs
- Wildfire 6/10 Major
- Heat 5/10 Major 7 d/yr ≥99°F today · 14 d/yr by 30 yrs out
- Wind 1/10 Low
- Air quality 8/10 Severe 14 unhealthy d/yr today · 14 by 30 yrs out
Nearby sold comps map
Loading sold comps map…
Walkable amenities ~0.75 mi
Loading nearby amenities…
Taxation est. · year 1
- Rental income
- $37,502
- − Mortgage interest
- −$8,402
- − Property taxes
- −$2,250
- − Insurance
- −$750
- − Repairs & maintenance
- −$3,000
- − Management
- −$3,000
- − Depreciation
- −$4,364
- Taxable income
- $15,736
- Est. tax owed @ 24.0%
- −$3,777
- After-tax cash flow
- $13,411/yr
For passive investors: Depreciation is non-cash, so a rental often shows a tax loss while cash-flowing — sheltering income. Rental losses are passive: they offset passive income freely, and up to $25,000/yr can offset ordinary (W-2) income if you actively participate and your MAGI is under $100k (phasing out to $0 by $150k); unused losses carry forward. On sale, claimed depreciation is recaptured at up to 25%, and gains may owe capital-gains tax (a 1031 exchange can defer both). Figures are a year-1 estimate at your 24.0% rate — not tax advice; consult a CPA.
Schools (NCES district)
- District
- Pittsburg Unified
- NCES district ID
- 0630600
- Math proficiency
- 21% ▲ 1.00%
- Reading proficiency
- 35% ▲ 1.00%
- Median HH income
- $55,872
- Composite
- 27.99/100
- National rank
- #12238
- State rank
- #1069 of 1400 in CA
Livability — Pittsburg
- Score
- 58/100
- State rank
- #687
- US rank
- #20922
Category grades
Schools grade is shown separately in the Schools card above.
Census & demographics
- Census place
- Pittsburg, CA
- County
- Contra Costa County · 1,059,880 people
- City population
- 100,488
- Metro
- San Francisco-Oakland-Berkeley, CA
- Population (ZIP)
- 100,488
- Household income
- $95,556
- Rent vs Own
- Severe rent burden
- 3942.0
Population outlook (Contra Costa County) Hauer SSP2
- Today (2025)
- 1,287,720 people
- By 2030
- 1,364,937 · +6.0%
- By 2040
- 1,506,209 · +17.0%
- By 2050
- 1,624,373 · +26.1%
- By 2075
- 1,853,193 · +43.9%
- By 2100
- 1,901,231 · +47.6%
Race, ethnicity, and origin ACS 2023
- Neighborhood character
- Diverse neighborhood (Simpson 0.70)
- Race & ethnicity
- Hispanic / Latino 48% Two or more races 19% Asian 17% White 16% Black 13% Pacific Islander 1% Native American 1%
- Hispanic origin (detail)
- Mexican 38% Puerto Rican 1%
- Common ancestry
- Italian 1% Russian 1% Lithuanian 1%
- Foreign-born
- 34% · Canada, China, Vietnam
- Languages at home
- 47% English-only · Spanish 37% Tagalog/Filipino 6% Other Indo-European 4%
Political lean MEDSL · Contra Costa
- 2024 margin
- Solid D (+38.0) · D 67.3% · R 29.4% · Other 3.3%
- 2008→2024 swing
- +0.2pp no change · 2008: 37.8pp · 2024: 38.0pp
- All cycles
- 2024: D+38.0 2020: D+45.3 2016: D+43.5 2012: D+33.7 2008: D+37.8
Not yet ingested
- Civics
- —
Market trends
- HPI YoY
- ▼ -478.40%
- Current HPI
- 376.2576
- Rent YoY
- ▲ 1.11%
- Metro
- San Francisco-Oakland-Berkeley, CA
- State GDP YoY
- ▲ 3.21%
- F500 in state
- 116
Industry mix (Fortune 500 HQ in CA)
| Industry | F500 HQs | Revenue |
|---|---|---|
| Technology | 27 | $1,492B |
|
||
| Financial Services | 3 | $174B |
|
||
| Retail | 3 | $44B |
|
||
| Insurance | 3 | $26B |
|
||
| Media / Entertainment | 2 | $115B |
|
||
| Pharmaceuticals / Biotech | 2 | $62B |
|
||
Price history
1 event — show timeline
- 2026-01-28 Listed $150,000 BAREIS
Cash-flow waterfall
monthlySold comps — $/sqft
last 12 mo · ≤1 miLoading sold comps…