 🏗️ New Construction
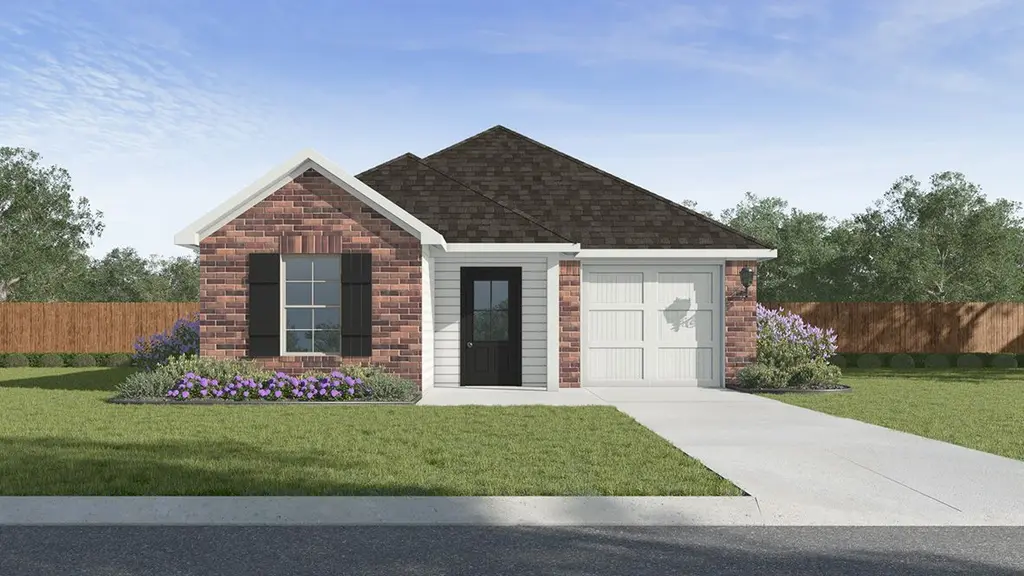
Bella Plan · Lafayette, LA
Flood risk 1/10 · Minimal
- FEMA flood zone
- X (unshaded)
- Chance of flooding over 30 yrs
- 0.0%
- Est. flood insurance / yr
- $507 – $1,088
Fire risk 1/10 · Minimal
- Est. fire insurance / yr
- $1,269 – $2,357
Heat risk 8/10 · Major
- Hot days now (above 109°F)
- 7 days/yr
- Hot days in 30 yrs
- 20 days/yr
Wind risk 9/10 · Severe
- Chance of severe wind over 30 yrs
- 99.0%
Air-quality risk 2/10 · Minimal
- Unhealthy air days now
- 1 days/yr
- Unhealthy air days in 30 yrs
- 1 days/yr
Risk factors via First Street. Map © Google.
Why this score? — see what drove the D grade
The composite is a weighted blend of 9 inputs, each scored 0–100. Each bar is that input's sub-score; the figure is the points it added to the 100-point composite (weight × sub-score).
- Cash flow +11.9/30.0
- ARV discount +7.5/15.0
- Condition / age +5.0/5.0
- Rent growth +4.3/5.0
- Schools +3.6/10.0
- DSCR +3.5/10.0
- Livability +3.5/5.0
- 1% rule +3.4/10.0
- Appreciation +0.0/10.0
$210,500
🖨 Deal sheet 📄 Offer letter ✓ Due diligence
Listing remarks
Welcome to the Bella! A new home at Cedar Creek in Lafayette, Louisiana. The Bella is a thoughtfully designed single-story home that blends comfort, efficiency, and everyday functionality. This 3 bed, 2 bath layout offers a smart use of space while maintaining an open and inviting feel. Upon entry from the front porch, you're welcomed into a central space that flows seamlessly from the living area into the dining area and kitchen. The kitchen is well-appointed with ample counter space, a pantry for extra storage, stainless steel appliances, and convenient access to the dining room. The covered patio sits just off the living room, extending your living space outdoors and providing a perfect
Key facts
- Walk-in closet
- Ensuite bath
- Covered patio
Tags
Property features AI
Finance
- Other: Address: 103 Cedar Peak Ln, Lafayette, LA 70501; Listing status: Active; Last modified: 2026-06-17
- Financial info: List price $210,500
Exterior
- Parking: 1 garage space (1 total parking space)
- Home design: Bella plan (new construction plan); Single-level (plan)
Interior
- Bedrooms: 3 bedrooms
- Bathrooms: 2 full bathrooms
- Interior features: Open living area (approx. 1,370 finished area)
Neighborhood map
What this means for you Summary
Snapshot
- This is a 3-bed/2.0-bath single-family listed at $210k. Condition is rated excellent.
Deal economics
- At list price, monthly cash flow is $-54 ($-645/yr) — negative.
- To cash-flow at today's rent, offer at most $205k (2.8% below list).
- To meet the 1% rule (rent ≥ 1% of price), the offer needs to be $179k (15.0% below list).
- Recommended offer: $179k (15.0% below list) — sets the bar for 1% rule.
- Cap rate 6.0% vs local median 4.7% in Lafayette — meaningfully above typical; check what's discounted (condition, days-on-market, listing class) to confirm the premium yield is real.
Location & tenants
- Location reads 70/100 on livability (#63 in LA) — a middle-class / working-renter tenant base. Strengths: cost of living A+, housing A+, health & safety A+; Watch: amenities C-, employment C-, crime F.
- Lafayette Parish (urban): math 38% / reading 46% proficiency, ranked #19 of 98 in LA (top 19%) — families likely to look elsewhere, expect single-tenant / working-renter base with shorter leases.
- Market conditions: Rents rising fast (+7.3%/yr); 246 active listings in the ZIP; 8 comparable units currently listed for rent nearby; rentals at typical pace (median 21d on market — plan ~3-4 weeks tenant-placement turnaround); lower-income renter base — watch delinquency; 1,585 units permitted in Lafayette Parish in 2024 (10 in 5+ unit buildings).
- At $1,790/mo this rent would consume 64% of the median local household income ($33k/yr) (locally 2089% of renters already pay >50% of income on rent) — very limited rent-growth headroom before tenants either downsize or default.
Forward outlook
- Local home prices are declining (-3.0%/yr); year-one equity from $1k of loan paydown is wiped out by about $6k of value loss. Plan a longer hold.
- Lafayette County population projected at +34% by 2050 — long-run rental-demand tailwind backs the buy-and-hold thesis.
Negotiation context
- Only 1 days on market — expect competitive offers; lowballing is unlikely to land.
Risks & watch-outs
- Climate carrying-cost: severe wind risk, 99% chance of damaging wind over 30y; extreme-heat days projected 7→20/yr by 2055 (HVAC capex compounding) — expect insurance premiums to compound above CPI over the hold.
Questions for the listing agent
- What do current leases actually rent for vs. the listed asking? Can we see a recent rent roll and the last 12 months of T-12 income?
- Is there a deadline driving the sale (1031 exchange, divorce, estate, relocation)? That informs how much negotiation room exists.
- Schools are B-rated — typically a magnet for longer-tenancy family renters. What's the average tenant stay here, and is there a school-zone premium baked into asking?
- Crime grade is F in this area — have there been break-ins, vandalism, or insurance claims at this property in the last 3 years? What carrier currently insures it and at what premium?
- The area grade is low — what's the realistic commute time and amenity access for the typical tenant pool here? Any planned neighborhood developments (good or bad) we should know about?
- What's the average days-on-market for RENTAL listings here right now (not sales)? A rising rental-DOM trend means longer vacancies and softer asking-rent achievability than the comps imply.
- What's the recent tenant-quality profile in this submarket — average credit score on applications, eviction rate, late-payment / NSF rate, and stable-employment percentage? A property-management company in the area should have these aggregated.
- How much new for-sale + rental construction is in the pipeline within 1–3 miles? Heavy new supply typically softens prices + rents 12–24 months out; constrained supply supports both.
Investment metrics
- 1% rule
- 0.84% ✗
- Cap rate
- 5.99%
- Cash-on-cash
- -1.08%
- DSCR
- 0.95
- GRM
- 9.9
CMA / ARV
- ARV (on-the-fly)
- $212,350
- Comps found
- 12
Show comp detail 12 sales within ~0.75 mi
| Address | Dist | Beds/Ba | Sqft | Sold | Price | $/sf | Match |
|---|---|---|---|---|---|---|---|
| 334 White Pine Dr | 0.16mi | 3/2.0 | 1,447 (+6%) | 6mo | $228,000 | $158 | 78 |
| 331 White Pine Dr | 0.17mi | 3/2.0 | 1,447 (+6%) | 6mo | $224,500 | $155 | 78 |
| 322 White Pine Dr | 0.17mi | 3/2.0 | 1,447 (+6%) | 6mo | $228,000 | $158 | 77 |
| 317 White Pine Dr | 0.17mi | 3/2.0 | 1,447 (+6%) | 10mo | $224,500 | $155 | 75 |
| 1204 E Alexander St | 0.22mi | 3/2.0 | 1,423 (+4%) | 11mo | $145,000 | $102 | 74 |
| 308 White Pine Dr | 0.17mi | 3/2.0 | 1,447 (+6%) | 11mo | $224,500 | $155 | 73 |
| 305 White Pine Dr | 0.17mi | 3/2.0 | 1,447 (+6%) | 16mo | $224,500 | $155 | 69 |
| 106 Dogwood Dr | 0.46mi | 3/2.0 | 1,350 (-2%) | 10mo | $160,000 | $119 | 68 |
| 103 Briarwood Dr | 0.57mi | 3/2.0 | 1,355 (-1%) | 12mo | $147,000 | $108 | 61 |
| 1244 E Alexander St | 0.36mi | 2/2.0 (-1) | 1,540 (+12%) | 3mo | $155,000 | $101 | 55 |
| 301 Venus Dr | 0.49mi | 3/2.0 | 1,170 (-15%) | 0mo | $150,000 | $128 | 52 |
| 103 Calais St | 0.59mi | 3/1.5 | 1,182 (-14%) | 7mo | $139,500 | $118 | 42 |
Match score weights: distance 35% · size 25% · config 20% · recency 20%. Top-matched comps best support the ARV.
Projected returns pro-forma
-3.0% appreciation · 7.35% rent growth · sell at horizon
- IRR
- -13.3%
- Equity multiple
- 0.50×
- Total profit
- $-29,629
- Equity at exit
- $31,662
- IRR
- 1.3%
- Equity multiple
- 1.11×
- Total profit
- $6,608
- Equity at exit
- $18,360
Cash invested: $59,458 (down + closing). Projections, not guarantees.
Landlord ↔ Tenant lean methodology
- Overall (STATE)
- 90 Strongly Landlord-Friendly
- State Louisiana
- 90 Strongly Landlord-Friendly · R+12
- County
- — inherits STATE
- City
- — inherits STATE
ZIP-level market 70501
- Rents YoY
- 7.3%
- Active inventory
- 246
- Price-to-rent
- 9.8×
Monthly cashflow live
- Estimated rent
- $1,790 high interval (Pro) →
- Mortgage (P&I)
- −$1,114
- Tax est. 1.5%
- −$265 /mo · $3,185/yr
- Insurance
- −$88
- HOA
- −$0
- Vacancy / Maint / Mgmt
- −$376
- Net cashflow
- $-54
Break-even live
UW: 25.0% down · 7.5% · 30yr · 1.5% tax · 5.0% vac · 8.0% maint · 8.0% mgmt
Financing live
Cash to close
- Down payment
- $53,088
- Closing costs
- $6,370
- Reserves months
- —
- Total cash needed
- —
Loan-product check · same deal, 3 products live
Conventional
25% down · 7.5% · 30yr
- Down + closing
- —
- Monthly P&I
- —
- Monthly cashflow
- —
- DSCR
- —
- Eligible?
- —
Personal DTI + credit; lowest rate.
DSCR
20% down · 8.5% · 30yr
- Down + closing
- —
- Monthly P&I
- —
- Monthly cashflow
- —
- DSCR
- —
- Eligible?
- —
No personal income docs; deal must DSCR.
Hard money
10% down · 12.0% · 12mo
- Down + closing
- —
- Monthly P&I
- —
- Monthly cashflow
- —
- DSCR
- —
- Eligible?
- —
Short-term bridge; refi at stabilization.
Rent comps 8 comps
| Address | Beds | Baths | Sqft | Rent | $/sqft | DOM | Units | Dist |
|---|---|---|---|---|---|---|---|---|
| 406 Starlight Dr Lafayette, LA | 4.0 | 2.0 | 1867 | $3,500 | $1.87 | 13d | 1 | 0.18mi |
| 2820 Louisiana Ave Lafayette, LA | 1.0–2.0 | 1.0–2.0 | 821 | $1,145 | $1.39 | 13d | 20 | 0.68mi |
| 2826 Louisiana Ave #1111 Lafayette, LA | 2.0 | 2.0 | 1140 | $1,200 | $1.05 | 44d | 1 | 0.69mi |
| 2826 Louisiana Ave #907 Lafayette, LA | 2.0 | 2.5 | 1100 | $950 | $0.86 | 21d | 1 | 0.69mi |
| 2830 Louisiana Ave #6 Lafayette, LA | 2.0 | 1.5 | 1100 | $950 | $0.86 | 13d | 1 | 0.78mi |
| 610 Sunset Dr Lafayette, LA | 2.0 | 1.0 | 1000 | $800 | $0.80 | 44d | 1 | 0.86mi |
| 215 Peggy St Lafayette, LA | 3.0 | 2.0 | 1100 | $1,100 | $1.00 | 21d | 1 | 1.41mi |
| 215 Peggy St Lafayette, LA | 3.0 | 2.0 | 1100 | $1,100 | $1.00 | 13d | 1 | 1.41mi |
Listing history 2 events
-
2026-06-17remarks 699-char remark
-
2026-06-17$210,500 Active 1 DOM
ⓘ Source: listings_history table (triggers on properties + properties_extension) + one-shot
backfill from property_details.listing_events for pre-trigger history.
Climate risk First Street
- Flood 1/10 Low FEMA zone X (unshaded) · 0% chance over 30 yrs
- Wildfire 1/10 Low
- Heat 8/10 Severe 7 d/yr ≥109°F today · 20 d/yr by 30 yrs out
- Wind 9/10 Extreme 99% chance of damaging wind over 30 yrs
- Air quality 2/10 Low 1 unhealthy d/yr today · 1 by 30 yrs out
Nearby sold comps map
Loading sold comps map…
Walkable amenities ~0.75 mi
Loading nearby amenities…
Taxation est. · year 1
- Rental income
- $21,475
- − Mortgage interest
- −$11,895
- − Property taxes
- −$3,185
- − Insurance
- −$1,062
- − Repairs & maintenance
- −$1,718
- − Management
- −$1,718
- − Depreciation
- −$6,177
- Taxable loss
- −$4,280
- Est. tax savings @ 24.0%
- +$1,027
- After-tax cash flow
- $383/yr
For passive investors: Depreciation is non-cash, so a rental often shows a tax loss while cash-flowing — sheltering income. Rental losses are passive: they offset passive income freely, and up to $25,000/yr can offset ordinary (W-2) income if you actively participate and your MAGI is under $100k (phasing out to $0 by $150k); unused losses carry forward. On sale, claimed depreciation is recaptured at up to 25%, and gains may owe capital-gains tax (a 1031 exchange can defer both). Figures are a year-1 estimate at your 24.0% rate — not tax advice; consult a CPA.
Condition & rehab AI · 4 photos
This new single-story home in Lafayette, Louisiana, is in excellent condition with no visible repairs or maintenance needed. It offers a smart use of space and is move-in ready.
Value-add opportunities
- Both Painting exterior and interior — Enhances curb appeal and interior aesthetics
- Both Landscaping improvements — Enhances curb appeal and adds value
- Both New flooring in bathrooms and kitchen — Improves functionality and aesthetics
- Both New kitchen appliances — Enhances functionality and aesthetics
- Both New paint in interior — Enhances aesthetics and value
Renovation cost estimate screening
Value-add ROI direction
- Both Painting exterior and interior — Enhances curb appeal and interior aesthetics ↑
- Both Landscaping improvements — Enhances curb appeal and adds value ↑
- Both New flooring in bathrooms and kitchen — Improves functionality and aesthetics ↑
- Both New kitchen appliances — Enhances functionality and aesthetics ↑
- Both New paint in interior — Enhances aesthetics and value ↑
ⓘ Cost ranges are severity-bucket heuristics (US national rule-of-thumb). Get contractor quotes + a written scope before underwriting a rehab budget.
Schools (NCES district)
- District
- Lafayette Parish
- NCES district ID
- 2200870
- Math proficiency
- 38% ▼ -32.00%
- Reading proficiency
- 46% ▼ -24.00%
- Median HH income
- $50,238
- Composite
- 36.15/100
- National rank
- #4741
- State rank
- #19 of 98 in LA
Livability — Lafayette
- Score
- 70/100
- State rank
- #63
- US rank
- #8133
Category grades
Schools grade is shown separately in the Schools card above.
Census & demographics
- Census place
- Lafayette, LA
- County
- Lafayette Parish · 207,544 people
- City population
- 158,114
- Metro
- Lafayette, LA
- Population (ZIP)
- 26,465
- Household income
- $33,365
- Rent vs Own
- Severe rent burden
- 2089.0
Population outlook (Lafayette County) Hauer SSP2
- Today (2025)
- 280,930 people
- By 2030
- 301,092 · +7.2%
- By 2040
- 339,456 · +20.8%
- By 2050
- 375,156 · +33.5%
- By 2075
- 451,672 · +60.8%
- By 2100
- 497,203 · +77.0%
Race, ethnicity, and origin ACS 2023
- Neighborhood character
- Predominantly Black (73%)
- Race & ethnicity
- Black 73% White 18% Two or more races 6% Hispanic / Latino 4%
- Common ancestry
- Lithuanian 4%
- Foreign-born
- 2% · Canada
- Languages at home
- 95% English-only · Spanish 3% French/Haitian/Cajun 2%
Political lean MEDSL · Lafayette
- 2024 margin
- Solid R (+31.4) · D 33.5% · R 64.8% · Other 1.7%
- 2008→2024 swing
- -0.1pp no change · 2008: -31.3pp · 2024: -31.4pp
- All cycles
- 2024: R+31.4 2020: R+28.7 2016: R+33.6 2012: R+33.7 2008: R+31.3
Not yet ingested
- Civics
- —
Market trends
- HPI YoY
- ▼ -108.63%
- Current HPI
- 81.2963
- Rent YoY
- ▲ 7.35%
- Metro
- Lafayette, LA
- State GDP YoY
- ▲ 3.29%
- F500 in state
- 10
Industry mix (Fortune 500 HQ in LA)
| Industry | F500 HQs | Revenue |
|---|---|---|
| Telecommunications | 2 | $23B |
|
||
| Utilities | 1 | $12B |
|
||
| Wholesale / Distribution | 1 | $5B |
|
||
| Advertising | 1 | $2B |
|
||
Cash-flow waterfall
monthlySold comps — $/sqft
last 12 mo · ≤1 miLoading sold comps…