55 Powell Farm Rd · South Royalton, VT
Flood risk 1/10 · Minimal
- FEMA flood zone
- X (unshaded)
- Chance of flooding over 30 yrs
- 0.0%
- Est. flood insurance / yr
- $473 – $860
Fire risk 1/10 · Minimal
- Est. fire insurance / yr
- $480 – $892
Heat risk 2/10 · Minimal
- Hot days now (above 89°F)
- 7 days/yr
- Hot days in 30 yrs
- 17 days/yr
Wind risk 2/10 · Minimal
- Chance of severe wind over 30 yrs
- 4.0%
Air-quality risk 1/10 · Minimal
- Unhealthy air days now
- 0 days/yr
- Unhealthy air days in 30 yrs
- 0 days/yr
Risk factors via First Street. Map © Google.
Why this score? — see what drove the C- grade
The composite is a weighted blend of 9 inputs, each scored 0–100. Each bar is that input's sub-score; the figure is the points it added to the 100-point composite (weight × sub-score).
- Cash flow +16.7/30.0
- ARV discount +7.5/15.0
- Appreciation +6.7/10.0
- DSCR +5.2/10.0
- Schools +5.0/10.0
- 1% rule +4.3/10.0
- Livability +3.4/5.0
- Rent growth +2.5/5.0
- Condition / age +2.5/5.0
$250,000
🖨 Deal sheet 📄 Offer letter ✓ Due diligence
Listing remarks
The town of Sharon has such a good appeal and so does the potential in this country home set on 2.5 acres according to the town but 3 according to the deed. The home needs work for sure but is a great equity builder for someone trying to get into a home inexpensively, live in it and is willing to do the work to increase the value of the property while residing. Or for investors, this home can surely produce a nice profit, fixed up well. The lot has frontage on Fay Brook and opening up the view from the home, yet keeping it private from the road, will only add to the lot and view appeal. Did I mention ridgeline views? PROPERTY IS BEING SOLD AS IS. Come visit at our open house on Sunday, 6/
Key facts
- 2.5 acres
- Ridgeline views
- 2.5 acre lot
Tags
Property features AI
Exterior
- Parking: One-car garage; Gravel driveway
- Utilities: Drilled private well; Private septic; Circuit breaker electric service; Fiber optic internet available; Cable and satellite available
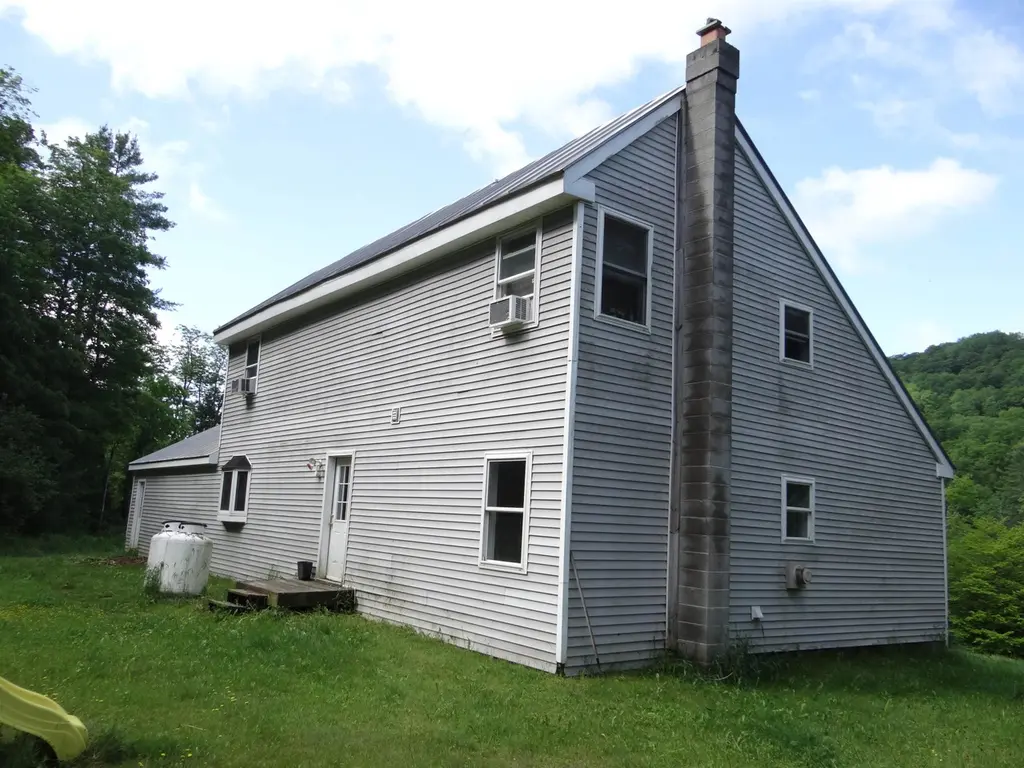
- Home design: Saltbox-style home; Existing structure; Beige exterior; Standing seam roof
- Construction: Built in 2000; Metal and wood frame construction; Stick-built off-site structure
- Exterior features: Level and sloping lot; Waterfront property directly adjoining Fay Brook with water access and water view; Easements present; Surveyed
Interior
- Kitchen: Kitchen with refrigerator and electric stove
- Bedrooms: First-floor bedroom; Second-floor bedroom; Second-floor bedroom with private bath
- Flooring: Carpet; Softwood; Combination flooring
- Bathrooms: One full bath; One three-quarter bath
- Heating & cooling: Pellet stove; Gas heater
- Interior features: Five total rooms; Full concrete basement with interior stair access
Neighborhood map
What this means for you Summary
Snapshot
- This is a 3-bed/1.0-bath single-family listed at $250k.
Deal economics
- At list price, monthly cash flow is $156 ($2k/yr) — positive.
- The deal already cash-flows at list — no discount required.
- To meet the 1% rule (rent ≥ 1% of price), the offer needs to be $234k (6.6% below list).
- Recommended offer: $234k (6.6% below list) — sets the bar for 1% rule.
Location & tenants
- Location reads 68/100 on livability (#38 in VT) — a middle-class / working-renter tenant base. Strengths: cost of living A+, housing A+; Watch: health & safety D, amenities F, commute F.
- Market conditions: 9 active listings in the ZIP; 339 units permitted in Windsor County in 2024 (240 in 5+ unit buildings).
Forward outlook
- In year one you build about $10k of equity ($2k loan paydown + $9k appreciation (3.4% local appreciation)).
- Windsor County population projected at -21% by 2050 — secular population decline; favor cash flow + early exit over multi-decade hold.
- At projected returns (3.4% appreciation + 3.0% rent growth), your $70k cash investment doubles in ~5 years — after that, you're playing with house money.
- By year 4, paydown + projected appreciation supports a ~$35k cash-out refi (75% LTV) — recoverable capital for the next deal without selling this one.
Negotiation context
- Only 5 days on market — expect competitive offers; lowballing is unlikely to land.
- Current owner paid $180k; 39% above their basis — modest negotiation headroom, anchor on the comps not their cost.
Questions for the listing agent
- Is there a deadline driving the sale (1031 exchange, divorce, estate, relocation)? That informs how much negotiation room exists.
- Schools are B-rated — typically a magnet for longer-tenancy family renters. What's the average tenant stay here, and is there a school-zone premium baked into asking?
- What's the average days-on-market for RENTAL listings here right now (not sales)? A rising rental-DOM trend means longer vacancies and softer asking-rent achievability than the comps imply.
- What's the recent tenant-quality profile in this submarket — average credit score on applications, eviction rate, late-payment / NSF rate, and stable-employment percentage? A property-management company in the area should have these aggregated.
- How much new for-sale + rental construction is in the pipeline within 1–3 miles? Heavy new supply typically softens prices + rents 12–24 months out; constrained supply supports both.
Investment metrics
- 1% rule
- 0.93% ✗
- Cap rate
- 7.04%
- Cash-on-cash
- 2.68%
- DSCR
- 1.12
- GRM
- 8.9
CMA / ARV
No comps found within radius.
Projected returns pro-forma
3.44% appreciation · 3.0% rent growth · sell at horizon
- IRR
- 11.2%
- Equity multiple
- 1.66×
- Total profit
- $45,893
- Equity at exit
- $118,600
- IRR
- 13.1%
- Equity multiple
- 3.03×
- Total profit
- $142,409
- Equity at exit
- $187,741
Cash invested: $70,000 (down + closing). Projections, not guarantees.
Landlord ↔ Tenant lean methodology
- Overall (STATE)
- 41 Moderately Tenant-Leaning
- State Vermont
- 41 Moderately Tenant-Leaning · D+15
- County
- — inherits STATE
- City
- — inherits STATE
ZIP-level market 05065
- Home prices YoY
- 1.9%
- Active inventory
- 9
- Price-to-rent
- 8.9×
Monthly cashflow live
- Estimated rent
- $2,335 medium interval (Pro) →
- Mortgage (P&I)
- −$1,311
- Tax from tax record
- −$274 /mo · $3,283/yr
- Insurance
- −$104
- HOA
- −$0
- Vacancy / Maint / Mgmt
- −$490
- Net cashflow
- $156
Break-even live
UW: 25.0% down · 7.5% · 30yr · 1.5% tax · 5.0% vac · 8.0% maint · 8.0% mgmt
Financing live
Cash to close
- Down payment
- $62,500
- Closing costs
- $7,500
- Reserves months
- —
- Total cash needed
- —
Loan-product check · same deal, 3 products live
Conventional
25% down · 7.5% · 30yr
- Down + closing
- —
- Monthly P&I
- —
- Monthly cashflow
- —
- DSCR
- —
- Eligible?
- —
Personal DTI + credit; lowest rate.
DSCR
20% down · 8.5% · 30yr
- Down + closing
- —
- Monthly P&I
- —
- Monthly cashflow
- —
- DSCR
- —
- Eligible?
- —
No personal income docs; deal must DSCR.
Hard money
10% down · 12.0% · 12mo
- Down + closing
- —
- Monthly P&I
- —
- Monthly cashflow
- —
- DSCR
- —
- Eligible?
- —
Short-term bridge; refi at stabilization.
Listing history 6 events
-
2026-06-18status $250,000 Pending 5 DOM
-
2026-06-17days on market $250,000 Active 5 DOM
-
2026-06-16days on market $250,000 Active 4 DOM
-
2026-06-15days on market $250,000 Active 3 DOM
-
2026-06-12remarks 699-char remark
-
2026-06-12$250,000 Active 1 DOM
ⓘ Source: listings_history table (triggers on properties + properties_extension) + one-shot
backfill from property_details.listing_events for pre-trigger history.
Tax reassessment forecast VT · Partial reset (capped growth)
- Current annual tax
- $3,283 · $274/mo
- Projected year-2 tax
- $4,016 · $335/mo
- Expected delta
- +$734/yr (+$61/mo · 22.3%)
ⓘ Screening estimate from a state-policy table — verify with the county assessor before closing.
Climate risk First Street
- Flood 1/10 Low FEMA zone X (unshaded) · 0% chance over 30 yrs
- Wildfire 1/10 Low
- Heat 2/10 Low 7 d/yr ≥89°F today · 17 d/yr by 30 yrs out
- Wind 2/10 Low 4% chance of damaging wind over 30 yrs
- Air quality 1/10 Low 0 unhealthy d/yr today · 0 by 30 yrs out
Nearby sold comps map
Loading sold comps map…
Walkable amenities ~0.75 mi
Loading nearby amenities…
Taxation est. · year 1
- Rental income
- $28,025
- − Mortgage interest
- −$14,004
- − Property taxes
- −$3,283
- − Insurance
- −$1,250
- − Repairs & maintenance
- −$2,242
- − Management
- −$2,242
- − Depreciation
- −$7,273
- Taxable loss
- −$2,269
- Est. tax savings @ 24.0%
- +$545
- After-tax cash flow
- $2,419/yr
For passive investors: Depreciation is non-cash, so a rental often shows a tax loss while cash-flowing — sheltering income. Rental losses are passive: they offset passive income freely, and up to $25,000/yr can offset ordinary (W-2) income if you actively participate and your MAGI is under $100k (phasing out to $0 by $150k); unused losses carry forward. On sale, claimed depreciation is recaptured at up to 25%, and gains may owe capital-gains tax (a 1031 exchange can defer both). Figures are a year-1 estimate at your 24.0% rate — not tax advice; consult a CPA.
Schools (NCES district)
No district data.
Livability — South Royalton
- Score
- 68/100
- State rank
- #38
- US rank
- #9508
Category grades
Schools grade is shown separately in the Schools card above.
Census & demographics
- Population (ZIP)
- 1,084
Population outlook (Windsor County) Hauer SSP2
- Today (2025)
- 53,235 people
- By 2030
- 51,269 · -3.7%
- By 2040
- 46,517 · -12.6%
- By 2050
- 41,859 · -21.4%
- By 2075
- 33,298 · -37.5%
- By 2100
- 24,523 · -53.9%
Race, ethnicity, and origin ACS 2023
- Neighborhood character
- Predominantly White (97%)
- Race & ethnicity
- White 97% Two or more races 2% Hispanic / Latino 1%
- Common ancestry
- Lithuanian 14% Slovak 11% Romanian 2%
- Foreign-born
- 4% · China, Canada
- Languages at home
- 93% English-only · French/Haitian/Cajun 2% German/W. Germanic 2% Spanish 1%
Political lean MEDSL · Windsor
- 2024 margin
- Solid D (+35.6) · D 66.3% · R 30.7% · Other 2.9%
- 2008→2024 swing
- -4.1pp toward R · 2008: 39.7pp · 2024: 35.6pp
- All cycles
- 2024: D+35.6 2020: D+38.9 2016: D+32.1 2012: D+38.1 2008: D+39.7
Not yet ingested
- Civics
- —
Market trends
- HPI YoY
- ▲ 3.44%
- Current HPI
- 188.9801
- Rent YoY
- —
- Metro
- —
- State GDP YoY
- —
- F500 in state
- 0
Price history
+38.9% since first listed2 events — show timeline
- 2026-06-12 Listed $250,000 PrimeMLS
- 2021-02-01 Sold (Public Records) $180,000 Public Records
Property tax history
-2.5%/yrLatest (2024): $3,283 · +2.5% YoY. Source: county tax records.
Cash-flow waterfall
monthlySold comps — $/sqft
last 12 mo · ≤1 miLoading sold comps…