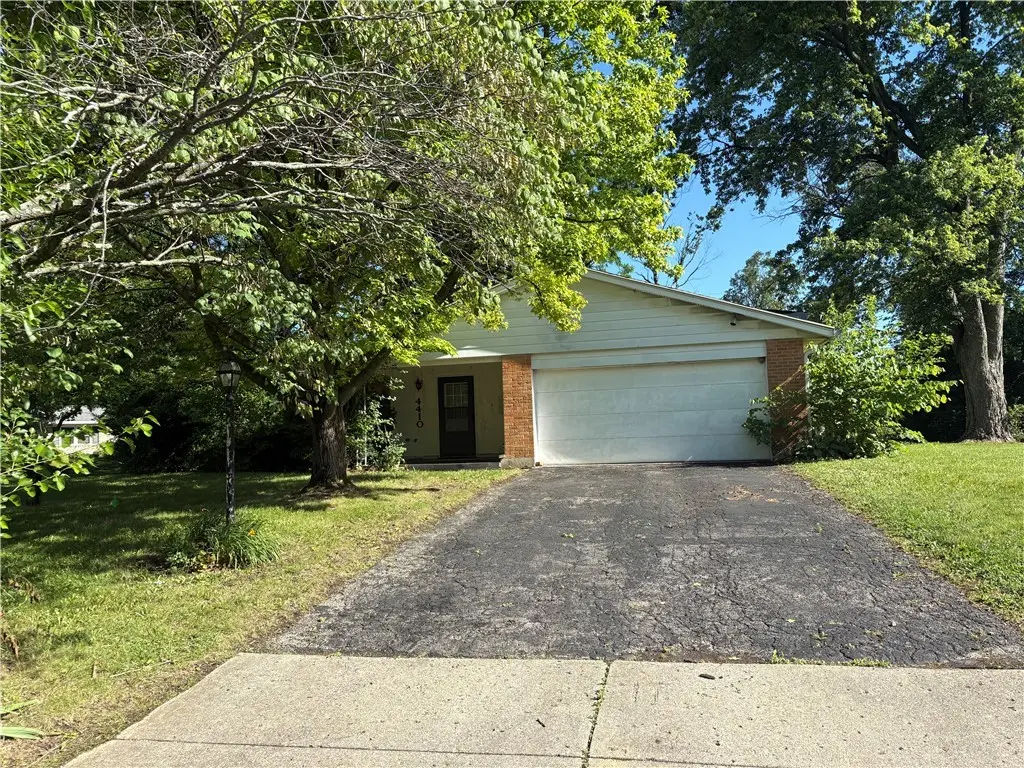
4410 Pebblestone Ct · Beavercreek, OH
Flood risk 1/10 · Minimal
- FEMA flood zone
- X (unshaded)
- Chance of flooding over 30 yrs
- 0.0%
- Est. flood insurance / yr
- $473 – $860
Fire risk 1/10 · Minimal
- Est. fire insurance / yr
- $713 – $1,323
Heat risk 3/10 · Minor
- Hot days now (above 101°F)
- 7 days/yr
- Hot days in 30 yrs
- 18 days/yr
Wind risk 2/10 · Minimal
- Chance of severe wind over 30 yrs
- 1.0%
Air-quality risk 3/10 · Minor
- Unhealthy air days now
- 2 days/yr
- Unhealthy air days in 30 yrs
- 3 days/yr
Risk factors via First Street. Map © Google.
Why this score? — see what drove the D grade
The composite is a weighted blend of 9 inputs, each scored 0–100. Each bar is that input's sub-score; the figure is the points it added to the 100-point composite (weight × sub-score).
- ARV discount +15.0/15.0
- Cash flow +6.8/30.0
- Schools +6.6/10.0
- Livability +4.4/5.0
- 1% rule +3.6/10.0
- Rent growth +2.5/5.0
- Condition / age +2.5/5.0
- DSCR +1.0/10.0
- Appreciation +0.0/10.0
$180,000
🖨 Deal sheet (PDF) 📄 Offer letter ✓ Due diligence
Listing remarks
Opportunity awaits in this spacious 4-bedroom, 2.5-bath tri-level home located in a highly desirable neighborhood in Beavercreek! Situated on a large corner lot, this property offers an incredible setting with a private backyard that backs directly to green space of a park, providing peaceful views and added privacy. Inside, you’ll find generous living spaces, a large laundry room, and a screened-in porch perfect for enjoying warm evenings and overlooking the natural surroundings. While the home is in need of updating and repairs, it offers a fantastic floor plan and endless potential for buyers looking to add their own style and build equity. Bring your ideas and imagination—th
Key facts
- 0.46 acre lot
- 2 garage spots
- Built 1974
Property features AI
Finance
- Financial info: Offered for sale
Exterior
- Parking: Attached two-car garage
- Home design: Brick construction
- Construction: Brick exterior
- Exterior features: Residential zoning; Lot about 0.46 acres
Interior
- Kitchen: Dishwasher; Range; Refrigerator
- Bedrooms: Bedroom on lower level; Bedrooms on second level
- Bathrooms: 2 full bathrooms; 1 half bathroom
- Heating & cooling: Baseboard heating (electric); Central air conditioning
- Interior features: Finished basement; Wood-burning fireplace
- Laundry & utility: Utility room on lower level
Neighborhood map
What this means for you Summary
Snapshot
- This is a 4-bed/1.5-bath single-family listed at $180k.
Deal economics
- At list price, monthly cash flow is $-280 ($-3k/yr) — negative.
- To cash-flow at today's rent, offer at most $130k (27.5% below list).
- To meet the 1% rule (rent ≥ 1% of price), the offer needs to be $155k (13.9% below list).
- Recommended offer: $130k (27.5% below list) — sets the bar for cash-flow.
- Cap rate 4.4% vs local median 3.2% in Beavercreek — top-decile yield for the area; either an underpriced asset or a hidden risk that comps aren't pricing in. Stress-test before assuming the spread holds.
Location & tenants
- Location reads 88/100 on livability (#26 in OH, #239 nationally) — a professional / high-income tenant draw. Strengths: employment A+, cost of living A+, housing A+; Watch: commute F.
- Beavercreek City (suburban): math 70% / reading 78% proficiency, ranked #79 of 656 in OH (top 12%) — strong family-tenant draw, lease renewals of 3-5y typical; only 10% free/reduced lunch — higher-income household profile.
- Zoned schools: Parkwood Elementary School (math 72% / reading 75%, grade A, #311 of 1,584 statewide, top 20%, 551 students, 20% FRL); Herman K Ankeney Middle School (math 69% / reading 77%, grade A, #105 of 654 statewide, top 17%, 704 students, 17% FRL); Beavercreek High School (math 35% / reading 86%, grade C+, #236 of 781 statewide, top 30%, 1,637 students, 13% FRL).
- Market conditions: 47 active listings in the ZIP; 1 comparable units currently listed for rent nearby; solid renter incomes; 797 units permitted in Greene County in 2024 (148 in 5+ unit buildings).
Forward outlook
- Local home prices are declining (-3.0%/yr); year-one equity from $1k of loan paydown is wiped out by about $5k of value loss. Plan a longer hold.
Negotiation context
- Only 1 days on market — expect competitive offers; lowballing is unlikely to land.
- Current owner paid $134k; 34% above their basis — modest negotiation headroom, anchor on the comps not their cost.
Risks & watch-outs
- Watch-outs: property tax is 3.2% of price.
Questions for the listing agent
- What do current leases actually rent for vs. the listed asking? Can we see a recent rent roll and the last 12 months of T-12 income?
- Built in 1974 — when were the roof, HVAC, electrical panel, plumbing, and water heater last replaced?
- Property tax is high relative to price — has the assessment been appealed recently, and will the sale trigger a re-assessment?
- Is there a deadline driving the sale (1031 exchange, divorce, estate, relocation)? That informs how much negotiation room exists.
- Schools are A-rated — typically a magnet for longer-tenancy family renters. What's the average tenant stay here, and is there a school-zone premium baked into asking?
- The area grade is low — what's the realistic commute time and amenity access for the typical tenant pool here? Any planned neighborhood developments (good or bad) we should know about?
- What's the average days-on-market for RENTAL listings here right now (not sales)? A rising rental-DOM trend means longer vacancies and softer asking-rent achievability than the comps imply.
- What's the recent tenant-quality profile in this submarket — average credit score on applications, eviction rate, late-payment / NSF rate, and stable-employment percentage? A property-management company in the area should have these aggregated.
- How much new for-sale + rental construction is in the pipeline within 1–3 miles? Heavy new supply typically softens prices + rents 12–24 months out; constrained supply supports both.
Investment metrics
- 1% rule
- 0.86% ✗
- Cap rate
- 4.42%
- Cash-on-cash
- -6.68%
- DSCR
- 0.70
- GRM
- 9.7
CMA / ARV
- ARV (on-the-fly)
- $336,336
- Comps found
- 12
Show comp detail 12 sales within ~0.75 mi
| Address | Dist | Beds/Ba | Sqft | Sold | Price | $/sf | Match |
|---|---|---|---|---|---|---|---|
| 1951 Scotch Pine Dr | 0.06mi | 4/2.5 | 2,051 (-6%) | 6mo | $365,000 | $178 | 78 |
| 1919 Willowgreen Dr | 0.23mi | 4/2.0 | 2,252 (+3%) | 8mo | $334,900 | $149 | 75 |
| 4460 Mohave Dr | 0.32mi | 4/2.0 | 2,000 (-8%) | 3mo | $317,000 | $159 | 67 |
| 852 Crestmont Dr | 0.67mi | 4/1.5 | 2,198 (+1%) | 4mo | $267,000 | $121 | 65 |
| 884 Crestmont Dr | 0.60mi | 4/2.0 | 2,160 (-1%) | 7mo | $265,500 | $123 | 62 |
| 1879 Hildreth Dr | 0.48mi | 4/2.5 | 2,343 (+7%) | 1mo | $360,000 | $154 | 60 |
| 1968 N Springcrest Ct | 0.57mi | 4/2.5 | 2,256 (+3%) | 8mo | $350,000 | $155 | 57 |
| 1841 Wilene Dr | 0.23mi | 4/3.5 | 1,863 (-15%) | 3mo | $305,000 | $164 | 54 |
| 1792 Nugget Ct | 0.64mi | 3/2.5 (-1) | 2,268 (+4%) | 2mo | $301,500 | $133 | 53 |
| 2126 Mohave Dr | 0.48mi | 5/2.5 (+1) | 2,016 (-8%) | 3mo | $301,000 | $149 | 53 |
| 4733 Harlou Dr | 0.72mi | 4/2.0 | 2,026 (-7%) | 8mo | $330,000 | $163 | 46 |
| 5619 Candlelight Ln | 0.74mi | 5/3.0 (+1) | 2,100 (-4%) | 7mo | $305,000 | $145 | 42 |
Match score weights: distance 35% · size 25% · config 20% · recency 20%. Top-matched comps best support the ARV.
Projected returns pro-forma
-3.0% appreciation · 3.0% rent growth · sell at horizon
- IRR
- -27.7%
- Equity multiple
- 0.07×
- Total profit
- $-46,846
- Equity at exit
- $26,839
- IRR
- -25.6%
- Equity multiple
- -0.25×
- Total profit
- $-63,045
- Equity at exit
- $15,563
Cash invested: $50,400 (down + closing). Projections, not guarantees.
Landlord ↔ Tenant lean methodology
- Overall (STATE)
- 73 Landlord-Friendly
- State Ohio
- 73 Landlord-Friendly · R+6
- County
- — inherits STATE
- City
- — inherits STATE
ZIP-level market 45432
- Active inventory
- 47
- Price-to-rent
- 9.7×
Monthly cashflow live
- Estimated rent
- $1,550 medium interval (Pro) →
- Mortgage (P&I)
- −$944
- Tax from tax record
- −$486 /mo · $5,832/yr
- Insurance
- −$75
- HOA
- −$0
- Vacancy / Maint / Mgmt
- −$326
- Net cashflow
- $-280
Break-even live
Sensitivity live
| Price | -10% $-179 | -5% $-229 | +0% $-280 | +5% $-331 | +10% $-382 |
|---|---|---|---|---|---|
| Rent | -10% $-403 | -5% $-342 | +0% $-280 | +5% $-219 | +10% $-158 |
| Rate | -1.0pp $-190 | -0.5pp $-235 | base $-280 | +0.5pp $-327 | +1.0pp $-375 |
UW: 25.0% down · 7.5% · 30yr · 1.5% tax · 5.0% vac · 8.0% maint · 8.0% mgmt
Financing live
Cash to close
- Down payment
- $45,000
- Closing costs
- $5,400
- Reserves months
- —
- Total cash needed
- —
Loan-product check · same deal, 3 products live
Conventional
25% down · 7.5% · 30yr
- Down + closing
- —
- Monthly P&I
- —
- Monthly cashflow
- —
- DSCR
- —
- Eligible?
- —
Personal DTI + credit; lowest rate.
DSCR
20% down · 8.5% · 30yr
- Down + closing
- —
- Monthly P&I
- —
- Monthly cashflow
- —
- DSCR
- —
- Eligible?
- —
No personal income docs; deal must DSCR.
Hard money
10% down · 12.0% · 12mo
- Down + closing
- —
- Monthly P&I
- —
- Monthly cashflow
- —
- DSCR
- —
- Eligible?
- —
Short-term bridge; refi at stabilization.
Rent comps 1 comps
| Address | Beds | Baths | Sqft | Rent | $/sqft | DOM | Units | Dist |
|---|---|---|---|---|---|---|---|---|
| 819 Gleneagle Dr Dayton, OH | 3.0 | 1.5 | 1538 | $1,550 | $1.01 | 13d | 1 | 0.86mi |
Listing history 2 events
-
2026-06-17remarks 687-char remark
-
2026-06-17$180,000 Pending 1 DOM
ⓘ Source: listings_history table (triggers on properties + properties_extension) + one-shot
backfill from property_details.listing_events for pre-trigger history.
Tax reassessment forecast OH · Partial reset (capped growth)
- Current annual tax
- $5,832 · $486/mo
- Projected year-2 tax
- $5,832 · $486/mo
- Expected delta
- $0/yr ($0/mo · 0.0%)
ⓘ Screening estimate from a state-policy table — verify with the county assessor before closing.
Climate risk First Street
- Flood 1/10 Low FEMA zone X (unshaded) · 0% chance over 30 yrs
- Wildfire 1/10 Low
- Heat 3/10 Moderate 7 d/yr ≥101°F today · 18 d/yr by 30 yrs out
- Wind 2/10 Low 100% chance of damaging wind over 30 yrs
- Air quality 3/10 Moderate 2 unhealthy d/yr today · 3 by 30 yrs out
Nearby sold comps map
Loading sold comps map…
Walkable amenities ~0.75 mi
Loading nearby amenities…
Taxation est. · year 1
- Rental income
- $18,600
- − Mortgage interest
- −$10,083
- − Property taxes
- −$5,832
- − Insurance
- −$900
- − Repairs & maintenance
- −$1,488
- − Management
- −$1,488
- − Depreciation
- −$5,236
- Taxable loss
- −$6,427
- Est. tax savings @ 24.0%
- +$1,543
- After-tax cash flow
- $-1,823/yr
For passive investors: Depreciation is non-cash, so a rental often shows a tax loss while cash-flowing — sheltering income. Rental losses are passive: they offset passive income freely, and up to $25,000/yr can offset ordinary (W-2) income if you actively participate and your MAGI is under $100k (phasing out to $0 by $150k); unused losses carry forward. On sale, claimed depreciation is recaptured at up to 25%, and gains may owe capital-gains tax (a 1031 exchange can defer both). Figures are a year-1 estimate at your 24.0% rate — not tax advice; consult a CPA.
Schools (NCES district)
- District
- Beavercreek City
- NCES district ID
- 3904724
- Math proficiency
- 70% ▼ -9.00%
- Reading proficiency
- 78% ▼ -1.00%
- Median HH income
- $80,251
- Composite
- 65.55/100
- National rank
- #469
- State rank
- #79 of 656 in OH
Livability — Beavercreek
- Score
- 88/100
- State rank
- #26
- US rank
- #239
Category grades
Schools grade is shown separately in the Schools card above.
Census & demographics
- Census place
- Beavercreek, OH
- County
- Greene · 199,376 people
- City population
- 27,951
- Metro
- Dayton-Kettering-Beavercreek, OH
- Population (ZIP)
- 14,988
- Household income
- $83,323
- Rent vs Own
- Severe rent burden
- 9.8
Population outlook (Greene County) Hauer SSP2
- Today (2025)
- 170,301 people
- By 2030
- 171,840 · +0.9%
- By 2040
- 171,408 · +0.7%
- By 2050
- 167,806 · -1.5%
- By 2075
- 154,430 · -9.3%
- By 2100
- 138,669 · -18.6%
Race, ethnicity, and origin ACS 2023
- Neighborhood character
- Predominantly White (84%)
- Race & ethnicity
- White 84% Two or more races 7% Asian 3% Black 3% Hispanic / Latino 3%
- Common ancestry
- Romanian 4% Slovak 3% Italian 2%
- Foreign-born
- 4% · Canada, India
- Languages at home
- 94% English-only · Spanish 2% Other Indo-European 2% German/W. Germanic 1%
Political lean MEDSL · Greene
- 2024 margin
- R (+19.8) · D 39.5% · R 59.3% · Other 1.2%
- 2008→2024 swing
- -1.4pp toward R · 2008: -18.4pp · 2024: -19.8pp
- All cycles
- 2024: R+19.8 2020: R+19.5 2016: R+24.5 2012: R+21.8 2008: R+18.4
Not yet ingested
- Civics
- —
Market trends
- HPI YoY
- ▼ -187.81%
- Current HPI
- 290.3859
- Rent YoY
- —
- Metro
- —
- State GDP YoY
- ▲ 1.98%
- F500 in state
- 48
Industry mix (Fortune 500 HQ in OH)
| Industry | F500 HQs | Revenue |
|---|---|---|
| Insurance | 3 | $145B |
|
||
| Industrial Machinery | 3 | $49B |
|
||
| Financial Services | 3 | $24B |
|
||
| Consumer Goods | 2 | $93B |
|
||
| Aerospace / Defense | 2 | $47B |
|
||
| Utilities | 2 | $33B |
|
||
Price history
+33.8% since first listed3 events — show timeline
- 2026-06-17 Pending — Dayton MLS
- 2026-06-17 Listed $180,000 Dayton MLS
- 1999-12-16 Sold (Public Records) $134,500 Public Records
Property tax history
+3.0%/yrLatest (2025): $5,832 · +1.0% YoY. Source: county tax records.
Cash-flow waterfall
monthlySold comps — $/sqft
last 12 mo · ≤1 miLoading sold comps…