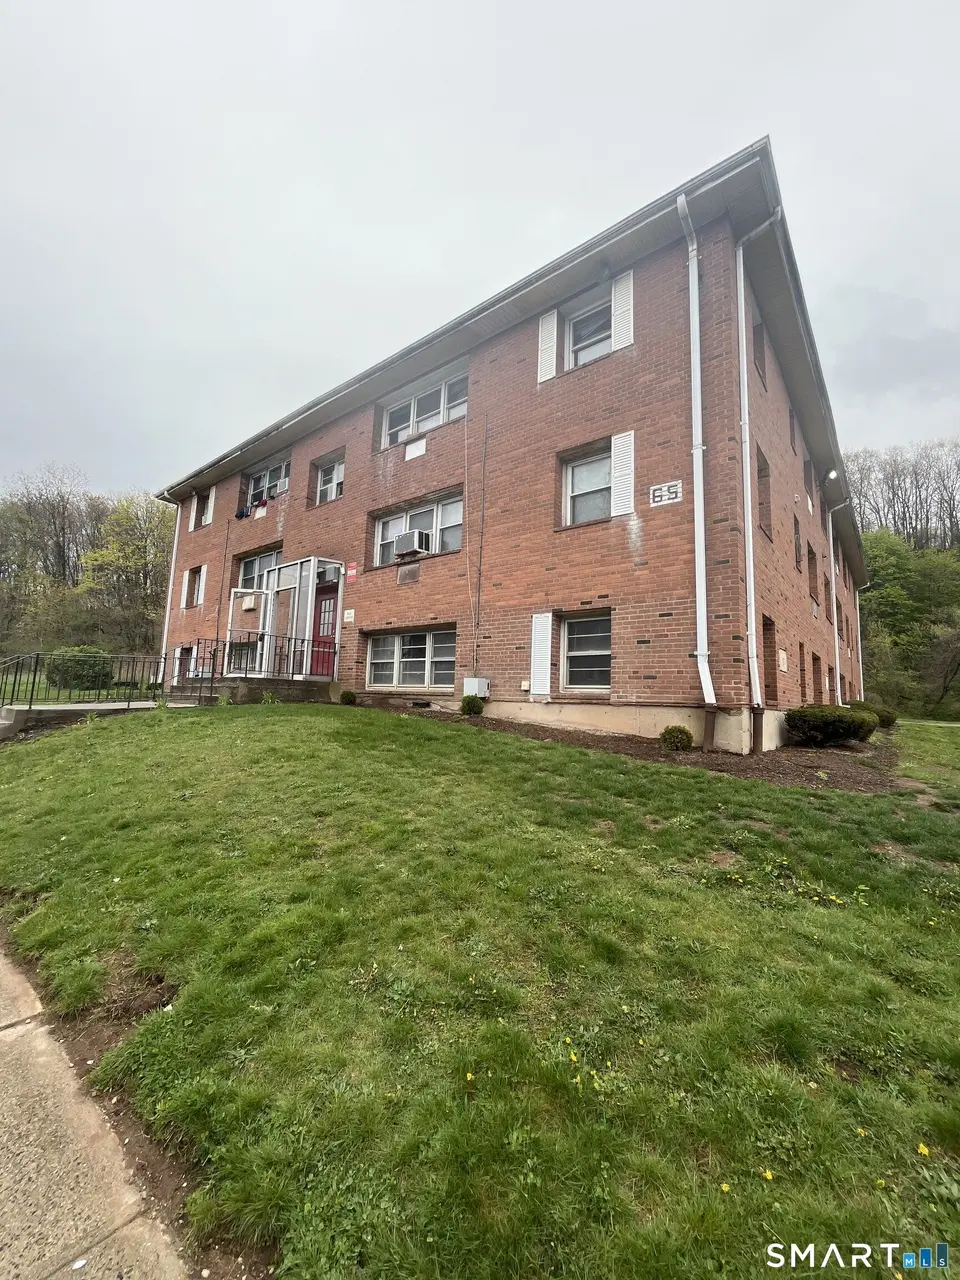
65 Donna Dr Unit C2 · New Haven, CT
Flood risk 1/10 · Minimal
- FEMA flood zone
- X (unshaded)
- Chance of flooding over 30 yrs
- 0.0%
- Est. flood insurance / yr
- $507 – $1,088
Fire risk 3/10 · Minor
- Est. fire insurance / yr
- $829 – $1,539
Heat risk 6/10 · Moderate
- Hot days now (above 97°F)
- 7 days/yr
- Hot days in 30 yrs
- 15 days/yr
Wind risk 6/10 · Moderate
- Chance of severe wind over 30 yrs
- 54.0%
Air-quality risk 5/10 · Moderate
- Unhealthy air days now
- 6 days/yr
- Unhealthy air days in 30 yrs
- 8 days/yr
Risk factors via First Street. Map © Google.
Why this score? — see what drove the D grade
The composite is a weighted blend of 9 inputs, each scored 0–100. Each bar is that input's sub-score; the figure is the points it added to the 100-point composite (weight × sub-score).
- Cash flow +18.1/30.0
- 1% rule +6.4/10.0
- DSCR +5.7/10.0
- Livability +4.0/5.0
- Rent growth +3.5/5.0
- Condition / age +2.5/5.0
- Schools +1.5/10.0
- ARV discount +0.0/15.0
- Appreciation +0.0/10.0
$135,000
🖨 Deal sheet (PDF) 📄 Offer letter ✓ Due diligence
Listing remarks
Charming and bright 1 bed, 1 bath condo in the desirable Ridgeview Condominiums complex. This residence offers a well designed floor plan with a spacious living room that flows into the kitchen, ideal for relaxed living or entertaining. Enjoy generous closet space including a walk-in closet, and convenient on-site laundry facilities just steps away. Ready for its next owner, this unit features off-street parking and easy access to shopping, bus lines, and commuter routes. Perfect for first time buyers, investors, or those seeking low maintenance living in a well managed community. Don't miss this opportunity to own in a sought-after New Haven location!
Key facts
- Walk-in closet
- Off-street parking
- $242 HOA
Tags
Property features AI
Finance
- HOA & community: Monthly HOA fee of $242; HOA covers grounds maintenance, trash pickup, snow removal, water and sewer; Pets are not allowed
Exterior
- Utilities: Public water; Public sewer
- Home design: Condominium; Located in the Ridgeview complex
- Construction: Brick construction
- Exterior features: Brick exterior
Interior
- Bedrooms: One bedroom
- Bathrooms: One full bathroom
- Heating & cooling: Electric baseboard heat
- Interior features: One-level unit; No basement
Neighborhood map
What this means for you Summary
Snapshot
- This is a 1-bed/1.0-bath condo listed at $135k.
Deal economics
- At list price, monthly cash flow is $119 ($1k/yr) — positive.
- The deal already cash-flows at list — no discount required.
- Meets the 1% rule at list price ($2k rent vs $135k).
- Recommended offer: $131k (3.0% below list) — sets the bar for market timing.
- Cap rate 7.4% vs local median 4.8% in New Haven — top-decile yield for the area; either an underpriced asset or a hidden risk that comps aren't pricing in. Stress-test before assuming the spread holds.
Location & tenants
- Location reads 79/100 on livability (#31 in CT, #2,190 nationally) — a middle-class / working-renter tenant base. Strengths: amenities A+, commute A+, health & safety A+; Watch: schools D+, employment D, crime F.
- New Haven School District (urban): math 12% / reading 25% proficiency, ranked #147 of 153 in CT (top 96%) — low school quality limits family demand, transient renter base, plan for 1-2y turnover; 66% free/reduced lunch — lower-income household profile, screen leases tightly.
- Market conditions: Rents rising fast (+4.1%/yr); 101 active listings in the ZIP; 6 comparable units currently listed for rent nearby; rentals lingering (median 45d on market — plan ~5-8 weeks vacancy on turnover, expect pricing pressure); 67% of comp listings sitting > 30 days — soft ceiling on asking rent; 1,059 units permitted in South Central Connecticut Planning Region in 2024 (779 in 5+ unit buildings).
- This rent runs 38% of the median local income ($48k/yr) — at the standard rent-burdened threshold; future hikes will face affordability resistance.
Forward outlook
- Local home prices are declining (-3.0%/yr); year-one equity from $933 of loan paydown is wiped out by about $4k of value loss. Plan a longer hold.
Negotiation context
- It's been on market 34 days — a 3% lower offer ($131k) is reasonable based on typical stale-listing flexibility.
- 2 sale attempts with the ask held roughly flat each time — persistent listings suggest the price (not the market) is what's stuck; bring a comps-based counter.
- Current owner paid $69k; list at $135k implies a 96% gain — meaningful room to come down on a strong offer.
Risks & watch-outs
- Climate carrying-cost: major wind risk, 54% chance of damaging wind over 30y; extreme-heat days projected 7→15/yr by 2055 (HVAC capex compounding) — expect insurance premiums to compound above CPI over the hold.
Questions for the listing agent
- It's been on market 34 days. Have you received any prior offers? Is the seller open to a 3% concession, seller financing, or rate buy-down credit?
- Built in 1967 — when were the roof, HVAC, electrical panel, plumbing, and water heater last replaced?
- What does the HOA fee cover, when was the last increase, and are there any pending special assessments or reserve-fund shortfalls?
- Any open or pending special assessments — roof, HVAC, plumbing, elevator, façade? What's the per-unit balance and payoff schedule, and is the seller paying it off at close or rolling it to the buyer?
- Is there a deadline driving the sale (1031 exchange, divorce, estate, relocation)? That informs how much negotiation room exists.
- Schools are D-rated, which usually means shorter tenancies and higher turnover. Who's the typical renter profile here, and what's been the actual vacancy rate?
- Crime grade is F in this area — have there been break-ins, vandalism, or insurance claims at this property in the last 3 years? What carrier currently insures it and at what premium?
- The area grade is low — what's the realistic commute time and amenity access for the typical tenant pool here? Any planned neighborhood developments (good or bad) we should know about?
- What's the average days-on-market for RENTAL listings here right now (not sales)? A rising rental-DOM trend means longer vacancies and softer asking-rent achievability than the comps imply.
- What's the recent tenant-quality profile in this submarket — average credit score on applications, eviction rate, late-payment / NSF rate, and stable-employment percentage? A property-management company in the area should have these aggregated.
- How much new apartment / multifamily construction is in the pipeline within 1–3 miles? Heavy new supply (>2% of stock underway) typically softens rents 12–24 months out; light construction supports rent growth.
Investment metrics
- 1% rule
- 1.14% ✓
- Cap rate
- 7.35%
- Cash-on-cash
- 3.79%
- DSCR
- 1.17
- GRM
- 7.3
CMA / ARV
- ARV (median comp)
- $93,448
- List price
- $135,000
- Delta
- 44.47%
- Verdict
- OVERPRICED
- Comps
- 20 within 1.0 mi
Projected returns pro-forma
-3.0% appreciation · 4.12% rent growth · sell at horizon
- IRR
- -8.8%
- Equity multiple
- 0.67×
- Total profit
- $-12,393
- Equity at exit
- $20,129
- IRR
- 2.4%
- Equity multiple
- 1.18×
- Total profit
- $6,870
- Equity at exit
- $11,672
Cash invested: $37,800 (down + closing). Projections, not guarantees.
Landlord ↔ Tenant lean methodology
- Overall (STATE)
- 27 Tenant-Leaning
- State Connecticut
- 27 Tenant-Leaning · D+7
- County
- — inherits STATE
- City
- — inherits STATE
ZIP-level market 06513
- Home prices YoY
- -7.8%
- Rents YoY
- 4.1%
- Active inventory
- 101
- Price-to-rent
- 7.3×
Monthly cashflow live
- Estimated rent
- $1,540 high interval (Pro) →
- Mortgage (P&I)
- −$708
- Tax from tax record
- −$91 /mo · $1,088/yr
- Insurance
- −$56
- HOA
- −$242
- Vacancy / Maint / Mgmt
- −$323
- Net cashflow
- $119
Break-even live
Sensitivity live
| Price | -10% $196 | -5% $158 | +0% $119 | +5% $81 | +10% $43 |
|---|---|---|---|---|---|
| Rent | -10% $-2 | -5% $59 | +0% $119 | +5% $180 | +10% $241 |
| Rate | -1.0pp $187 | -0.5pp $154 | base $119 | +0.5pp $84 | +1.0pp $49 |
UW: 25.0% down · 7.5% · 30yr · 1.5% tax · 5.0% vac · 8.0% maint · 8.0% mgmt
Financing live
Cash to close
- Down payment
- $33,750
- Closing costs
- $4,050
- Reserves months
- —
- Total cash needed
- —
Loan-product check · same deal, 3 products live
Conventional
25% down · 7.5% · 30yr
- Down + closing
- —
- Monthly P&I
- —
- Monthly cashflow
- —
- DSCR
- —
- Eligible?
- —
Personal DTI + credit; lowest rate.
DSCR
20% down · 8.5% · 30yr
- Down + closing
- —
- Monthly P&I
- —
- Monthly cashflow
- —
- DSCR
- —
- Eligible?
- —
No personal income docs; deal must DSCR.
Hard money
10% down · 12.0% · 12mo
- Down + closing
- —
- Monthly P&I
- —
- Monthly cashflow
- —
- DSCR
- —
- Eligible?
- —
Short-term bridge; refi at stabilization.
Rent comps 6 comps
| Address | Beds | Baths | Sqft | Rent | $/sqft | DOM | Units | Dist |
|---|---|---|---|---|---|---|---|---|
| 430 Eastern St New Haven, CT | 1.0–3.0 | 1.0–1.5 | 900 | $1,600 | $1.78 | 3d | 2 | 0.61mi |
| 339 Eastern St New Haven, CT | 2.0 | 1.0 | 505 | $1,475 | $2.92 | 44d | 6 | 0.87mi |
| 1435 State St Unit 101 New Haven, CT | — | 1.0 | 622 | $1,550 | $2.49 | 44d | 1 | 1.07mi |
| 1397 State St Unit B-2 New Haven, CT | 1.0 | 1.0 | 500 | $1,495 | $2.99 | 44d | 1 | 1.12mi |
| 1399 State St Unit 5B New Haven, CT | 1.0 | 1.0 | 700 | $1,595 | $2.28 | 44d | 1 | 1.12mi |
| 142 Rowe St New Haven, CT | 2.0 | 1.0 | 350 | $1,675 | $4.79 | 15d | 1 | 1.21mi |
HOA detail condo
- Monthly dues
- $242 · $2,904/yr
- Assessments
- None detected in remarks — confirm with the listing agent.
Listing history 19 events
-
2026-06-18days on market $135,000 Active 34 DOM
-
2026-06-17days on market $135,000 Active 33 DOM
-
2026-06-16days on market $135,000 Active 32 DOM
-
2026-06-15days on market $135,000 Active 31 DOM
-
2026-06-14days on market $135,000 Active 29 DOM
-
2026-06-13days on market $135,000 Active 28 DOM
-
2026-06-10days on market $135,000 Active 26 DOM
-
2026-06-09days on market $135,000 Active 25 DOM
-
2026-06-08days on market $135,000 Active 24 DOM
-
2026-06-07days on market $135,000 Active 23 DOM
-
2026-06-05days on market $135,000 Active 20 DOM
-
2026-06-03days on market $135,000 Active 19 DOM
-
2026-06-03days on market $135,000 Active 18 DOM
-
2026-06-01days on market $135,000 Active 17 DOM
-
2026-05-31days on market $135,000 Active 16 DOM
-
2026-04-20$135,000 Active 660-char remark
-
2026-03-04historical
-
2026-03-03$112,000 Active
-
1988-03-08soldstatus $69,000
ⓘ Source: listings_history table (triggers on properties + properties_extension) + one-shot
backfill from property_details.listing_events for pre-trigger history.
Tax reassessment forecast CT · Partial reset (capped growth)
- Current annual tax
- $1,088 · $91/mo
- Projected year-2 tax
- $1,988 · $166/mo
- Expected delta
- +$900/yr (+$75/mo · 82.8%)
ⓘ Screening estimate from a state-policy table — verify with the county assessor before closing.
Climate risk First Street
- Flood 1/10 Low FEMA zone X (unshaded) · 0% chance over 30 yrs
- Wildfire 3/10 Moderate
- Heat 6/10 Major 7 d/yr ≥97°F today · 15 d/yr by 30 yrs out
- Wind 6/10 Major 54% chance of damaging wind over 30 yrs
- Air quality 5/10 Major 6 unhealthy d/yr today · 8 by 30 yrs out
Nearby sold comps map
Loading sold comps map…
Walkable amenities ~0.75 mi
Loading nearby amenities…
Taxation est. · year 1
- Rental income
- $18,475
- − Mortgage interest
- −$7,562
- − Property taxes
- −$1,088
- − Insurance
- −$675
- − Repairs & maintenance
- −$1,478
- − Management
- −$1,478
- − HOA
- −$2,904
- − Depreciation
- −$3,927
- Taxable loss
- −$637
- Est. tax savings @ 24.0%
- +$153
- After-tax cash flow
- $1,586/yr
For passive investors: Depreciation is non-cash, so a rental often shows a tax loss while cash-flowing — sheltering income. Rental losses are passive: they offset passive income freely, and up to $25,000/yr can offset ordinary (W-2) income if you actively participate and your MAGI is under $100k (phasing out to $0 by $150k); unused losses carry forward. On sale, claimed depreciation is recaptured at up to 25%, and gains may owe capital-gains tax (a 1031 exchange can defer both). Figures are a year-1 estimate at your 24.0% rate — not tax advice; consult a CPA.
Schools (NCES district)
- District
- New Haven School District
- NCES district ID
- 0902790
- Math proficiency
- 12% ▼ -10.00%
- Reading proficiency
- 25% ▼ -10.00%
- Median HH income
- $38,058
- Composite
- 15.48/100
- National rank
- #9308
- State rank
- #147 of 153 in CT
Livability — New Haven
- Score
- 79/100
- State rank
- #31
- US rank
- #2190
Category grades
Schools grade is shown separately in the Schools card above.
Census & demographics
- Census place
- New Haven, CT
- County
- New Haven County · 688,236 people
- City population
- 132,813
- Metro
- New Haven-Milford, CT
- Population (ZIP)
- 38,888
- Household income
- $48,500
- Rent vs Own
- Severe rent burden
- 2664.0
Population outlook (South Central Connecticut County) Hauer SSP2
- By 2040
- 608,362
Race, ethnicity, and origin ACS 2023
- Neighborhood character
- Diverse neighborhood (Simpson 0.66)
- Race & ethnicity
- Hispanic / Latino 47% White 26% Black 22% Two or more races 12% Asian 1%
- Hispanic origin (detail)
- Mexican 7% Puerto Rican 25% Dominican 2%
- Common ancestry
- Romanian 2% Lithuanian 1% Slovak 1%
- Foreign-born
- 17% · Canada, Jamaica, South Korea
- Languages at home
- 56% English-only · Spanish 39% Other Indo-European 1% Russian/Polish/Slavic 1%
Political lean MEDSL · South Central Connecticut
- 2024 margin
- Strong D (+20.1) · D 59.0% · R 38.9% · Other 2.1%
- All cycles
- 2024: D+20.1
Not yet ingested
- Civics
- —
Market trends
- HPI YoY
- ▼ -30.87%
- Current HPI
- 364.006
- Rent YoY
- ▲ 4.12%
- Metro
- New Haven-Milford, CT
- State GDP YoY
- ▲ 1.06%
- F500 in state
- 38
Industry mix (Fortune 500 HQ in CT)
| Industry | F500 HQs | Revenue |
|---|---|---|
| Industrial Machinery | 4 | $38B |
|
||
| Insurance | 3 | $71B |
|
||
| Financial Services | 2 | $25B |
|
||
| Transportation / Logistics | 2 | $18B |
|
||
| Healthcare | 1 | $247B |
|
||
| Telecommunications | 1 | $55B |
|
||
Price history
+95.7% since first listed4 events — show timeline
- 2026-04-20 Listed $135,000 Smart MLS
- 2026-03-04 Listing Removed — Smart MLS
- 2026-03-03 Listed $112,000 Smart MLS
- 1988-03-08 Sold (Public Records) $69,000 Public Records
Property tax history
+3.0%/yrLatest (2023): $1,088 · -6.4% YoY. Source: county tax records.
Cash-flow waterfall
monthlySold comps — $/sqft
last 12 mo · ≤1 miLoading sold comps…