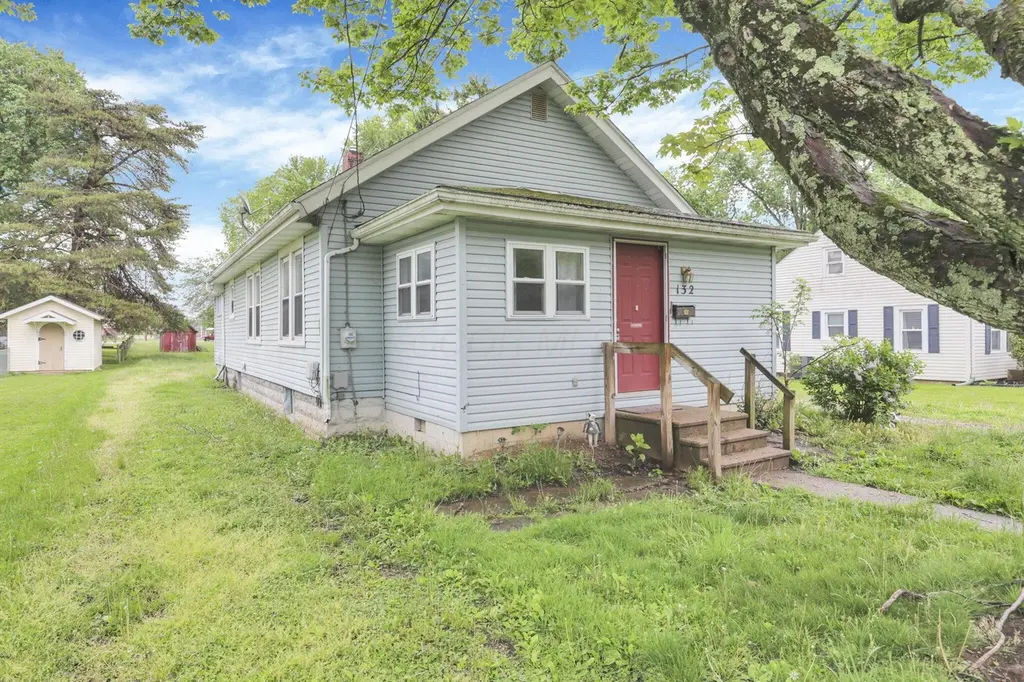
132 N Westmoor Ave · Newark, OH
Flood risk 1/10 · Minimal
- FEMA flood zone
- X (unshaded)
- Chance of flooding over 30 yrs
- 0.0%
- Est. flood insurance / yr
- $473 – $860
Fire risk 1/10 · Minimal
- Est. fire insurance / yr
- $713 – $1,323
Heat risk 3/10 · Minor
- Hot days now (above 99°F)
- 7 days/yr
- Hot days in 30 yrs
- 18 days/yr
Wind risk 2/10 · Minimal
- Chance of severe wind over 30 yrs
- —
Air-quality risk 2/10 · Minimal
- Unhealthy air days now
- 1 days/yr
- Unhealthy air days in 30 yrs
- 2 days/yr
Risk factors via First Street. Map © Google.
Why this score? — see what drove the C+ grade
The composite is a weighted blend of 9 inputs, each scored 0–100. Each bar is that input's sub-score; the figure is the points it added to the 100-point composite (weight × sub-score).
- Cash flow +20.5/30.0
- ARV discount +15.0/15.0
- DSCR +6.5/10.0
- 1% rule +5.0/10.0
- Schools +4.3/10.0
- Livability +3.5/5.0
- Rent growth +2.9/5.0
- Condition / age +2.5/5.0
- Appreciation +0.0/10.0
$160,000
🖨 Deal sheet 📄 Offer letter ✓ Due diligence
Listing remarks MLS
Great home, near the hospital, shopping and St. Rt. 16. Beautiful woodwork gives this home lots of character. Freshly painted, newer roof, siding, & windows. Spacious 'L' shaped 3/4 acre lot. Vacant & super easy to show.
Key facts
- 3-bedroom layout
- Renovation project
- 0.75 acre lot
Tags
Property features AI
Finance
- Other: Standard listing conditions
Exterior
- Utilities: Public water; Public sewer
- Home design: Single-family residence; One story; No shared/common walls; Built in 1940
- Construction: Block foundation
- Exterior features: Block foundation; 0.75-acre lot
Interior
- Bedrooms: 2 main-level bedrooms
- Flooring: Wood flooring; Carpet
- Bathrooms: 1 full bathroom
- Heating & cooling: Central air conditioning
- Interior features: Insulated windows; Basement
Neighborhood map
What this means for you Summary
Snapshot
- This is a 3-bed/1.0-bath single-family listed at $160k.
Deal economics
- At list price, monthly cash flow is $210 ($3k/yr) — positive.
- The deal already cash-flows at list — no discount required.
- To meet the 1% rule (rent ≥ 1% of price), the offer needs to be $160k (0.1% below list).
- Recommended offer: $160k (0.1% below list) — sets the bar for 1% rule.
- Cap rate 7.9% vs local median 3.2% in Newark — top-decile yield for the area; either an underpriced asset or a hidden risk that comps aren't pricing in. Stress-test before assuming the spread holds.
Location & tenants
- Location reads 69/100 on livability (#493 in OH) — a middle-class / working-renter tenant base. Strengths: cost of living A+, housing A+, schools B; Watch: employment D+, amenities F, commute F.
- Newark City (suburban): math 48% / reading 56% proficiency, ranked #431 of 656 in OH (top 66%) — acceptable for families but not a draw, mixed tenant base, ~2y average lease.
- Market conditions: Rents rising (+1.6%/yr); 204 active listings in the ZIP; 6 comparable units currently listed for rent nearby; rentals leasing fast (median 4d on market — plan ~1-2 weeks tenant-placement turnaround); 159 units permitted in Licking County in 2024 (0 in 5+ unit buildings).
Forward outlook
- Local home prices are declining (-3.0%/yr); year-one equity from $1k of loan paydown is wiped out by about $5k of value loss. Plan a longer hold.
Negotiation context
- Only 9 days on market — expect competitive offers; lowballing is unlikely to land.
- 2 sale attempts since 22y ago with the ask held roughly flat each time — persistent listings suggest the price (not the market) is what's stuck; bring a comps-based counter.
- Current owner paid $80k; list at $160k implies a 100% gain — meaningful room to come down on a strong offer.
Risks & watch-outs
- Watch-outs: built in 1940 — expect roof / HVAC / electrical / plumbing capex.
Questions for the listing agent
- Built in 1940 — when were the roof, HVAC, electrical panel, plumbing, and water heater last replaced?
- Is there a deadline driving the sale (1031 exchange, divorce, estate, relocation)? That informs how much negotiation room exists.
- Schools are B-rated — typically a magnet for longer-tenancy family renters. What's the average tenant stay here, and is there a school-zone premium baked into asking?
- What's the average days-on-market for RENTAL listings here right now (not sales)? A rising rental-DOM trend means longer vacancies and softer asking-rent achievability than the comps imply.
- What's the recent tenant-quality profile in this submarket — average credit score on applications, eviction rate, late-payment / NSF rate, and stable-employment percentage? A property-management company in the area should have these aggregated.
- How much new for-sale + rental construction is in the pipeline within 1–3 miles? Heavy new supply typically softens prices + rents 12–24 months out; constrained supply supports both.
Investment metrics
- 1% rule
- 1.00% ✗
- Cap rate
- 7.87%
- Cash-on-cash
- 5.63%
- DSCR
- 1.25
- GRM
- 8.3
CMA / ARV
- ARV (on-the-fly)
- $192,672
- Comps found
- 10
Show comp detail 10 sales within ~0.75 mi
| Address | Dist | Beds/Ba | Sqft | Sold | Price | $/sf | Match |
|---|---|---|---|---|---|---|---|
| 189 N Westmoor Ave | 0.12mi | 2/1.0 (-1) | 950 (+10%) | 7mo | $155,000 | $163 | 67 |
| 69 N Terrace Ave | 0.25mi | 3/1.0 | 988 (+14%) | 2mo | $224,000 | $227 | 63 |
| 109 Garrick St | 0.27mi | 3/1.5 | 900 (+4%) | 20mo | $200,000 | $222 | 62 |
| 54 S 33rd St | 0.59mi | 3/1.0 | 864 (0%) | 14mo | $171,000 | $198 | 61 |
| 1208 Wintermute Ave | 0.49mi | 2/1.0 (-1) | 864 (0%) | 14mo | $224,900 | $260 | 60 |
| 111 Kemp St | 0.47mi | 3/1.0 | 979 (+13%) | 8mo | $168,000 | $172 | 49 |
| 183 S 36th St | 0.56mi | 2/1.0 (-1) | 960 (+11%) | 9mo | $224,000 | $233 | 43 |
| 1723 Lakeview Dr | 0.45mi | 3/1.0 | 960 (+11%) | 24mo | $214,500 | $223 | 40 |
| 70 N 40th St | 0.59mi | 3/1.0 | 984 (+14%) | 12mo | $215,000 | $218 | 39 |
| 162 S 32nd St | 0.71mi | 2/1.0 (-1) | 792 (-8%) | 14mo | $193,500 | $244 | 36 |
Match score weights: distance 35% · size 25% · config 20% · recency 20%. Top-matched comps best support the ARV.
Projected returns pro-forma
-3.0% appreciation · 1.63% rent growth · sell at horizon
- IRR
- -9.1%
- Equity multiple
- 0.67×
- Total profit
- $-14,722
- Equity at exit
- $23,857
- IRR
- -1.5%
- Equity multiple
- 0.90×
- Total profit
- $-4,293
- Equity at exit
- $13,834
Cash invested: $44,800 (down + closing). Projections, not guarantees.
Landlord ↔ Tenant lean methodology
- Overall (STATE)
- 73 Landlord-Friendly
- State Ohio
- 73 Landlord-Friendly · R+6
- County
- — inherits STATE
- City
- — inherits STATE
ZIP-level market 43055
- Rents YoY
- 1.6%
- Active inventory
- 204
- Price-to-rent
- 8.3×
Monthly cashflow live
- Estimated rent
- $1,599 high interval (Pro) →
- Mortgage (P&I)
- −$839
- Tax from tax record
- −$147 /mo · $1,763/yr
- Insurance
- −$67
- HOA
- −$0
- Vacancy / Maint / Mgmt
- −$336
- Net cashflow
- $210
Break-even live
UW: 25.0% down · 7.5% · 30yr · 1.5% tax · 5.0% vac · 8.0% maint · 8.0% mgmt
Financing live
Cash to close
- Down payment
- $40,000
- Closing costs
- $4,800
- Reserves months
- —
- Total cash needed
- —
Loan-product check · same deal, 3 products live
Conventional
25% down · 7.5% · 30yr
- Down + closing
- —
- Monthly P&I
- —
- Monthly cashflow
- —
- DSCR
- —
- Eligible?
- —
Personal DTI + credit; lowest rate.
DSCR
20% down · 8.5% · 30yr
- Down + closing
- —
- Monthly P&I
- —
- Monthly cashflow
- —
- DSCR
- —
- Eligible?
- —
No personal income docs; deal must DSCR.
Hard money
10% down · 12.0% · 12mo
- Down + closing
- —
- Monthly P&I
- —
- Monthly cashflow
- —
- DSCR
- —
- Eligible?
- —
Short-term bridge; refi at stabilization.
Rent comps 6 comps
| Address | Beds | Baths | Sqft | Rent | $/sqft | DOM | Units | Dist |
|---|---|---|---|---|---|---|---|---|
| 120 S 32nd St Newark, OH | 2.0 | 1.0 | 1100 | $2,900 | $2.64 | 3d | 1 | 0.70mi |
| 507 S 30th St Apt D Heath, OH | 2.0 | 1.0 | 900 | $1,195 | $1.33 | 1d | 1 | 1.00mi |
| 1420 Londondale Pkwy Unit 911B Newark, OH | 2.0 | 1.0 | 850 | $1,300 | $1.53 | 12d | 1 | 1.05mi |
| 2010 W Main St Newark, OH | 1.0–2.0 | 1.0–2.0 | 852 | $1,781 | $2.09 | 1d | 106 | 1.14mi |
| 718 Rice St Newark, OH | 2.0 | 1.0 | 924 | $1,100 | $1.19 | 1d | 1 | 1.39mi |
| 718 Rice St Newark, OH | 2.0 | 1.0 | 924 | $1,100 | $1.19 | 23d | 1 | 1.39mi |
Listing history 6 events
-
2026-05-10status Pending
-
2026-04-30$160,000 Active
-
2005-08-08soldstatus $80,000
-
2005-08-04soldstatus $80,000 231-char remark
Show marketing remark (231 chars)
Great home, near the hospital, shopping and St. Rt. 16. Beautiful woodwork gives this home lots of character. Freshly painted, newer roof, siding, & windows. Spacious 'L' shaped 3/4 acre lot. Vacant & super easy to show.
-
2005-07-05historical 231-char remark
Show marketing remark (231 chars)
Great home, near the hospital, shopping and St. Rt. 16. Beautiful woodwork gives this home lots of character. Freshly painted, newer roof, siding, & windows. Spacious 'L' shaped 3/4 acre lot. Vacant & super easy to show.
-
2004-10-06$82,500 231-char remark
Show marketing remark (231 chars)
Great home, near the hospital, shopping and St. Rt. 16. Beautiful woodwork gives this home lots of character. Freshly painted, newer roof, siding, & windows. Spacious 'L' shaped 3/4 acre lot. Vacant & super easy to show.
ⓘ Source: listings_history table (triggers on properties + properties_extension) + one-shot
backfill from property_details.listing_events for pre-trigger history.
Tax reassessment forecast OH · Partial reset (capped growth)
- Current annual tax
- $1,763 · $147/mo
- Projected year-2 tax
- $2,130 · $177/mo
- Expected delta
- +$366/yr (+$31/mo · 20.8%)
ⓘ Screening estimate from a state-policy table — verify with the county assessor before closing.
Climate risk First Street
- Flood 1/10 Low FEMA zone X (unshaded) · 0% chance over 30 yrs
- Wildfire 1/10 Low
- Heat 3/10 Moderate 7 d/yr ≥99°F today · 18 d/yr by 30 yrs out
- Wind 2/10 Low
- Air quality 2/10 Low 1 unhealthy d/yr today · 2 by 30 yrs out
Nearby sold comps map
Loading sold comps map…
Walkable amenities ~0.75 mi
Loading nearby amenities…
Taxation est. · year 1
- Rental income
- $19,183
- − Mortgage interest
- −$8,962
- − Property taxes
- −$1,763
- − Insurance
- −$800
- − Repairs & maintenance
- −$1,535
- − Management
- −$1,535
- − Depreciation
- −$4,655
- Taxable loss
- −$67
- Est. tax savings @ 24.0%
- +$16
- After-tax cash flow
- $2,538/yr
For passive investors: Depreciation is non-cash, so a rental often shows a tax loss while cash-flowing — sheltering income. Rental losses are passive: they offset passive income freely, and up to $25,000/yr can offset ordinary (W-2) income if you actively participate and your MAGI is under $100k (phasing out to $0 by $150k); unused losses carry forward. On sale, claimed depreciation is recaptured at up to 25%, and gains may owe capital-gains tax (a 1031 exchange can defer both). Figures are a year-1 estimate at your 24.0% rate — not tax advice; consult a CPA.
Schools (NCES district)
- District
- Newark City
- NCES district ID
- 3904445
- Math proficiency
- 48% ▼ -12.00%
- Reading proficiency
- 56% ▼ -3.00%
- Median HH income
- $38,662
- Composite
- 43.33/100
- National rank
- #3034
- State rank
- #431 of 656 in OH
Livability — Newark
- Score
- 69/100
- State rank
- #493
- US rank
- #8263
Category grades
Schools grade is shown separately in the Schools card above.
Census & demographics
- Census place
- Newark, OH
- County
- Licking County · 109,194 people
- City population
- 63,281
- Metro
- Columbus, OH
- Population (ZIP)
- 63,281
- Household income
- $63,974
- Rent vs Own
- Severe rent burden
- 2269.0
Population outlook (Licking County) Hauer SSP2
- Today (2025)
- 178,210 people
- By 2030
- 180,917 · +1.5%
- By 2040
- 183,885 · +3.2%
- By 2050
- 182,985 · +2.7%
- By 2075
- 178,377 · +0.1%
- By 2100
- 161,075 · -9.6%
Race, ethnicity, and origin ACS 2023
- Neighborhood character
- Predominantly White (89%)
- Race & ethnicity
- White 89% Two or more races 5% Black 3% Hispanic / Latino 2%
- Common ancestry
- Slovak 2% Romanian 2% Lithuanian 2%
- Foreign-born
- 2% · Canada
- Languages at home
- 96% English-only · Spanish 2% Arabic 1%
Political lean MEDSL · Licking
- 2024 margin
- Solid R (+30.0) · D 34.5% · R 64.6%
- 2008→2024 swing
- -14.2pp toward R · 2008: -15.8pp · 2024: -30.0pp
- All cycles
- 2024: R+30.0 2020: R+28.1 2016: R+28.9 2012: R+14.7 2008: R+15.8
Not yet ingested
- Civics
- —
Market trends
- HPI YoY
- ▼ -253.54%
- Current HPI
- 247.9425
- Rent YoY
- ▲ 1.63%
- Metro
- Columbus, OH
- State GDP YoY
- ▲ 1.98%
- F500 in state
- 48
Industry mix (Fortune 500 HQ in OH)
| Industry | F500 HQs | Revenue |
|---|---|---|
| Insurance | 3 | $145B |
|
||
| Industrial Machinery | 3 | $49B |
|
||
| Financial Services | 3 | $24B |
|
||
| Consumer Goods | 2 | $93B |
|
||
| Aerospace / Defense | 2 | $47B |
|
||
| Utilities | 2 | $33B |
|
||
Price history
+93.9% since first listed6 events — show timeline
- 2026-05-10 Pending — CBRMLS
- 2026-04-30 Listed $160,000 CBRMLS
- 2005-08-08 Sold (Public Records) $80,000 Public Records
- 2005-08-04 Sold (MLS) $80,000 CBRMLS
- 2005-07-05 Listing Removed — CBRMLS
- 2004-10-06 Listed $82,500 CBRMLS
Property tax history
+5.4%/yrLatest (2025): $1,763 · +2.6% YoY. Source: county tax records.
Cash-flow waterfall
monthlySold comps — $/sqft
last 12 mo · ≤1 miLoading sold comps…