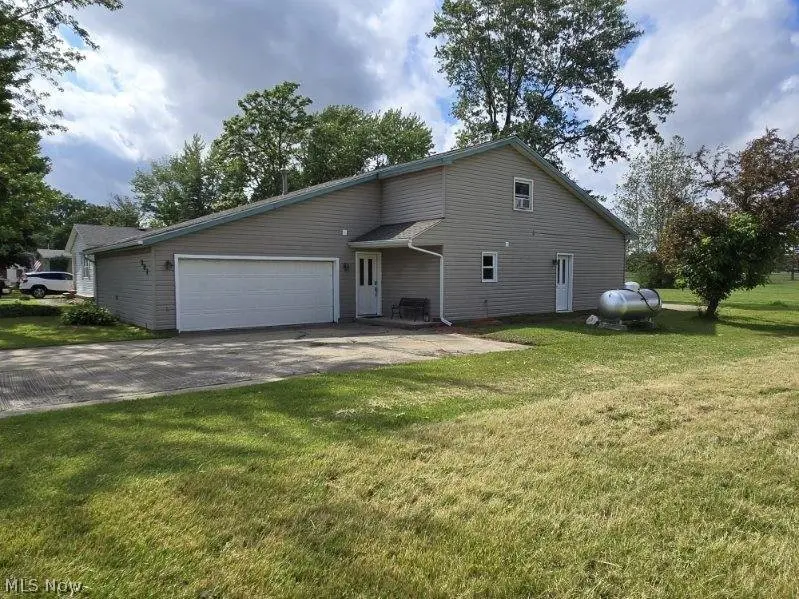
387 Stable Dr · Pheasant Run, OH
Flood risk 1/10 · Minimal
- FEMA flood zone
- X (unshaded)
- Chance of flooding over 30 yrs
- 0.0%
- Est. flood insurance / yr
- $473 – $860
Fire risk 1/10 · Minimal
- Est. fire insurance / yr
- $713 – $1,323
Heat risk 3/10 · Minor
- Hot days now (above 99°F)
- 7 days/yr
- Hot days in 30 yrs
- 16 days/yr
Wind risk 1/10 · Minimal
- Chance of severe wind over 30 yrs
- —
Air-quality risk 2/10 · Minimal
- Unhealthy air days now
- 1 days/yr
- Unhealthy air days in 30 yrs
- 2 days/yr
Risk factors via First Street. Map © Google.
Why this score? — see what drove the D+ grade
The composite is a weighted blend of 9 inputs, each scored 0–100. Each bar is that input's sub-score; the figure is the points it added to the 100-point composite (weight × sub-score).
- ARV discount +15.0/15.0
- Cash flow +11.6/30.0
- Schools +5.3/10.0
- 1% rule +3.6/10.0
- Livability +3.5/5.0
- DSCR +3.4/10.0
- Rent growth +2.5/5.0
- Condition / age +2.5/5.0
- Appreciation +0.0/10.0
$199,900
🖨 Deal sheet 📄 Offer letter ✓ Due diligence
Listing remarks MLS
Nice size story and a half home. Needs some repair. Large great room with cathedral ceiling. Sold as-is. Backs up to golf course.
Key facts
- Eating area
- Vaulted ceiling
- Laundry room
Tags
Property features AI
Finance
- HOA & community: Homeowners association (Pheasant Run) with monthly fee; HOA covers association management, common area maintenance, recreation facilities, reserve fund, and snow removal; Community amenities include common grounds, fishing, golf, lake, and playground
Exterior
- Parking: Attached 2-car garage; Driveway
- Utilities: Public water; Public sewer
- Home design: Single-family property; Faces south; Slab foundation
- Construction: Built per public records; Vinyl siding; Asphalt/fiberglass roof
- Exterior features: Patio; Rain gutters; Flat, level lot; On golf course; South-facing view
Interior
- Kitchen: Built-in oven; Cooktop; Dishwasher
- Bedrooms: One main-level bedroom
- Bathrooms: Two full bathrooms; One main-level bathroom
- Heating & cooling: Baseboard heating; Hot water heating; Propane heating; Steam heating; Wall unit cooling
- Interior features: Granite counters; High ceilings; Kitchen island; Vaulted ceilings; Double pane windows; Window treatments
- Laundry & utility: Washer; Dryer; Main-level laundry
Neighborhood map
What this means for you Summary
Snapshot
- This is a 3-bed/2.0-bath single-family listed at $200k.
Deal economics
- At list price, monthly cash flow is $-61 ($-727/yr) — negative.
- To cash-flow at today's rent, offer at most $189k (5.4% below list).
- To meet the 1% rule (rent ≥ 1% of price), the offer needs to be $172k (13.9% below list).
- Recommended offer: $172k (13.9% below list) — sets the bar for 1% rule.
Location & tenants
- Location reads 70/100 on livability (#475 in OH) — a middle-class / working-renter tenant base. Strengths: crime A+, cost of living A+, employment A; Watch: schools D, health & safety D, amenities F.
- Keystone Local (rural): math 55% / reading 67% proficiency, ranked #249 of 656 in OH (top 38%) — acceptable for families but not a draw, mixed tenant base, ~2y average lease.
- Market conditions: 29 active listings in the ZIP; solid renter incomes; 1,098 units permitted in Lorain County in 2024 (20 in 5+ unit buildings).
Forward outlook
- Local home prices are declining (-3.0%/yr); year-one equity from $1k of loan paydown is wiped out by about $6k of value loss. Plan a longer hold.
Negotiation context
- Only 9 days on market — expect competitive offers; lowballing is unlikely to land.
- 2 sale attempts since 13y ago with the ask held roughly flat each time — persistent listings suggest the price (not the market) is what's stuck; bring a comps-based counter.
- Current owner paid $60k; list at $200k implies a 234% gain — meaningful room to come down on a strong offer.
Questions for the listing agent
- What do current leases actually rent for vs. the listed asking? Can we see a recent rent roll and the last 12 months of T-12 income?
- What does the HOA fee cover, when was the last increase, and are there any pending special assessments or reserve-fund shortfalls?
- Is there a deadline driving the sale (1031 exchange, divorce, estate, relocation)? That informs how much negotiation room exists.
- Schools are D-rated, which usually means shorter tenancies and higher turnover. Who's the typical renter profile here, and what's been the actual vacancy rate?
- The area grade is low — what's the realistic commute time and amenity access for the typical tenant pool here? Any planned neighborhood developments (good or bad) we should know about?
- What's the average days-on-market for RENTAL listings here right now (not sales)? A rising rental-DOM trend means longer vacancies and softer asking-rent achievability than the comps imply.
- What's the recent tenant-quality profile in this submarket — average credit score on applications, eviction rate, late-payment / NSF rate, and stable-employment percentage? A property-management company in the area should have these aggregated.
- How much new for-sale + rental construction is in the pipeline within 1–3 miles? Heavy new supply typically softens prices + rents 12–24 months out; constrained supply supports both.
Investment metrics
- 1% rule
- 0.86% ✗
- Cap rate
- 5.93%
- Cash-on-cash
- -1.30%
- DSCR
- 0.94
- GRM
- 9.7
CMA / ARV
- ARV (on-the-fly)
- $272,732
- Comps found
- 12
Show comp detail 12 sales within ~0.75 mi
| Address | Dist | Beds/Ba | Sqft | Sold | Price | $/sf | Match |
|---|---|---|---|---|---|---|---|
| 243 Forest Park Dr | 0.25mi | 3/2.0 | 1,622 (-2%) | 10mo | $260,000 | $160 | 76 |
| 42381 Webster Rd | 0.25mi | 3/2.5 | 1,648 (-1%) | 18mo | $437,500 | $265 | 70 |
| 268 Stable Dr | 0.35mi | 4/2.0 (+1) | 1,701 (+2%) | 16mo | $168,000 | $99 | 61 |
| 42017 Meadow Ln | 0.38mi | 3/2.0 | 1,524 (-8%) | 12mo | $219,400 | $144 | 58 |
| 249 Forest Park Dr | 0.32mi | 3/2.0 | 1,455 (-12%) | 8mo | $210,000 | $144 | 57 |
| 276 Horseshoe Dr | 0.35mi | 3/2.0 | 1,892 (+14%) | 8mo | $325,000 | $172 | 54 |
| 19045 Whitehead Rd | 0.36mi | 3/1.5 | 1,421 (-15%) | 6mo | $340,000 | $239 | 52 |
| 280 Horseshoe Dr | 0.32mi | 3/2.0 | 1,432 (-14%) | 14mo | $235,000 | $164 | 50 |
| 284 Eastlake Dr | 0.38mi | 4/2.5 (+1) | 1,508 (-9%) | 16mo | $255,000 | $169 | 46 |
| 283 Eastlake Dr | 0.38mi | 3/2.0 | 1,465 (-12%) | 22mo | $297,900 | $203 | 44 |
| 130 Walleye Ct | 0.48mi | 3/2.0 | 1,494 (-10%) | 23mo | $180,000 | $120 | 41 |
| 38 Anglers Ln | 0.72mi | 3/2.0 | 1,440 (-13%) | 15mo | $161,000 | $112 | 32 |
Match score weights: distance 35% · size 25% · config 20% · recency 20%. Top-matched comps best support the ARV.
Projected returns pro-forma
-3.0% appreciation · 3.0% rent growth · sell at horizon
- IRR
- -18.4%
- Equity multiple
- 0.35×
- Total profit
- $-36,203
- Equity at exit
- $29,806
- IRR
- -10.7%
- Equity multiple
- 0.35×
- Total profit
- $-36,292
- Equity at exit
- $17,284
Cash invested: $55,972 (down + closing). Projections, not guarantees.
Landlord ↔ Tenant lean methodology
- Overall (STATE)
- 73 Landlord-Friendly
- State Ohio
- 73 Landlord-Friendly · R+6
- County
- — inherits STATE
- City
- — inherits STATE
ZIP-level market 44050
- Home prices YoY
- -22.7%
- Active inventory
- 29
- Price-to-rent
- 9.7×
Monthly cashflow live
- Estimated rent
- $1,721 medium interval (Pro) →
- Mortgage (P&I)
- −$1,048
- Tax from tax record
- −$209 /mo · $2,505/yr
- Insurance
- −$83
- HOA
- −$80
- Vacancy / Maint / Mgmt
- −$361
- Net cashflow
- $-61
Break-even live
UW: 25.0% down · 7.5% · 30yr · 1.5% tax · 5.0% vac · 8.0% maint · 8.0% mgmt
Financing live
Cash to close
- Down payment
- $49,975
- Closing costs
- $5,997
- Reserves months
- —
- Total cash needed
- —
Loan-product check · same deal, 3 products live
Conventional
25% down · 7.5% · 30yr
- Down + closing
- —
- Monthly P&I
- —
- Monthly cashflow
- —
- DSCR
- —
- Eligible?
- —
Personal DTI + credit; lowest rate.
DSCR
20% down · 8.5% · 30yr
- Down + closing
- —
- Monthly P&I
- —
- Monthly cashflow
- —
- DSCR
- —
- Eligible?
- —
No personal income docs; deal must DSCR.
Hard money
10% down · 12.0% · 12mo
- Down + closing
- —
- Monthly P&I
- —
- Monthly cashflow
- —
- DSCR
- —
- Eligible?
- —
Short-term bridge; refi at stabilization.
HOA detail
- Monthly dues
- $80 · $960/yr
Listing history 7 events
-
2026-06-17status $199,900 Pending 9 DOM
-
2026-06-17days on market $199,900 Active 9 DOM
-
2026-06-16days on market $199,900 Active 8 DOM
-
2026-06-15days on market $199,900 Active 7 DOM
-
2026-06-13days on market $199,900 Active 5 DOM
-
2026-06-08remarks 617-char remark
-
2026-06-08$199,900 Active 1 DOM
ⓘ Source: listings_history table (triggers on properties + properties_extension) + one-shot
backfill from property_details.listing_events for pre-trigger history.
Tax reassessment forecast OH · Partial reset (capped growth)
- Current annual tax
- $2,505 · $209/mo
- Projected year-2 tax
- $2,812 · $234/mo
- Expected delta
- +$307/yr (+$26/mo · 12.2%)
ⓘ Screening estimate from a state-policy table — verify with the county assessor before closing.
Climate risk First Street
- Flood 1/10 Low FEMA zone X (unshaded) · 0% chance over 30 yrs
- Wildfire 1/10 Low
- Heat 3/10 Moderate 7 d/yr ≥99°F today · 16 d/yr by 30 yrs out
- Wind 1/10 Low
- Air quality 2/10 Low 1 unhealthy d/yr today · 2 by 30 yrs out
Nearby sold comps map
Loading sold comps map…
Walkable amenities ~0.75 mi
Loading nearby amenities…
Taxation est. · year 1
- Rental income
- $20,654
- − Mortgage interest
- −$11,198
- − Property taxes
- −$2,505
- − Insurance
- −$1,000
- − Repairs & maintenance
- −$1,652
- − Management
- −$1,652
- − HOA
- −$960
- − Depreciation
- −$5,815
- Taxable loss
- −$4,128
- Est. tax savings @ 24.0%
- +$991
- After-tax cash flow
- $263/yr
For passive investors: Depreciation is non-cash, so a rental often shows a tax loss while cash-flowing — sheltering income. Rental losses are passive: they offset passive income freely, and up to $25,000/yr can offset ordinary (W-2) income if you actively participate and your MAGI is under $100k (phasing out to $0 by $150k); unused losses carry forward. On sale, claimed depreciation is recaptured at up to 25%, and gains may owe capital-gains tax (a 1031 exchange can defer both). Figures are a year-1 estimate at your 24.0% rate — not tax advice; consult a CPA.
Schools (NCES district)
- District
- Keystone Local
- NCES district ID
- 3904816
- Math proficiency
- 55% ▼ -16.00%
- Reading proficiency
- 67% ▼ -11.00%
- Median HH income
- $64,696
- Composite
- 53.27/100
- National rank
- #1493
- State rank
- #249 of 656 in OH
Livability — Pheasant Run
- Score
- 70/100
- State rank
- #475
- US rank
- #7911
Category grades
Schools grade is shown separately in the Schools card above.
Census & demographics
- Census place
- Pheasant Run, OH
- County
- Lorain · 305,041 people
- Metro
- Cleveland, OH
- Population (ZIP)
- 7,204
- Household income
- $100,625
- Rent vs Own
- Severe rent burden
- 7.2
Population outlook (Lorain County) Hauer SSP2
- Today (2025)
- 314,924 people
- By 2030
- 317,546 · +0.8%
- By 2040
- 317,962 · +1.0%
- By 2050
- 312,872 · -0.7%
- By 2075
- 301,806 · -4.2%
- By 2100
- 278,271 · -11.6%
Race, ethnicity, and origin ACS 2023
- Neighborhood character
- Predominantly White (89%)
- Race & ethnicity
- White 89% Two or more races 8% Hispanic / Latino 7%
- Hispanic origin (detail)
- Mexican 3% Puerto Rican 3%
- Common ancestry
- Romanian 8% Slovak 3% Italian 2%
- Foreign-born
- 0%
Political lean MEDSL · Lorain
- 2024 margin
- Lean R (+5.7) · D 46.7% · R 52.4%
- 2008→2024 swing
- -23.6pp toward R · 2008: 17.9pp · 2024: -5.7pp
- All cycles
- 2024: R+5.7 2020: R+2.5 2016: R+0.3 2012: D+14.4 2008: D+17.9
Not yet ingested
- Civics
- —
Market trends
- HPI YoY
- ▼ -58.79%
- Current HPI
- 200.695
- Rent YoY
- —
- Metro
- —
- State GDP YoY
- ▲ 1.98%
- F500 in state
- 48
Industry mix (Fortune 500 HQ in OH)
| Industry | F500 HQs | Revenue |
|---|---|---|
| Insurance | 3 | $145B |
|
||
| Industrial Machinery | 3 | $49B |
|
||
| Financial Services | 3 | $24B |
|
||
| Consumer Goods | 2 | $93B |
|
||
| Aerospace / Defense | 2 | $47B |
|
||
| Utilities | 2 | $33B |
|
||
Price history
+222.9% since first listed3 events — show timeline
- 2026-06-07 Listed $199,900 MLSNOW
- 2013-03-25 Sold (MLS) $59,900 MLSNOW
- 2013-01-18 Listed $61,900 MLSNOW
Property tax history
+6.9%/yrLatest (2025): $2,505 · -0.2% YoY. Source: county tax records.
Cash-flow waterfall
monthlySold comps — $/sqft
last 12 mo · ≤1 miLoading sold comps…