14679 Ridgeway Rd · Crosslake, MN
Flood risk 1/10 · Minimal
- FEMA flood zone
- X (unshaded)
- Chance of flooding over 30 yrs
- 0.0%
- Est. flood insurance / yr
- $507 – $1,088
Fire risk 3/10 · Minor
- Est. fire insurance / yr
- $888 – $1,650
Heat risk 1/10 · Minimal
- Hot days now (above 96°F)
- 7 days/yr
- Hot days in 30 yrs
- 13 days/yr
Wind risk 1/10 · Minimal
- Chance of severe wind over 30 yrs
- —
Air-quality risk 2/10 · Minimal
- Unhealthy air days now
- 2 days/yr
- Unhealthy air days in 30 yrs
- 2 days/yr
Risk factors via First Street. Map © Google.
Why this score? — see what drove the B- grade
The composite is a weighted blend of 9 inputs, each scored 0–100. Each bar is that input's sub-score; the figure is the points it added to the 100-point composite (weight × sub-score).
- Cash flow +30.0/30.0
- 1% rule +10.0/10.0
- DSCR +10.0/10.0
- ARV discount +7.5/15.0
- Schools +4.2/10.0
- Livability +3.2/5.0
- Rent growth +2.5/5.0
- Condition / age +2.5/5.0
- Appreciation +0.0/10.0
$115,000
🖨 Deal sheet 📄 Offer letter ✓ Due diligence
Listing remarks
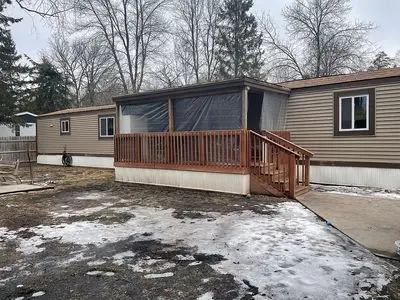
2 bedroom 1 batch mobile home in Chatham Park in Crosslake. Lot rent is 495 per month with 495 deposit. Pets allowed. All new siding, skirting, windows and doors. New roof 6 years ago. 8x8 front deck and 10x12 back deck with roof. 10x10 shed, 2 car garage, with heat and added 10 x20 workshop/storage added on back. All new sinks and faucets. 14x14 fire pit in back yard completely fenced in. Natural gas heat, home and garage. Near Crosslake community center and public boat ramps. Must be approved by the park management. Home is 14x70 with good size yard as the homes run parallel to the street. Text 612-615-3125 to set up showing or questions.
Key facts
- Front deck
- New siding
- Shed
Tags
Neighborhood map
What this means for you Summary
Snapshot
- This is a 2-bed/1.0-bath single-family listed at $115k.
Deal economics
- At list price, monthly cash flow is $982 ($12k/yr) — positive.
- The deal already cash-flows at list — no discount required.
- Meets the 1% rule at list price ($2k rent vs $115k).
- Cap rate 16.5% vs local median 1.4% in Crosslake — top-decile yield for the area; either an underpriced asset or a hidden risk that comps aren't pricing in. Stress-test before assuming the spread holds.
Location & tenants
- Location reads 63/100 on livability (#628 in MN) — a middle-class / working-renter tenant base. Strengths: crime A+, employment A, housing B; Watch: health & safety C-, amenities F, commute F.
- Pequot Lakes Public Schools (rural): math 40% / reading 57% proficiency, ranked #137 of 301 in MN (top 46%) — families likely to look elsewhere, expect single-tenant / working-renter base with shorter leases.
- Market conditions: 114 active listings in the ZIP; 420 units permitted in Crow Wing County in 2024 (17 in 5+ unit buildings).
Forward outlook
- Local home prices are declining (-3.0%/yr); year-one equity from $795 of loan paydown is wiped out by about $3k of value loss. Plan a longer hold.
- Crow Wing County population projected to shrink 8% by 2050 — rents likely to lag national; underwrite the cash flow, not the appreciation.
- At projected returns (-3.0% appreciation + 3.0% rent growth), your $32k cash investment doubles in ~4 years — after that, you're playing with house money.
Negotiation context
- Only 14 days on market — expect competitive offers; lowballing is unlikely to land.
Questions for the listing agent
- Is there a deadline driving the sale (1031 exchange, divorce, estate, relocation)? That informs how much negotiation room exists.
- What's the average days-on-market for RENTAL listings here right now (not sales)? A rising rental-DOM trend means longer vacancies and softer asking-rent achievability than the comps imply.
- What's the recent tenant-quality profile in this submarket — average credit score on applications, eviction rate, late-payment / NSF rate, and stable-employment percentage? A property-management company in the area should have these aggregated.
- How much new for-sale + rental construction is in the pipeline within 1–3 miles? Heavy new supply typically softens prices + rents 12–24 months out; constrained supply supports both.
Investment metrics
- 1% rule
- 1.96% ✓
- Cap rate
- 16.54%
- Cash-on-cash
- 36.61%
- DSCR
- 2.63
- GRM
- 4.3
CMA / ARV
No comps found within radius.
Projected returns pro-forma
-3.0% appreciation · 3.0% rent growth · sell at horizon
- IRR
- 32.4%
- Equity multiple
- 2.37×
- Total profit
- $43,968
- Equity at exit
- $17,147
- IRR
- 39.5%
- Equity multiple
- 4.70×
- Total profit
- $118,993
- Equity at exit
- $9,943
Cash invested: $32,200 (down + closing). Projections, not guarantees.
Landlord ↔ Tenant lean methodology
- Overall (STATE)
- 46 Balanced
- State Minnesota
- 46 Balanced · D+2
- County
- — inherits STATE
- City
- — inherits STATE
ZIP-level market 56442
- Home prices YoY
- -19.4%
- Active inventory
- 114
- Price-to-rent
- 4.3×
Monthly cashflow live
- Estimated rent
- $2,250 medium interval (Pro) →
- Mortgage (P&I)
- −$603
- Tax est. 1.5%
- −$144 /mo · $1,725/yr
- Insurance
- −$48
- HOA
- −$0
- Vacancy / Maint / Mgmt
- −$472
- Net cashflow
- $982
Break-even live
UW: 25.0% down · 7.5% · 30yr · 1.5% tax · 5.0% vac · 8.0% maint · 8.0% mgmt
Financing live
Cash to close
- Down payment
- $28,750
- Closing costs
- $3,450
- Reserves months
- —
- Total cash needed
- —
Loan-product check · same deal, 3 products live
Conventional
25% down · 7.5% · 30yr
- Down + closing
- —
- Monthly P&I
- —
- Monthly cashflow
- —
- DSCR
- —
- Eligible?
- —
Personal DTI + credit; lowest rate.
DSCR
20% down · 8.5% · 30yr
- Down + closing
- —
- Monthly P&I
- —
- Monthly cashflow
- —
- DSCR
- —
- Eligible?
- —
No personal income docs; deal must DSCR.
Hard money
10% down · 12.0% · 12mo
- Down + closing
- —
- Monthly P&I
- —
- Monthly cashflow
- —
- DSCR
- —
- Eligible?
- —
Short-term bridge; refi at stabilization.
Listing history 11 events
-
2026-06-18days on market $115,000 Active 14 DOM
-
2026-06-17days on market $115,000 Active 13 DOM
-
2026-06-16days on market $115,000 Active 12 DOM
-
2026-06-15days on market $115,000 Active 11 DOM
-
2026-06-13days on market $115,000 Active 9 DOM
-
2026-06-12days on market $115,000 Active 8 DOM
-
2026-06-09days on market $115,000 Active 5 DOM
-
2026-06-08days on market $115,000 Active 4 DOM
-
2026-06-07days on market $115,000 Active 3 DOM
-
2026-06-07remarks 648-char remark
-
2026-06-07$115,000 Active 2 DOM
ⓘ Source: listings_history table (triggers on properties + properties_extension) + one-shot
backfill from property_details.listing_events for pre-trigger history.
Climate risk First Street
- Flood 1/10 Low FEMA zone X (unshaded) · 0% chance over 30 yrs
- Wildfire 3/10 Moderate
- Heat 1/10 Low 7 d/yr ≥96°F today · 13 d/yr by 30 yrs out
- Wind 1/10 Low
- Air quality 2/10 Low 2 unhealthy d/yr today · 2 by 30 yrs out
Nearby sold comps map
Loading sold comps map…
Walkable amenities ~0.75 mi
Loading nearby amenities…
Taxation est. · year 1
- Rental income
- $26,994
- − Mortgage interest
- −$6,442
- − Property taxes
- −$1,725
- − Insurance
- −$575
- − Repairs & maintenance
- −$2,160
- − Management
- −$2,160
- − Depreciation
- −$3,345
- Taxable income
- $10,588
- Est. tax owed @ 24.0%
- −$2,541
- After-tax cash flow
- $9,248/yr
For passive investors: Depreciation is non-cash, so a rental often shows a tax loss while cash-flowing — sheltering income. Rental losses are passive: they offset passive income freely, and up to $25,000/yr can offset ordinary (W-2) income if you actively participate and your MAGI is under $100k (phasing out to $0 by $150k); unused losses carry forward. On sale, claimed depreciation is recaptured at up to 25%, and gains may owe capital-gains tax (a 1031 exchange can defer both). Figures are a year-1 estimate at your 24.0% rate — not tax advice; consult a CPA.
Schools (NCES district)
- District
- Pequot Lakes Public Schools
- NCES district ID
- 2728200
- Math proficiency
- 40% ▼ -24.00%
- Reading proficiency
- 57% ▼ -13.00%
- Median HH income
- $51,513
- Composite
- 41.62/100
- National rank
- #3430
- State rank
- #137 of 301 in MN
Livability — Crosslake
- Score
- 63/100
- State rank
- #628
- US rank
- #15018
Category grades
Schools grade is shown separately in the Schools card above.
Census & demographics
- Census place
- Crosslake, MN
- City population
- 2,895
- Population (ZIP)
- 2,895
Population outlook (Crow Wing County) Hauer SSP2
- Today (2025)
- 64,187 people
- By 2030
- 64,057 · -0.2%
- By 2040
- 62,470 · -2.7%
- By 2050
- 59,064 · -8.0%
- By 2075
- 48,738 · -24.1%
- By 2100
- 36,112 · -43.7%
Race, ethnicity, and origin ACS 2023
- Neighborhood character
- Predominantly White (97%)
- Race & ethnicity
- White 97% Two or more races 3%
- Common ancestry
- Portuguese 18% Lithuanian 6% Romanian 4%
- Foreign-born
- 3% · Canada
- Languages at home
- 97% English-only · German/W. Germanic 1% Other Indo-European 1% Spanish 1%
Political lean MEDSL · Crow Wing
- 2024 margin
- Solid R (+31.4) · D 33.6% · R 65.0% · Other 1.5%
- 2008→2024 swing
- -23.7pp toward R · 2008: -7.7pp · 2024: -31.4pp
- All cycles
- 2024: R+31.4 2020: R+29.7 2016: R+31.8 2012: R+13.4 2008: R+7.7
Not yet ingested
- Civics
- —
Market trends
- HPI YoY
- ▼ -52.60%
- Current HPI
- 218.1511
- Rent YoY
- —
- Metro
- —
- State GDP YoY
- ▲ 2.41%
- F500 in state
- 34
Industry mix (Fortune 500 HQ in MN)
| Industry | F500 HQs | Revenue |
|---|---|---|
| Healthcare | 2 | $407B |
|
||
| Retail | 2 | $150B |
|
||
| Consumer Goods | 2 | $32B |
|
||
| Industrial Machinery | 2 | $6B |
|
||
| Agriculture | 1 | $40B |
|
||
| Healthcare / Medical Devices | 1 | $32B |
|
||
Price history
1 event — show timeline
- 2026-06-05 Listed $115,000 FSBO.com
Property tax history
-1.1%/yrLatest (2022): $86 · -8.5% YoY. Source: county tax records.
Cash-flow waterfall
monthlySold comps — $/sqft
last 12 mo · ≤1 miLoading sold comps…