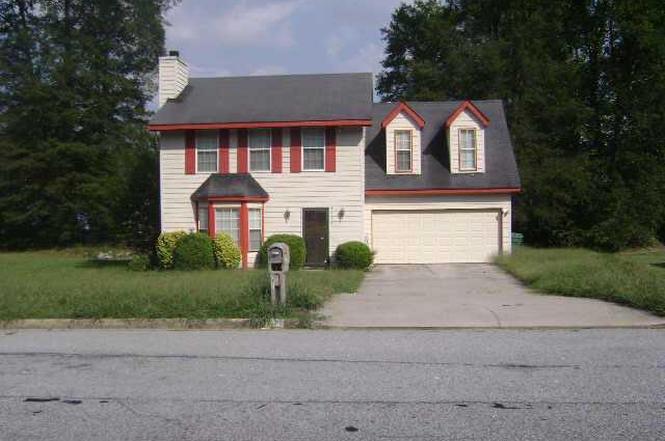
3570 Keels Ln · South Fulton, GA
Flood risk 1/10 · Minimal
- FEMA flood zone
- X (unshaded)
- Chance of flooding over 30 yrs
- 0.0%
- Est. flood insurance / yr
- $507 – $1,088
Fire risk 3/10 · Minor
- Est. fire insurance / yr
- $963 – $1,789
Heat risk 6/10 · Moderate
- Hot days now (above 105°F)
- 7 days/yr
- Hot days in 30 yrs
- 18 days/yr
Wind risk 6/10 · Moderate
- Chance of severe wind over 30 yrs
- 27.0%
Air-quality risk 4/10 · Minor
- Unhealthy air days now
- 4 days/yr
- Unhealthy air days in 30 yrs
- 6 days/yr
Risk factors via First Street. Map © Google.
Why this score? — see what drove the A- grade
The composite is a weighted blend of 9 inputs, each scored 0–100. Each bar is that input's sub-score; the figure is the points it added to the 100-point composite (weight × sub-score).
- Cash flow +27.9/30.0
- ARV discount +15.0/15.0
- Appreciation +10.0/10.0
- DSCR +9.9/10.0
- 1% rule +6.7/10.0
- Schools +4.5/10.0
- Rent growth +2.7/5.0
- Livability +2.5/5.0
- Condition / age +2.5/5.0
$169,000
🖨 Deal sheet 📄 Offer letter ✓ Due diligence
Key facts
- 8,576 sq ft lot
- 4 parking spots
- Built 1990
Property features AI
Finance
- Other: Directions: Please use GPS; County: Fulton, GA
- HOA & community: Association fees charged annually
Exterior
- Parking: Driveway parking; Open parking for four vehicles
- Utilities: Public water; Public sewer; Electricity available; Natural gas available
- Home design: Two levels
- Construction: Wood siding construction; Shingle roof; Property listed as resale
- Exterior features: Outbuilding; Asphalt road frontage on a city street
Interior
- Kitchen: Kitchen island; Stained cabinets; Laminate countertops; Dishwasher; Electric oven
- Bedrooms: Three bedrooms on the upper level; Oversized master bedroom
- Flooring: Carpet
- Bathrooms: Two full bathrooms (upper level); One half bathroom (main level); Master bathroom with separate tub and shower
- Heating & cooling: Forced air heating; Central air conditioning; Ceiling fans
- Interior features: Entrance foyer; Storm windows; One fireplace located in the family room; Attic space
- Laundry & utility: Laundry located in the kitchen
Neighborhood map
What this means for you Summary
Snapshot
- This is a 4-bed/2.5-bath single-family listed at $169k.
Deal economics
- At list price, monthly cash flow is $520 ($6k/yr) — positive.
- The deal already cash-flows at list — no discount required.
- Meets the 1% rule at list price ($2k rent vs $169k).
- Cap rate 10.0% vs local median 4.6% in South Fulton — top-decile yield for the area; either an underpriced asset or a hidden risk that comps aren't pricing in. Stress-test before assuming the spread holds.
Location & tenants
- Location reads: area grade A — affects rentability + tenant quality, not the cash-flow math above.
- Fulton County (suburban): math 49% / reading 53% proficiency, ranked #12 of 174 in GA (top 7%) — acceptable for families but not a draw, mixed tenant base, ~2y average lease.
- Market conditions: Rents flat; 651 active listings in the ZIP; 38 comparable units currently listed for rent nearby; rentals at typical pace (median 22d on market — plan ~3-4 weeks tenant-placement turnaround); 11,565 units permitted in Fulton County in 2024 (8,159 in 5+ unit buildings).
- This rent runs 35% of the median local income ($67k/yr) — at the standard rent-burdened threshold; future hikes will face affordability resistance.
Forward outlook
- In year one you build about $18k of equity ($1k loan paydown + $17k appreciation (10.0% local appreciation)).
- Fulton County population projected at +38% by 2050 — long-run rental-demand tailwind backs the buy-and-hold thesis.
- At projected returns (10.0% appreciation + 0.9% rent growth), your $47k cash investment doubles in ~2 years — after that, you're playing with house money.
- By year 3, paydown + projected appreciation supports a ~$46k cash-out refi (75% LTV) — recoverable capital for the next deal without selling this one.
Negotiation context
- Only 2 days on market — expect competitive offers; lowballing is unlikely to land.
- 9 sale attempts since 19y ago with the ask held roughly flat each time — persistent listings suggest the price (not the market) is what's stuck; bring a comps-based counter.
- Current owner paid $74k; list at $169k implies a 128% gain — meaningful room to come down on a strong offer.
Risks & watch-outs
- Climate carrying-cost: major wind risk, 27% chance of damaging wind over 30y; extreme-heat days projected 7→18/yr by 2055 (HVAC capex compounding) — expect insurance premiums to compound above CPI over the hold.
Questions for the listing agent
- Is there a deadline driving the sale (1031 exchange, divorce, estate, relocation)? That informs how much negotiation room exists.
- What's the average days-on-market for RENTAL listings here right now (not sales)? A rising rental-DOM trend means longer vacancies and softer asking-rent achievability than the comps imply.
- What's the recent tenant-quality profile in this submarket — average credit score on applications, eviction rate, late-payment / NSF rate, and stable-employment percentage? A property-management company in the area should have these aggregated.
- How much new for-sale + rental construction is in the pipeline within 1–3 miles? Heavy new supply typically softens prices + rents 12–24 months out; constrained supply supports both.
Investment metrics
- 1% rule
- 1.17% ✓
- Cap rate
- 9.98%
- Cash-on-cash
- 13.18%
- DSCR
- 1.59
- GRM
- 7.2
CMA / ARV
- ARV (on-the-fly)
- $243,168
- Comps found
- 12
Show comp detail 12 sales within ~0.75 mi
| Address | Dist | Beds/Ba | Sqft | Sold | Price | $/sf | Match |
|---|---|---|---|---|---|---|---|
| 6535 Buckhurst Trl | 0.20mi | 4/2.0 | 1,550 (-5%) | 11mo | $179,000 | $115 | 71 |
| 6660 Hidden Brook Trl | 0.40mi | 4/2.0 | 1,624 (-0%) | 9mo | $289,000 | $178 | 71 |
| 3325 Estate Lake Dr | 0.45mi | 3/2.0 (-1) | 1,646 (+1%) | 3mo | $246,000 | $149 | 68 |
| 6808 Merrywood Dr | 0.32mi | 3/2.5 (-1) | 1,510 (-8%) | 8mo | $173,500 | $115 | 61 |
| 3130 Cadiz Cir | 0.29mi | 5/3.0 (+1) | 1,472 (-10%) | 4mo | $265,000 | $180 | 60 |
| 6565 Buckhurst Trl | 0.20mi | 4/3.0 | 1,850 (+13%) | 8mo | $240,000 | $130 | 59 |
| 6600 Connell Rd | 0.21mi | 4/2.0 | 1,866 (+14%) | 7mo | $200,000 | $107 | 59 |
| 6590 Smoke Ridge Dr | 0.17mi | 5/2.5 (+1) | 1,852 (+14%) | 10mo | $284,000 | $153 | 56 |
| 6675 Hidden Brook Trl | 0.43mi | 4/3.0 | 1,800 (+10%) | 8mo | $284,998 | $158 | 54 |
| 7085 Hania Dr | 0.70mi | 3/2.0 (-1) | 1,722 (+6%) | 0mo | $233,500 | $136 | 51 |
| 3420 Leisure Ln | 0.32mi | 3/2.0 (-1) | 1,388 (-15%) | 11mo | $225,000 | $162 | 44 |
| 6945 Merrywood Dr | 0.51mi | 3/3.0 (-1) | 1,852 (+14%) | 9mo | $234,700 | $127 | 39 |
Match score weights: distance 35% · size 25% · config 20% · recency 20%. Top-matched comps best support the ARV.
Projected returns pro-forma
10.0% appreciation · 0.95% rent growth · sell at horizon
- IRR
- 33.1%
- Equity multiple
- 3.56×
- Total profit
- $121,106
- Equity at exit
- $152,249
- IRR
- 27.9%
- Equity multiple
- 7.83×
- Total profit
- $323,087
- Equity at exit
- $328,330
Cash invested: $47,320 (down + closing). Projections, not guarantees.
Landlord ↔ Tenant lean methodology
- Overall (STATE)
- 90 Strongly Landlord-Friendly
- State Georgia
- 90 Strongly Landlord-Friendly · R+3
- County
- — inherits STATE
- City
- — inherits STATE
ZIP-level market 30349
- Home prices YoY
- 4.6%
- Rents YoY
- 0.9%
- Active inventory
- 651
- Price-to-rent
- 7.2×
Monthly cashflow live
- Estimated rent
- $1,969 high interval (Pro) →
- Mortgage (P&I)
- −$886
- Tax from tax record
- −$80 /mo · $955/yr
- Insurance
- −$70
- HOA
- −$0
- Vacancy / Maint / Mgmt
- −$414
- Net cashflow
- $520
Break-even live
UW: 25.0% down · 7.5% · 30yr · 1.5% tax · 5.0% vac · 8.0% maint · 8.0% mgmt
Financing live
Cash to close
- Down payment
- $42,250
- Closing costs
- $5,070
- Reserves months
- —
- Total cash needed
- —
Loan-product check · same deal, 3 products live
Conventional
25% down · 7.5% · 30yr
- Down + closing
- —
- Monthly P&I
- —
- Monthly cashflow
- —
- DSCR
- —
- Eligible?
- —
Personal DTI + credit; lowest rate.
DSCR
20% down · 8.5% · 30yr
- Down + closing
- —
- Monthly P&I
- —
- Monthly cashflow
- —
- DSCR
- —
- Eligible?
- —
No personal income docs; deal must DSCR.
Hard money
10% down · 12.0% · 12mo
- Down + closing
- —
- Monthly P&I
- —
- Monthly cashflow
- —
- DSCR
- —
- Eligible?
- —
Short-term bridge; refi at stabilization.
Rent comps 38 comps
| Address | Beds | Baths | Sqft | Rent | $/sqft | DOM | Units | Dist |
|---|---|---|---|---|---|---|---|---|
| 6500 Connell Rd Atlanta, GA | 3.0 | 2.0 | 1483 | $1,650 | $1.11 | 24d | 1 | 0.10mi |
| 3500 Keels Ln Atlanta, GA | 3.0 | 2.0 | 1272 | $1,755 | $1.38 | 1d | 1 | 0.10mi |
| 6440 Connell Rd Atlanta, GA | 3.0 | 2.0 | 1391 | $1,695 | $1.22 | 24d | 1 | 0.12mi |
| 6445 Connell Rd Atlanta, GA | 3.0 | 2.0 | 1357 | $1,856 | $1.37 | 43d | 1 | 0.14mi |
| 6575 Smoke Ridge Dr Atlanta, GA | 4.0 | 2.0 | 1808 | $1,815 | $1.00 | 43d | 1 | 0.16mi |
| 325 Pointer Ct Atlanta, GA | 3.0 | 2.0 | 1474 | $1,620 | $1.10 | 5d | 1 | 0.19mi |
| 3760 Cedar Hurst Way Atlanta, GA | 4.0 | 2.5 | 1595 | $2,150 | $1.35 | 10d | 1 | 0.33mi |
| 3800 Leisure Ln Atlanta, GA | 3.0 | 2.0 | 1198 | $2,350 | $1.96 | 22d | 1 | 0.35mi |
| 2560 Foxlair Trl Atlanta, GA | 4.0 | 2.0 | 1485 | $1,795 | $1.21 | 24d | 1 | 0.41mi |
| 3325 Valley Bend Rd Atlanta, GA | 4.0 | 2.0 | 2000 | $1,995 | $1.00 | 5d | 1 | 0.51mi |
| 3325 Valley Bend Rd Atlanta, GA | 4.0 | 2.0 | 2000 | $1,995 | $1.00 | 16d | 1 | 0.51mi |
| 6415 El Caudillo Ct Atlanta, GA | 3.0 | 3.0 | 1498 | $2,800 | $1.87 | 4d | 1 | 0.60mi |
| 7045 Birling Dr Atlanta, GA | 4.0 | 3.0 | 1488 | $1,765 | $1.19 | 43d | 1 | 0.73mi |
| 3240 Devilla Trce South Fulton, GA | 4.0 | 2.0 | 1616 | $1,980 | $1.23 | 43d | 1 | 0.79mi |
| 420 Buffington Dr Union City, GA | 3.0 | 2.0 | 2118 | $2,050 | $0.97 | 20d | 1 | 0.81mi |
| 7060 Kimberly Mill Rd Atlanta, GA | 3.0 | 1.0 | 1056 | $1,425 | $1.35 | 5d | 1 | 0.83mi |
| 835 Buffington Ct Union City, GA | 4.0 | 2.5 | 1723 | $2,165 | $1.26 | 43d | 1 | 0.88mi |
| 6770 Buffington Rd Union City, GA | 1.0–3.0 | 1.0–2.0 | 950 | $1,699 | $1.79 | 1d | 24 | 0.89mi |
| 6450 Peppermill Ln Atlanta, GA | 4.0 | 2.0 | 1188 | $1,531 | $1.29 | 24d | 1 | 0.92mi |
| 2820 Greenbower Ct Atlanta, GA | 3.0 | 2.0 | 1338 | $1,730 | $1.29 | 3d | 1 | 0.93mi |
| 6345 Peppermill Ln Atlanta, GA | 3.0 | 2.5 | 1224 | $1,800 | $1.47 | 43d | 1 | 0.94mi |
| 3206 Pine Tree Trl Unit 15C Atlanta, GA | 3.0 | 2.5 | 1466 | $1,950 | $1.33 | 4d | 1 | 1.05mi |
| 3105 Garnet Way Atlanta, GA | 3.0 | 2.0 | 1470 | $1,660 | $1.13 | 12d | 1 | 1.13mi |
| 4050 Morgan Rd Union City, GA | 1.0–3.0 | 1.0–2.0 | 988 | $1,750 | $1.77 | 5d | 21 | 1.15mi |
| 7156 Tanger Blvd Riverdale, GA | 4.0 | 2.5 | 1984 | $2,229 | $1.12 | 2d | 1 | 1.17mi |
| 6870 Old Bethsaida Way Riverdale, GA | 4.0 | 2.5 | 1916 | $1,973 | $1.03 | 43d | 1 | 1.18mi |
| 3457 Sumersbe Ct Atlanta, GA | 3.0 | 2.5 | 1800 | $2,300 | $1.28 | 5d | 1 | 1.27mi |
| 2722 South Hills Riverdale, GA | 3.0 | 2.5 | 1722 | $2,200 | $1.28 | 5d | 1 | 1.32mi |
| 336 Rocky Springs Ct Atlanta, GA | 4.0 | 2.0 | 1900 | $1,450 | $0.76 | 24d | 1 | 1.33mi |
| 2550 Hallie Mill Rd Atlanta, GA | 3.0 | 2.0 | 1372 | $1,600 | $1.17 | 12d | 1 | 1.34mi |
| 6230 Cedar Wood Dr Atlanta, GA | 3.0 | 2.0 | 1238 | $1,694 | $1.37 | 43d | 1 | 1.36mi |
| 6560 Emerald Pointe Cir Atlanta, GA | 3.0 | 2.0 | 1309 | $1,500 | $1.15 | 22d | 1 | 1.38mi |
| 855 Old Rocky Rd Atlanta, GA | 3.0 | 2.0 | 1310 | $1,710 | $1.31 | 24d | 1 | 1.38mi |
| 110 Fruitwood Trce Unit A Riverdale, GA | 3.0 | 2.0 | 1100 | $1,800 | $1.64 | 20d | 1 | 1.41mi |
| 2667 Rocky Ct Atlanta, GA | 3.0 | 2.5 | 1432 | $2,200 | $1.54 | 43d | 1 | 1.43mi |
| 2590 South Hills Riverdale, GA | 3.0 | 2.5 | 1850 | $2,005 | $1.08 | 12d | 1 | 1.44mi |
| 2529 Wood Bend Ln Riverdale, GA | 3.0 | 2.5 | 1508 | $1,945 | $1.29 | 43d | 1 | 1.48mi |
| 2865 Spruce Point Rd Atlanta, GA | 4.0 | 2.0 | 1050 | $1,910 | $1.82 | 43d | 1 | 1.49mi |
Listing history 2 events
-
2026-06-18days on market $169,000 Active 2 DOM
-
2026-06-16$169,000 Active 1 DOM
ⓘ Source: listings_history table (triggers on properties + properties_extension) + one-shot
backfill from property_details.listing_events for pre-trigger history.
Tax reassessment forecast GA · Resets to sale price
- Current annual tax
- $955 · $80/mo
- Projected year-2 tax
- $1,555 · $130/mo
- Expected delta
- +$600/yr (+$50/mo · 62.8%)
ⓘ Screening estimate from a state-policy table — verify with the county assessor before closing.
Climate risk First Street
- Flood 1/10 Low FEMA zone X (unshaded) · 0% chance over 30 yrs
- Wildfire 3/10 Moderate
- Heat 6/10 Major 7 d/yr ≥105°F today · 18 d/yr by 30 yrs out
- Wind 6/10 Major 27% chance of damaging wind over 30 yrs
- Air quality 4/10 Moderate 4 unhealthy d/yr today · 6 by 30 yrs out
Nearby sold comps map
Loading sold comps map…
Walkable amenities ~0.75 mi
Loading nearby amenities…
Taxation est. · year 1
- Rental income
- $23,634
- − Mortgage interest
- −$9,467
- − Property taxes
- −$955
- − Insurance
- −$845
- − Repairs & maintenance
- −$1,891
- − Management
- −$1,891
- − Depreciation
- −$4,916
- Taxable income
- $3,669
- Est. tax owed @ 24.0%
- −$881
- After-tax cash flow
- $5,355/yr
For passive investors: Depreciation is non-cash, so a rental often shows a tax loss while cash-flowing — sheltering income. Rental losses are passive: they offset passive income freely, and up to $25,000/yr can offset ordinary (W-2) income if you actively participate and your MAGI is under $100k (phasing out to $0 by $150k); unused losses carry forward. On sale, claimed depreciation is recaptured at up to 25%, and gains may owe capital-gains tax (a 1031 exchange can defer both). Figures are a year-1 estimate at your 24.0% rate — not tax advice; consult a CPA.
Schools (NCES district)
- District
- Fulton County
- NCES district ID
- 1302280
- Math proficiency
- 49% ▼ -2.00%
- Reading proficiency
- 53% ▬ 0.00%
- Median HH income
- $68,035
- Composite
- 45.33/100
- National rank
- #2640
- State rank
- #12 of 174 in GA
Livability — South Fulton
No livability data for this city. (Only ~50 U.S. cities are tracked.)
Census & demographics
- Census place
- South Fulton, GA
- County
- Fulton County · 1,094,430 people
- City population
- 127,674
- Metro
- Atlanta-Sandy Springs-Alpharetta, GA
- Population (ZIP)
- 79,872
- Household income
- $67,023
- Rent vs Own
- Severe rent burden
- 4258.0
Population outlook (Fulton County) Hauer SSP2
- Today (2025)
- 1,203,707 people
- By 2030
- 1,299,706 · +8.0%
- By 2040
- 1,488,256 · +23.6%
- By 2050
- 1,664,580 · +38.3%
- By 2075
- 2,036,072 · +69.2%
- By 2100
- 2,222,402 · +84.6%
Race, ethnicity, and origin ACS 2023
- Neighborhood character
- Predominantly Black (89%)
- Race & ethnicity
- Black 89% Hispanic / Latino 5% Two or more races 4% White 3%
- Foreign-born
- 9% · Canada
- Languages at home
- 88% English-only · Spanish 6% French/Haitian/Cajun 1%
Political lean MEDSL · Fulton
- 2024 margin
- Solid D (+44.9) · D 71.9% · R 27.0% · Other 1.1%
- 2008→2024 swing
- +9.8pp toward D · 2008: 35.0pp · 2024: 44.9pp
- All cycles
- 2024: D+44.9 2020: D+46.4 2016: D+42.1 2012: D+29.6 2008: D+35.0
Not yet ingested
- Civics
- —
Market trends
- HPI YoY
- ▲ 18.01%
- Current HPI
- 407.99
- Rent YoY
- ▲ 0.95%
- Metro
- Atlanta-Sandy Springs-Alpharetta, GA
- State GDP YoY
- ▲ 2.66%
- F500 in state
- 28
Industry mix (Fortune 500 HQ in GA)
| Industry | F500 HQs | Revenue |
|---|---|---|
| Paper / Packaging | 2 | $29B |
|
||
| Retail | 1 | $160B |
|
||
| Transportation / Logistics | 1 | $91B |
|
||
| Airlines | 1 | $62B |
|
||
| Consumer Goods | 1 | $47B |
|
||
| Utilities | 1 | $25B |
|
||
Price history
+125.6% since first listed18 events — show timeline
- 2026-06-15 Listed $169,000 FMLS
- 2026-03-27 Listing Removed — FMLS
- 2026-03-27 Listing Removed — GAMLS
- 2025-12-27 Listing Removed — GAMLS
- 2025-12-24 Relisted — GAMLS
- 2025-12-12 Listed $170,000 FMLS
- 2025-12-12 Listed $170,000 GAMLS
- 2025-11-24 Delisted — GAMLS
- 2025-10-30 Relisted — GAMLS
- 2025-10-16 Pending — GAMLS
- 2025-10-06 Listed $190,000 GAMLS
- 2025-10-03 Listing Removed — GAMLS
- 2025-08-11 Relisted — GAMLS
- 2025-07-15 Pending — GAMLS
- 2025-06-23 Price Changed $190,000 GAMLS
- 2025-06-04 Listed $199,999 GAMLS
- 2008-06-04 Sold (MLS) $74,108 FMLS
- 2007-10-05 Listed $74,900 FMLS
Property tax history
+0.4%/yrLatest (2025): $955 · +4.9% YoY. Source: county tax records.
Cash-flow waterfall
monthlySold comps — $/sqft
last 12 mo · ≤1 miLoading sold comps…