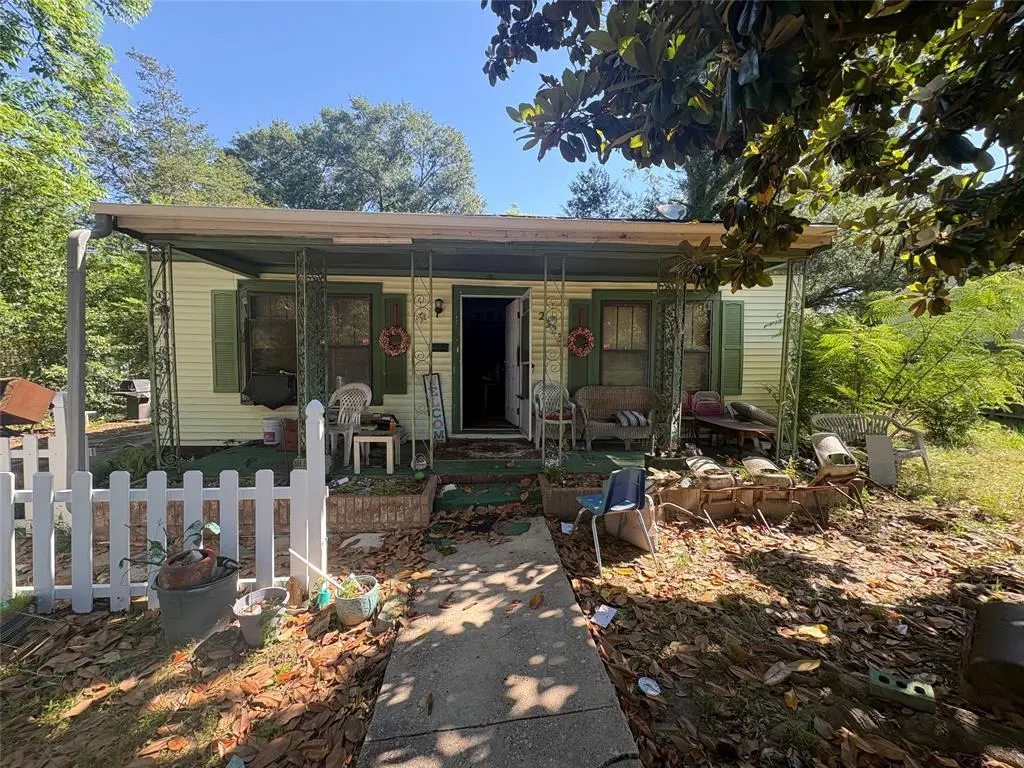
2323 Belvedere Blvd · Tyler, TX
Flood risk 1/10 · Minimal
- FEMA flood zone
- X (unshaded)
- Chance of flooding over 30 yrs
- 0.0%
- Est. flood insurance / yr
- $507 – $1,088
Fire risk 2/10 · Minimal
- Est. fire insurance / yr
- $1,222 – $2,270
Heat risk 6/10 · Moderate
- Hot days now (above 109°F)
- 7 days/yr
- Hot days in 30 yrs
- 25 days/yr
Wind risk 6/10 · Moderate
- Chance of severe wind over 30 yrs
- 59.0%
Air-quality risk 2/10 · Minimal
- Unhealthy air days now
- 0 days/yr
- Unhealthy air days in 30 yrs
- 1 days/yr
Risk factors via First Street. Map © Google.
Why this score? — see what drove the B+ grade
The composite is a weighted blend of 9 inputs, each scored 0–100. Each bar is that input's sub-score; the figure is the points it added to the 100-point composite (weight × sub-score).
- Cash flow +30.0/30.0
- ARV discount +15.0/15.0
- 1% rule +10.0/10.0
- DSCR +10.0/10.0
- Livability +3.8/5.0
- Schools +3.3/10.0
- Rent growth +3.1/5.0
- Condition / age +2.5/5.0
- Appreciation +0.0/10.0
$85,000
🖨 Deal sheet (PDF) 📄 Offer letter ✓ Due diligence
Listing remarks
Located in the growing Tyler market, this 3-bedroom, 2-bath property at 2323 Belvedere Blvd offers strong potential for investors looking to expand their portfolio. Featuring a functional layout, spacious living areas, and solid curb appeal, this home presents an excellent opportunity for a rental property, fix-and-flip, or long-term hold. Conveniently situated near schools, shopping, dining, and major roadways, the property is positioned in an area with continued demand and growth. With the right updates and vision, this home has the potential to generate attractive returns and long-term value. Cash ONLY! Buyer to purchase survey. Buyer to verify info.
Key facts
- Solid curb appeal
- Functional layout
- 0.26 acre lot
Tags
Property features AI
Finance
- Other: Listing is Active Under Contract; Photos available (16)
- Financial info: Treat as clear loan type; No second mortgage; Listing terms: Cash; Possession negotiable; typical 30-60 days or at closing/funding
- HOA & community: No association
Exterior
- Parking: Driveway
- Utilities: City water; Not in a municipal utility district
- Home design: Single family residence; Residential property; One story; Built in 1946; Not attached
- Construction: Year built 1946
- Exterior features: Lot less than 0.5 acre (approximately 0.2583 acres); Subdivision: Forest Hills; Use GPS for directions
Interior
- Kitchen: Dishwasher; Electric oven
- Bedrooms: 3 bedrooms (primary bedroom on level 1)
- Bathrooms: 3 total bathrooms (2 full, 1 half)
- Interior features: Built-in features; Pantry; One living area; One dining area; One level (single story)
- Laundry & utility: Room count listed as 2
Neighborhood map
What this means for you Summary
Snapshot
- This is a 3-bed/1.0-bath single-family listed at $85k.
Deal economics
- At list price, monthly cash flow is $539 ($6k/yr) — positive.
- The deal already cash-flows at list — no discount required.
- Meets the 1% rule at list price ($1k rent vs $85k).
- Cap rate 13.9% vs local median 3.5% in Tyler — top-decile yield for the area; either an underpriced asset or a hidden risk that comps aren't pricing in. Stress-test before assuming the spread holds.
Location & tenants
- Location reads 75/100 on livability (#147 in TX, #4,181 nationally) — a middle-class / working-renter tenant base. Strengths: cost of living A+, housing A+, health & safety A+; Watch: employment C-, crime D+, commute F.
- Tyler ISD (urban): math 39% / reading 38% proficiency, ranked #449 of 826 in TX (top 54%) — families likely to look elsewhere, expect single-tenant / working-renter base with shorter leases; 66% free/reduced lunch — lower-income household profile, screen leases tightly.
- Zoned schools: T J Austin El (math 32% / reading 22%, grade F, #2,791 of 4,322 statewide, top 68%, 334 students, 99% FRL); Boulter Middle (math 28% / reading 22%, grade F, #1,258 of 1,662 statewide, top 77%, 853 students, 93% FRL); Tyler H S (math 26% / reading 27%, grade F, #1,228 of 1,632 statewide, top 76%, 2,164 students, 90% FRL) — zoned schools average 94% FRL vs 66% district-wide (28 pts higher); higher-poverty schools than district average — tighter screening recommended.
- Zoned-school proficiency averages 26% at this address vs 38% district-wide (-12 pts) — the specific schools serving this property underperform the Tyler ISD average; the district grade overstates school quality for this exact location.
- Market conditions: Rents rising (+2.3%/yr); 156 active listings in the ZIP; 19 comparable units currently listed for rent nearby; rentals at typical pace (median 23d on market — plan ~3-4 weeks tenant-placement turnaround); 42% of comp listings sitting > 30 days — soft ceiling on asking rent; 595 units permitted in Smith County in 2024 (45 in 5+ unit buildings).
- This rent runs 33% of the median local income ($52k/yr) — at the standard rent-burdened threshold; future hikes will face affordability resistance.
Forward outlook
- Local home prices are declining (-3.0%/yr); year-one equity from $588 of loan paydown is wiped out by about $3k of value loss. Plan a longer hold.
- Smith County population projected at +24% by 2050 — long-run rental-demand tailwind backs the buy-and-hold thesis.
- At projected returns (-3.0% appreciation + 2.3% rent growth), your $24k cash investment doubles in ~5 years — after that, you're playing with house money.
Negotiation context
- Only 14 days on market — expect competitive offers; lowballing is unlikely to land.
Risks & watch-outs
- Watch-outs: built in 1946 — expect roof / HVAC / electrical / plumbing capex.
- Climate carrying-cost: major wind risk, 59% chance of damaging wind over 30y; extreme-heat days projected 7→25/yr by 2055 (HVAC capex compounding) — expect insurance premiums to compound above CPI over the hold.
Questions for the listing agent
- Built in 1946 — when were the roof, HVAC, electrical panel, plumbing, and water heater last replaced?
- Is there a deadline driving the sale (1031 exchange, divorce, estate, relocation)? That informs how much negotiation room exists.
- Schools are D-rated, which usually means shorter tenancies and higher turnover. Who's the typical renter profile here, and what's been the actual vacancy rate?
- Crime grade is D in this area — have there been break-ins, vandalism, or insurance claims at this property in the last 3 years? What carrier currently insures it and at what premium?
- What's the average days-on-market for RENTAL listings here right now (not sales)? A rising rental-DOM trend means longer vacancies and softer asking-rent achievability than the comps imply.
- What's the recent tenant-quality profile in this submarket — average credit score on applications, eviction rate, late-payment / NSF rate, and stable-employment percentage? A property-management company in the area should have these aggregated.
- How much new for-sale + rental construction is in the pipeline within 1–3 miles? Heavy new supply typically softens prices + rents 12–24 months out; constrained supply supports both.
Investment metrics
- 1% rule
- 1.68% ✓
- Cap rate
- 13.91%
- Cash-on-cash
- 27.19%
- DSCR
- 2.21
- GRM
- 5.0
CMA / ARV
- ARV (median comp)
- $115,735
- List price
- $85,000
- Delta
- -26.56%
- Verdict
- UNDERPRICED
- Comps
- 17 within 1.0 mi
Show comp detail 5 sales within ~0.75 mi
| Address | Dist | Beds/Ba | Sqft | Sold | Price | $/sf | Match |
|---|---|---|---|---|---|---|---|
| 2207 Belvedere Blvd | 0.10mi | 3/1.5 | 1,444 (-2%) | 1mo | $58,300 | $40 | 90 |
| 706 N Forest Ave | 0.45mi | 3/1.0 | 1,397 (-5%) | 12mo | $70,000 | $50 | 61 |
| 1556 Crescent Dr | 0.61mi | 3/2.0 | 1,471 (-0%) | 15mo | $199,900 | $136 | 55 |
| 1291 N Englewood | 0.66mi | 3/2.0 | 1,588 (+8%) | 14mo | $249,900 | $157 | 41 |
| 1603 N Glenwood | 0.50mi | 4/2.0 (+1) | 1,349 (-8%) | 18mo | $169,900 | $126 | 38 |
Match score weights: distance 35% · size 25% · config 20% · recency 20%. Top-matched comps best support the ARV.
Projected returns pro-forma
-3.0% appreciation · 2.27% rent growth · sell at horizon
- IRR
- 20.3%
- Equity multiple
- 1.82×
- Total profit
- $19,549
- Equity at exit
- $12,674
- IRR
- 28.1%
- Equity multiple
- 3.40×
- Total profit
- $57,124
- Equity at exit
- $7,349
Cash invested: $23,800 (down + closing). Projections, not guarantees.
Landlord ↔ Tenant lean methodology
- Overall (STATE)
- 87 Strongly Landlord-Friendly
- State Texas
- 87 Strongly Landlord-Friendly · R+5
- County
- — inherits STATE
- City
- — inherits STATE
ZIP-level market 75702
- Home prices YoY
- -5.8%
- Rents YoY
- 2.3%
- Active inventory
- 156
- Price-to-rent
- 5.0×
Monthly cashflow live
- Estimated rent
- $1,428 high interval (Pro) →
- Mortgage (P&I)
- −$446
- Tax from tax record
- −$107 /mo · $1,289/yr
- Insurance
- −$35
- HOA
- −$0
- Vacancy / Maint / Mgmt
- −$300
- Net cashflow
- $539
Break-even live
Sensitivity live
| Price | -10% $587 | -5% $563 | +0% $539 | +5% $515 | +10% $491 |
|---|---|---|---|---|---|
| Rent | -10% $426 | -5% $483 | +0% $539 | +5% $596 | +10% $652 |
| Rate | -1.0pp $582 | -0.5pp $561 | base $539 | +0.5pp $517 | +1.0pp $495 |
UW: 25.0% down · 7.5% · 30yr · 1.5% tax · 5.0% vac · 8.0% maint · 8.0% mgmt
Financing live
Cash to close
- Down payment
- $21,250
- Closing costs
- $2,550
- Reserves months
- —
- Total cash needed
- —
Loan-product check · same deal, 3 products live
Conventional
25% down · 7.5% · 30yr
- Down + closing
- —
- Monthly P&I
- —
- Monthly cashflow
- —
- DSCR
- —
- Eligible?
- —
Personal DTI + credit; lowest rate.
DSCR
20% down · 8.5% · 30yr
- Down + closing
- —
- Monthly P&I
- —
- Monthly cashflow
- —
- DSCR
- —
- Eligible?
- —
No personal income docs; deal must DSCR.
Hard money
10% down · 12.0% · 12mo
- Down + closing
- —
- Monthly P&I
- —
- Monthly cashflow
- —
- DSCR
- —
- Eligible?
- —
Short-term bridge; refi at stabilization.
Rent comps 19 comps
| Address | Beds | Baths | Sqft | Rent | $/sqft | DOM | Units | Dist |
|---|---|---|---|---|---|---|---|---|
| 1538 N Hill Ave Tyler, TX | 3.0 | 2.0 | 1813 | $1,650 | $0.91 | 23d | 1 | 0.53mi |
| 2006 W Oakwood St Tyler, TX | 3.0 | 2.0 | 1344 | $1,895 | $1.41 | 15d | 1 | 0.67mi |
| 1523 N Englewood Ave Tyler, TX | 3.0 | 2.0 | 1542 | $1,650 | $1.07 | 45d | 1 | 0.68mi |
| 1822 W Oakwood St Tyler, TX | 2.0 | 1.0 | 900 | $1,100 | $1.22 | 45d | 1 | 0.70mi |
| 1806 W Oakwood St Tyler, TX | 2.0 | 1.0 | 900 | $975 | $1.08 | 23d | 1 | 0.72mi |
| 1800 W Oakwood St Tyler, TX | 2.0 | 1.0 | 900 | $975 | $1.08 | 23d | 1 | 0.73mi |
| 720 N Englewood Ave Tyler, TX | 3.0 | 1.0 | 1856 | $1,650 | $0.89 | 45d | 1 | 0.75mi |
| 2007 Bradshaw Dr Tyler, TX | 3.0 | 2.0 | 1056 | $1,600 | $1.52 | 45d | 1 | 0.94mi |
| 826 W Franklin St Tyler, TX | 3.0 | 2.0 | 1273 | $1,550 | $1.22 | 15d | 1 | 1.01mi |
| 809 W Harmony St Tyler, TX | 3.0 | 2.0 | 1309 | $1,500 | $1.15 | 45d | 1 | 1.03mi |
| 1618 N Tenneha Ave Tyler, TX | 3.0 | 1.0 | 1587 | $1,400 | $0.88 | 15d | 1 | 1.10mi |
| 714 W Bow St Unit B Tyler, TX | 2.0 | 1.0 | 969 | $785 | $0.81 | 15d | 1 | 1.17mi |
| 819 W 26th St Tyler, TX | 3.0 | 2.0 | 1200 | $995 | $0.83 | 23d | 1 | 1.26mi |
| 821 W 26th St Tyler, TX | 3.0 | 2.0 | 1200 | $995 | $0.83 | 23d | 1 | 1.26mi |
| 2202 W Nw LOOP Tyler, TX | 2.0–3.0 | 2.0 | 1115 | $1,371 | $1.23 | 23d | 1 | 1.27mi |
| 501 W Vance St Tyler, TX | 3.0 | 2.0 | 1160 | $1,350 | $1.16 | 45d | 1 | 1.28mi |
| 611 N Border Ave Unit 300 Tyler, TX | 2.0 | 1.5 | 1008 | $1,200 | $1.19 | 45d | 1 | 1.34mi |
| 2515 N Tenneha Ave Tyler, TX | 2.0 | 1.0 | 910 | $945 | $1.04 | 45d | 1 | 1.34mi |
| 1104 W Park St Tyler, TX | 3.0 | 2.0 | 1440 | $1,650 | $1.15 | 23d | 1 | 1.42mi |
Listing history 2 events
-
2026-05-18historical Active Option Contract 662-char remark
-
2026-05-12$85,000 Active 662-char remark
ⓘ Source: listings_history table (triggers on properties + properties_extension) + one-shot
backfill from property_details.listing_events for pre-trigger history.
Tax reassessment forecast TX · Resets to sale price
- Current annual tax
- $1,289 · $107/mo
- Projected year-2 tax
- $1,556 · $130/mo
- Expected delta
- +$266/yr (+$22/mo · 20.7%)
ⓘ Screening estimate from a state-policy table — verify with the county assessor before closing.
Climate risk First Street
- Flood 1/10 Low FEMA zone X (unshaded) · 0% chance over 30 yrs
- Wildfire 2/10 Low
- Heat 6/10 Major 7 d/yr ≥109°F today · 25 d/yr by 30 yrs out
- Wind 6/10 Major 59% chance of damaging wind over 30 yrs
- Air quality 2/10 Low 0 unhealthy d/yr today · 1 by 30 yrs out
Nearby sold comps map
Loading sold comps map…
Walkable amenities ~0.75 mi
Loading nearby amenities…
Taxation est. · year 1
- Rental income
- $17,131
- − Mortgage interest
- −$4,761
- − Property taxes
- −$1,289
- − Insurance
- −$425
- − Repairs & maintenance
- −$1,370
- − Management
- −$1,370
- − Depreciation
- −$2,473
- Taxable income
- $5,442
- Est. tax owed @ 24.0%
- −$1,306
- After-tax cash flow
- $5,164/yr
For passive investors: Depreciation is non-cash, so a rental often shows a tax loss while cash-flowing — sheltering income. Rental losses are passive: they offset passive income freely, and up to $25,000/yr can offset ordinary (W-2) income if you actively participate and your MAGI is under $100k (phasing out to $0 by $150k); unused losses carry forward. On sale, claimed depreciation is recaptured at up to 25%, and gains may owe capital-gains tax (a 1031 exchange can defer both). Figures are a year-1 estimate at your 24.0% rate — not tax advice; consult a CPA.
Schools (NCES district)
- District
- Tyler ISD
- NCES district ID
- 4843470
- Math proficiency
- 39% ▼ -4.00%
- Reading proficiency
- 38% ▼ -1.00%
- Median HH income
- $44,090
- Composite
- 32.69/100
- National rank
- #5650
- State rank
- #449 of 826 in TX
Livability — Tyler
- Score
- 75/100
- State rank
- #147
- US rank
- #4181
Category grades
Schools grade is shown separately in the Schools card above.
Census & demographics
- Census place
- Tyler, TX
- County
- Smith County · 180,570 people
- City population
- 127,842
- Metro
- Tyler, TX
- Population (ZIP)
- 27,927
- Household income
- $51,564
- Rent vs Own
- Severe rent burden
- 803.0
Population outlook (Smith County) Hauer SSP2
- Today (2025)
- 248,890 people
- By 2030
- 261,665 · +5.1%
- By 2040
- 286,114 · +15.0%
- By 2050
- 308,006 · +23.8%
- By 2075
- 354,171 · +42.3%
- By 2100
- 372,828 · +49.8%
Race, ethnicity, and origin ACS 2023
- Neighborhood character
- Diverse neighborhood (Simpson 0.61)
- Race & ethnicity
- Hispanic / Latino 49% Black 37% White 12% Two or more races 11% Native American 1%
- Hispanic origin (detail)
- Mexican 47%
- Common ancestry
- Lithuanian 1%
- Foreign-born
- 20% · Canada
- Languages at home
- 56% English-only · Spanish 44%
Political lean MEDSL · Smith
- 2024 margin
- Solid R (+45.1) · D 27.0% · R 72.1%
- 2008→2024 swing
- -5.6pp toward R · 2008: -39.5pp · 2024: -45.1pp
- All cycles
- 2024: R+45.1 2020: R+39.4 2016: R+43.9 2012: R+46.9 2008: R+39.5
Not yet ingested
- Civics
- —
Market trends
- HPI YoY
- ▼ -12.63%
- Current HPI
- 207.1573
- Rent YoY
- ▲ 2.27%
- Metro
- Tyler, TX
- State GDP YoY
- ▲ 3.95%
- F500 in state
- 110
Industry mix (Fortune 500 HQ in TX)
| Industry | F500 HQs | Revenue |
|---|---|---|
| Energy | 16 | $1,198B |
|
||
| Technology | 5 | $198B |
|
||
| Engineering / Construction | 4 | $72B |
|
||
| Energy Services | 3 | $60B |
|
||
| Utilities | 3 | $41B |
|
||
| Healthcare | 2 | $330B |
|
||
Price history
3 events — show timeline
- 2026-05-26 Pending — NTREIS
- 2026-05-18 Contingent — NTREIS
- 2026-05-12 Listed $85,000 NTREIS
Property tax history
+3.1%/yrLatest (2024): $1,289 · +7.4% YoY. Source: county tax records.
Cash-flow waterfall
monthlySold comps — $/sqft
last 12 mo · ≤1 miLoading sold comps…