309 Cullman Rd · Arab, AL
Flood risk 1/10 · Minimal
- FEMA flood zone
- X (unshaded)
- Chance of flooding over 30 yrs
- 0.0%
- Est. flood insurance / yr
- $507 – $1,088
Fire risk 2/10 · Minimal
- Est. fire insurance / yr
- $916 – $1,700
Heat risk 4/10 · Minor
- Hot days now (above 104°F)
- 7 days/yr
- Hot days in 30 yrs
- 20 days/yr
Wind risk 4/10 · Minor
- Chance of severe wind over 30 yrs
- 21.0%
Air-quality risk 2/10 · Minimal
- Unhealthy air days now
- 1 days/yr
- Unhealthy air days in 30 yrs
- 3 days/yr
Risk factors via First Street. Map © Google.
Why this score? — see what drove the C grade
The composite is a weighted blend of 9 inputs, each scored 0–100. Each bar is that input's sub-score; the figure is the points it added to the 100-point composite (weight × sub-score).
- Cash flow +19.6/30.0
- ARV discount +15.0/15.0
- DSCR +6.2/10.0
- 1% rule +5.2/10.0
- Schools +4.7/10.0
- Livability +3.2/5.0
- Rent growth +2.5/5.0
- Condition / age +2.5/5.0
- Appreciation +0.0/10.0
$129,900
🖨 Deal sheet 📄 Offer letter ✓ Due diligence
Listing remarks
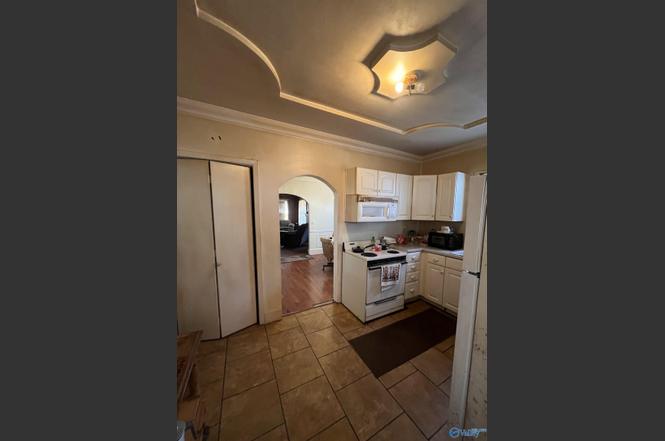
Home has 1472 ft² with 3 bedrooms, 2 1/2 baths. Small space used as a salon but ideal for a home office. Has a separate entrance & 1/2 bath. Home needs TLC but can be lived in while making it you dream home.
Key facts
- Separate entrance
- 0.34 acre lot
- Parking
Tags
Property features AI
Finance
- Other: Subdivision: W T Hinds
- HOA & community: No homeowners association
Exterior
- Parking: Carport (1 space); Gravel driveway
- Utilities: Public water; Public sewer; Natural gas
- Home design: Single-family residence; Two levels; Built in 1925; Brick construction
- Construction: Brick exterior; One fireplace; Two-story; Built 1925
- Exterior features: Public water; Public sewer; Lot dimensions approximately 75 x 200 (0.34 acre)
Interior
- Bedrooms: Total rooms: 4
- Bathrooms: 1 full bathroom; 1 three-quarter bathroom; 2 half bathrooms
- Heating & cooling: Natural gas heating; Window cooling units (2+)
- Interior features: Basement; One fireplace
Neighborhood map
What this means for you Summary
Snapshot
- This is a 3-bed/3.0-bath single-family listed at $130k.
Deal economics
- At list price, monthly cash flow is $149 ($2k/yr) — positive.
- The deal already cash-flows at list — no discount required.
- Meets the 1% rule at list price ($1k rent vs $130k).
- Recommended offer: $114k (12.0% below list) — sets the bar for market timing.
- Cap rate 7.7% vs local median 3.0% in Arab — top-decile yield for the area; either an underpriced asset or a hidden risk that comps aren't pricing in. Stress-test before assuming the spread holds.
Location & tenants
- Location reads 64/100 on livability (#149 in AL) — a middle-class / working-renter tenant base. Strengths: cost of living A+, housing A+; Watch: employment C-, crime D, amenities F.
- Arab City (rural): math 47% / reading 64% proficiency, ranked #9 of 129 in AL (top 7%) — acceptable for families but not a draw, mixed tenant base, ~2y average lease.
- Zoned schools: Arab Elementary School (math 59% / reading 73%, grade B+, #36 of 627 statewide, top 6%, 580 students, 52% FRL); Arab High School (math 37% / reading 47%, grade F, #28 of 305 statewide, top 10%, 779 students, 40% FRL) — zoned schools average 46% FRL vs 29% district-wide (17 pts higher); higher-poverty schools than district average — tighter screening recommended.
- Market conditions: 178 active listings in the ZIP; 5 comparable units currently listed for rent nearby; rentals leasing fast (median 12d on market — plan ~1-2 weeks tenant-placement turnaround); 163 units permitted in Marshall County in 2024 (0 in 5+ unit buildings).
Forward outlook
- Local home prices are declining (-3.0%/yr); year-one equity from $898 of loan paydown is wiped out by about $4k of value loss. Plan a longer hold.
Negotiation context
- It's been on market 199 days — a 12% lower offer ($114k) is reasonable based on typical stale-listing flexibility.
- 2 sale attempts; this cycle's ask has dropped $29k (18%) from the opening price — seller is motivated, your offer sets the floor, not the list.
Risks & watch-outs
- Watch-outs: built in 1925 — expect roof / HVAC / electrical / plumbing capex.
Questions for the listing agent
- It's been on market 199 days. Have you received any prior offers? Is the seller open to a 12% concession, seller financing, or rate buy-down credit?
- Built in 1925 — when were the roof, HVAC, electrical panel, plumbing, and water heater last replaced?
- Why hasn't it sold? Are there any deal-killer items the seller is aware of (foundation, flood, title, zoning, code violations)?
- Is there a deadline driving the sale (1031 exchange, divorce, estate, relocation)? That informs how much negotiation room exists.
- Crime grade is D in this area — have there been break-ins, vandalism, or insurance claims at this property in the last 3 years? What carrier currently insures it and at what premium?
- What's the average days-on-market for RENTAL listings here right now (not sales)? A rising rental-DOM trend means longer vacancies and softer asking-rent achievability than the comps imply.
- What's the recent tenant-quality profile in this submarket — average credit score on applications, eviction rate, late-payment / NSF rate, and stable-employment percentage? A property-management company in the area should have these aggregated.
- How much new for-sale + rental construction is in the pipeline within 1–3 miles? Heavy new supply typically softens prices + rents 12–24 months out; constrained supply supports both.
Investment metrics
- 1% rule
- 1.02% ✓
- Cap rate
- 7.67%
- Cash-on-cash
- 4.91%
- DSCR
- 1.22
- GRM
- 8.2
CMA / ARV
- ARV (on-the-fly)
- $250,240
- Comps found
- 12
Show comp detail 12 sales within ~0.75 mi
| Address | Dist | Beds/Ba | Sqft | Sold | Price | $/sf | Match |
|---|---|---|---|---|---|---|---|
| 212 4th St NW | 0.28mi | 3/2.0 | 1,569 (+7%) | 4mo | $242,000 | $154 | 68 |
| 423 Shoal Creek Trl NE | 0.56mi | 3/2.0 | 1,417 (-4%) | 2mo | $260,000 | $183 | 62 |
| 421 South Main St | 0.41mi | 3/2.0 | 1,585 (+8%) | 3mo | $329,000 | $208 | 62 |
| 476 NE 2nd St | 0.55mi | 3/2.0 | 1,499 (+2%) | 8mo | $240,000 | $160 | 61 |
| 303 4th Ave NE | 0.54mi | 3/2.0 | 1,516 (+3%) | 14mo | $257,000 | $170 | 55 |
| 312 4th Pl NE | 0.55mi | 3/2.0 | 1,504 (+2%) | 15mo | $255,000 | $170 | 54 |
| 604 Shoal Creek Trl | 0.66mi | 3/2.0 | 1,399 (-5%) | 9mo | $200,000 | $143 | 50 |
| 606 N Main St | 0.65mi | 3/1.5 | 1,375 (-7%) | 12mo | $194,900 | $142 | 43 |
| 320 SE Jordan Ln | 0.72mi | 3/2.0 | 1,418 (-4%) | 18mo | $189,000 | $133 | 42 |
| 120 Bentley Cir SE | 0.44mi | 4/2.0 (+1) | 1,627 (+10%) | 16mo | $249,900 | $154 | 40 |
| 200 6th St NE | 0.62mi | 3/2.0 | 1,650 (+12%) | 11mo | $345,000 | $209 | 38 |
| 304 Jordan Ln SE | 0.70mi | 3/2.0 | 1,291 (-12%) | 12mo | $230,000 | $178 | 33 |
Match score weights: distance 35% · size 25% · config 20% · recency 20%. Top-matched comps best support the ARV.
Projected returns pro-forma
-3.0% appreciation · 3.0% rent growth · sell at horizon
- IRR
- -8.6%
- Equity multiple
- 0.68×
- Total profit
- $-11,546
- Equity at exit
- $19,369
- IRR
- 0.9%
- Equity multiple
- 1.06×
- Total profit
- $2,237
- Equity at exit
- $11,231
Cash invested: $36,372 (down + closing). Projections, not guarantees.
Landlord ↔ Tenant lean methodology
- Overall (STATE)
- 90 Strongly Landlord-Friendly
- State Alabama
- 90 Strongly Landlord-Friendly · R+15
- County
- — inherits STATE
- City
- — inherits STATE
ZIP-level market 35016
- Home prices YoY
- -28.0%
- Active inventory
- 178
- Price-to-rent
- 8.2×
Monthly cashflow live
- Estimated rent
- $1,325 high interval (Pro) →
- Mortgage (P&I)
- −$681
- Tax est. 1.5%
- −$162 /mo · $1,948/yr
- Insurance
- −$54
- HOA
- −$0
- Vacancy / Maint / Mgmt
- −$278
- Net cashflow
- $149
Break-even live
UW: 25.0% down · 7.5% · 30yr · 1.5% tax · 5.0% vac · 8.0% maint · 8.0% mgmt
Financing live
Cash to close
- Down payment
- $32,475
- Closing costs
- $3,897
- Reserves months
- —
- Total cash needed
- —
Loan-product check · same deal, 3 products live
Conventional
25% down · 7.5% · 30yr
- Down + closing
- —
- Monthly P&I
- —
- Monthly cashflow
- —
- DSCR
- —
- Eligible?
- —
Personal DTI + credit; lowest rate.
DSCR
20% down · 8.5% · 30yr
- Down + closing
- —
- Monthly P&I
- —
- Monthly cashflow
- —
- DSCR
- —
- Eligible?
- —
No personal income docs; deal must DSCR.
Hard money
10% down · 12.0% · 12mo
- Down + closing
- —
- Monthly P&I
- —
- Monthly cashflow
- —
- DSCR
- —
- Eligible?
- —
Short-term bridge; refi at stabilization.
Rent comps 5 comps
| Address | Beds | Baths | Sqft | Rent | $/sqft | DOM | Units | Dist |
|---|---|---|---|---|---|---|---|---|
| 353 4th Ave NW Arab, AL | 3.0 | 1.0 | 1092 | $1,250 | $1.14 | 2d | 1 | 0.36mi |
| 500 4th St NE Arab, AL | 4.0 | 2.0 | 1219 | $1,350 | $1.11 | 11d | 1 | 0.70mi |
| 543 7th Ave NW Arab, AL | 2.0 | 1.0 | 1126 | $1,050 | $0.93 | 21d | 1 | 0.71mi |
| 320 Jordan Ln SE Arab, AL | 3.0 | 2.0 | 1418 | $1,550 | $1.09 | 13d | 1 | 0.74mi |
| 28 Arad Thompson Rd NE Arab, AL | 3.0 | 2.0 | 1314 | $1,500 | $1.14 | 11d | 1 | 1.25mi |
Listing history 19 events
-
2026-06-19days on market $129,900 Active 199 DOM
-
2026-06-18days on market $129,900 Active 198 DOM
-
2026-06-17days on market $129,900 Active 197 DOM
-
2026-06-16days on market $129,900 Active 196 DOM
-
2026-06-15days on market $129,900 Active 195 DOM
-
2026-06-14days on market $129,900 Active 193 DOM
-
2026-06-12days on market $129,900 Active 192 DOM
-
2026-06-09days on market $129,900 Active 189 DOM
-
2026-06-08days on market $129,900 Active 188 DOM
-
2026-06-07days on market $129,900 Active 187 DOM
-
2026-06-04days on market $129,900 Active 183 DOM
-
2026-06-02days on market $129,900 Active 182 DOM
-
2026-06-01days on market $129,900 Active 181 DOM
-
2026-05-31days on market $129,900 Active 180 DOM
-
2026-05-31days on market $129,900 Active 179 DOM
-
2026-05-23status Active
-
2026-04-21historical Contingent
-
2026-04-16price $129,900
-
2025-12-02$159,000 Active
ⓘ Source: listings_history table (triggers on properties + properties_extension) + one-shot
backfill from property_details.listing_events for pre-trigger history.
Climate risk First Street
- Flood 1/10 Low FEMA zone X (unshaded) · 0% chance over 30 yrs
- Wildfire 2/10 Low
- Heat 4/10 Moderate 7 d/yr ≥104°F today · 20 d/yr by 30 yrs out
- Wind 4/10 Moderate 21% chance of damaging wind over 30 yrs
- Air quality 2/10 Low 1 unhealthy d/yr today · 3 by 30 yrs out
Nearby sold comps map
Loading sold comps map…
Walkable amenities ~0.75 mi
Loading nearby amenities…
Taxation est. · year 1
- Rental income
- $15,898
- − Mortgage interest
- −$7,276
- − Property taxes
- −$1,948
- − Insurance
- −$650
- − Repairs & maintenance
- −$1,272
- − Management
- −$1,272
- − Depreciation
- −$3,779
- Taxable loss
- −$299
- Est. tax savings @ 24.0%
- +$72
- After-tax cash flow
- $1,859/yr
For passive investors: Depreciation is non-cash, so a rental often shows a tax loss while cash-flowing — sheltering income. Rental losses are passive: they offset passive income freely, and up to $25,000/yr can offset ordinary (W-2) income if you actively participate and your MAGI is under $100k (phasing out to $0 by $150k); unused losses carry forward. On sale, claimed depreciation is recaptured at up to 25%, and gains may owe capital-gains tax (a 1031 exchange can defer both). Figures are a year-1 estimate at your 24.0% rate — not tax advice; consult a CPA.
Schools (NCES district)
- District
- Arab City
- NCES district ID
- 0100100
- Math proficiency
- 47% ▼ -25.00%
- Reading proficiency
- 64% ▬ 0.00%
- Median HH income
- $42,728
- Composite
- 46.58/100
- National rank
- #2422
- State rank
- #9 of 129 in AL
Livability — Arab
- Score
- 64/100
- State rank
- #149
- US rank
- #13733
Category grades
Schools grade is shown separately in the Schools card above.
Census & demographics
- Census place
- Arab, AL
- City population
- 17,435
- Population (ZIP)
- 17,435
Population outlook (Marshall County) Hauer SSP2
- Today (2025)
- 97,402 people
- By 2030
- 98,138 · +0.8%
- By 2040
- 98,502 · +1.1%
- By 2050
- 97,024 · -0.4%
- By 2075
- 89,334 · -8.3%
- By 2100
- 74,749 · -23.3%
Race, ethnicity, and origin ACS 2023
- Neighborhood character
- Predominantly White (89%)
- Race & ethnicity
- White 89% Hispanic / Latino 5% Two or more races 5% Asian 1%
- Hispanic origin (detail)
- Mexican 4%
- Common ancestry
- Slovak 2% Italian 1% Serbian 1%
- Foreign-born
- 2% · Canada, China
- Languages at home
- 97% English-only · Spanish 2%
Political lean MEDSL · Marshall
- 2024 margin
- Solid R (+71.7) · D 13.8% · R 85.5%
- 2008→2024 swing
- -15.4pp toward R · 2008: -56.4pp · 2024: -71.7pp
- All cycles
- 2024: R+71.7 2020: R+68.7 2016: R+69.5 2012: R+60.1 2008: R+56.4
Not yet ingested
- Civics
- —
Market trends
- HPI YoY
- ▼ -70.17%
- Current HPI
- 180.2225
- Rent YoY
- —
- Metro
- —
- State GDP YoY
- ▲ 2.94%
- F500 in state
- 4
Industry mix (Fortune 500 HQ in AL)
| Industry | F500 HQs | Revenue |
|---|---|---|
| Financial Services | 1 | $8B |
|
||
| Healthcare | 1 | $5B |
|
||
Price history
-18.3% since first listed4 events — show timeline
- 2026-05-23 Relisted — VMLS
- 2026-04-21 Contingent — VMLS
- 2026-04-16 Price Changed $129,900 VMLS
- 2025-12-02 Listed $159,000 VMLS
Cash-flow waterfall
monthlySold comps — $/sqft
last 12 mo · ≤1 miLoading sold comps…