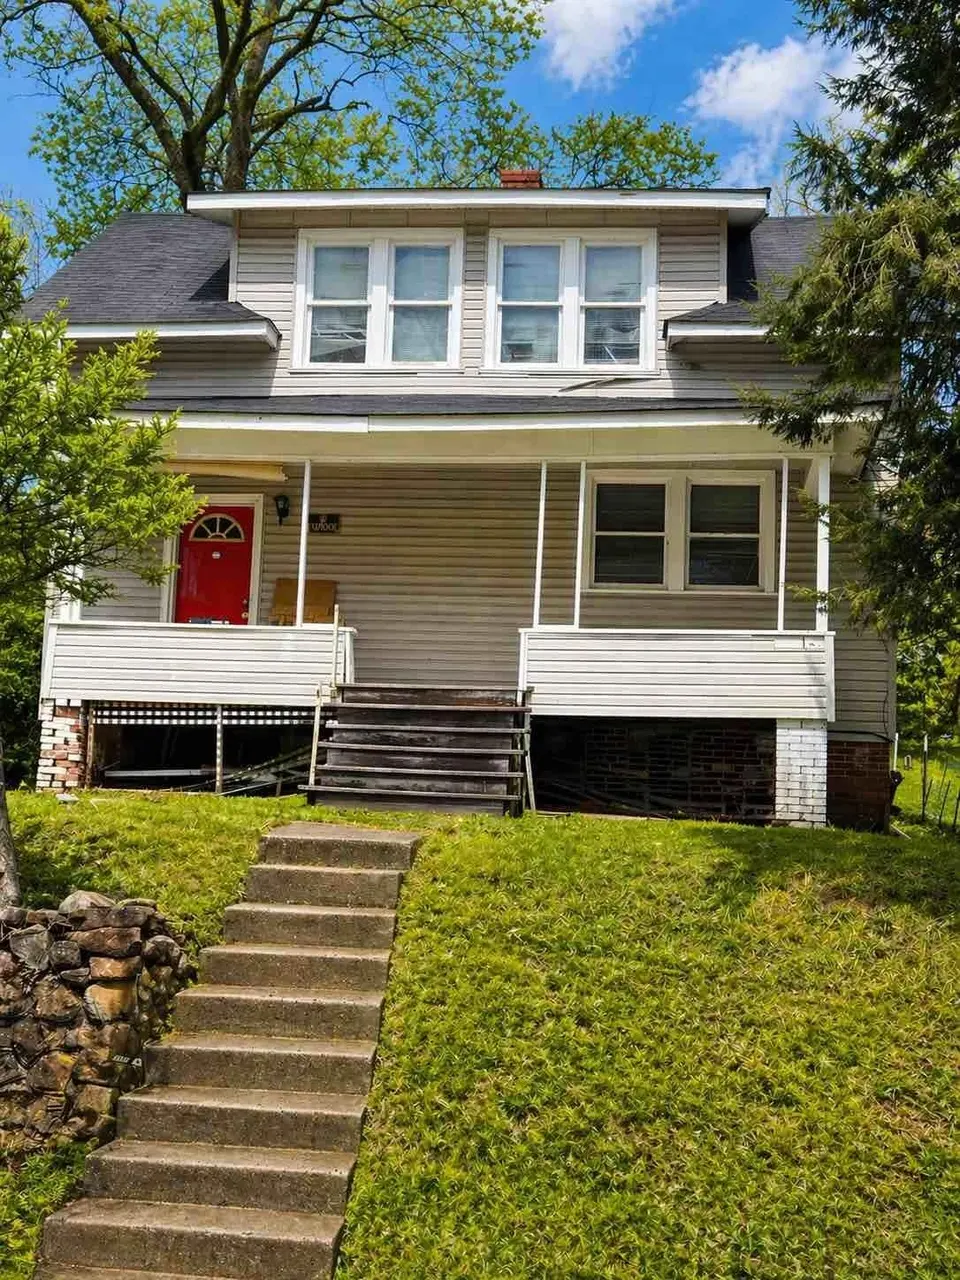
260 Rotary Rd · Huntington, WV
Flood risk 1/10 · Minimal
- FEMA flood zone
- X (unshaded)
- Chance of flooding over 30 yrs
- 0.0%
- Est. flood insurance / yr
- $507 – $1,088
Fire risk 4/10 · Minor
- Est. fire insurance / yr
- $787 – $1,461
Heat risk 4/10 · Minor
- Hot days now (above 102°F)
- 7 days/yr
- Hot days in 30 yrs
- 18 days/yr
Wind risk 2/10 · Minimal
- Chance of severe wind over 30 yrs
- 1.0%
Air-quality risk 2/10 · Minimal
- Unhealthy air days now
- 0 days/yr
- Unhealthy air days in 30 yrs
- 1 days/yr
Risk factors via First Street. Map © Google.
Why this score? — see what drove the D grade
The composite is a weighted blend of 9 inputs, each scored 0–100. Each bar is that input's sub-score; the figure is the points it added to the 100-point composite (weight × sub-score).
- Cash flow +15.0/30.0
- ARV discount +7.5/15.0
- 1% rule +5.0/10.0
- DSCR +5.0/10.0
- Livability +4.0/5.0
- Schools +3.0/10.0
- Rent growth +2.5/5.0
- Condition / age +2.5/5.0
- Appreciation +0.0/10.0
$19,500
🖨 Deal sheet 📄 Offer letter ✓ Due diligence
Listing remarks MLS
CASH ONLY BEING SOLD AS.
Key facts
- 6,098 sq ft lot
- Built 1924
- Listed 55 days
Property features AI
Finance
- Other: Directions: US Route 60 to Roby Road, left on Rotary Rd.; house about 1/2 mile on the right on the hill
Exterior
- Parking: On-street parking
- Utilities: Public water; Public sewer
- Home design: Single family residence; 2 stories
- Construction: Shingle roof
- Exterior features: Porch; Lot approximately 0.14 acres
Interior
- Bathrooms: 1 full bathroom
- Interior features: Porch; Shingle roof
Neighborhood map
What this means for you Summary
Snapshot
- This is a 2-bed/1.0-bath single-family listed at $20k.
Deal economics
- At list price, monthly cash flow is $540 ($6k/yr) — positive.
- The deal already cash-flows at list — no discount required.
- Meets the 1% rule at list price ($925 rent vs $20k).
- Recommended offer: $19k (3.0% below list) — sets the bar for market timing.
- Cap rate 39.5% vs local median 6.5% in Huntington — top-decile yield for the area; either an underpriced asset or a hidden risk that comps aren't pricing in. Stress-test before assuming the spread holds.
Location & tenants
- Location reads 79/100 on livability (#16 in WV, #2,045 nationally) — a middle-class / working-renter tenant base. Strengths: amenities A+, commute A+, cost of living A+; Watch: schools C-, crime F, employment F.
- Cabell County Schools (urban): math 31% / reading 42% proficiency, ranked #13 of 55 in WV (top 24%) — families likely to look elsewhere, expect single-tenant / working-renter base with shorter leases.
- Market conditions: 163 active listings in the ZIP; 1 comparable units currently listed for rent nearby; 61 units permitted in Cabell County in 2024 (5 in 5+ unit buildings).
Forward outlook
- Local home prices are declining (-3.0%/yr); year-one equity from $135 of loan paydown is wiped out by about $585 of value loss. Plan a longer hold.
- At projected returns (-3.0% appreciation + 3.0% rent growth), your $5k cash investment doubles in ~1 year — after that, you're playing with house money.
Negotiation context
- It's been on market 56 days — a 3% lower offer ($19k) is reasonable based on typical stale-listing flexibility.
- 2 sale attempts since 2y ago; this cycle's ask has dropped $3k (13%) from the opening price — seller is motivated, your offer sets the floor, not the list.
- Current owner paid $14k; 39% above their basis — modest negotiation headroom, anchor on the comps not their cost.
Risks & watch-outs
- Watch-outs: property tax is 4.9% of price; built in 1924 — expect roof / HVAC / electrical / plumbing capex.
Questions for the listing agent
- It's been on market 56 days. Have you received any prior offers? Is the seller open to a 3% concession, seller financing, or rate buy-down credit?
- Built in 1924 — when were the roof, HVAC, electrical panel, plumbing, and water heater last replaced?
- Property tax is high relative to price — has the assessment been appealed recently, and will the sale trigger a re-assessment?
- Is there a deadline driving the sale (1031 exchange, divorce, estate, relocation)? That informs how much negotiation room exists.
- Crime grade is F in this area — have there been break-ins, vandalism, or insurance claims at this property in the last 3 years? What carrier currently insures it and at what premium?
- The area grade is low — what's the realistic commute time and amenity access for the typical tenant pool here? Any planned neighborhood developments (good or bad) we should know about?
- What's the average days-on-market for RENTAL listings here right now (not sales)? A rising rental-DOM trend means longer vacancies and softer asking-rent achievability than the comps imply.
- What's the recent tenant-quality profile in this submarket — average credit score on applications, eviction rate, late-payment / NSF rate, and stable-employment percentage? A property-management company in the area should have these aggregated.
- How much new for-sale + rental construction is in the pipeline within 1–3 miles? Heavy new supply typically softens prices + rents 12–24 months out; constrained supply supports both.
Investment metrics
- 1% rule
- 4.74% ✓
- Cap rate
- 39.52%
- Cash-on-cash
- 118.68%
- DSCR
- 6.28
- GRM
- 1.8
CMA / ARV
- ARV (on-the-fly)
- $114,268
- Comps found
- 12
Show comp detail 12 sales within ~0.75 mi
| Address | Dist | Beds/Ba | Sqft | Sold | Price | $/sf | Match |
|---|---|---|---|---|---|---|---|
| 402 Rotary Rd | 0.11mi | 2/1.0 | 1,101 (+2%) | 13mo | $108,500 | $99 | 80 |
| 417 Rotary Rd | 0.15mi | 3/1.0 (+1) | 1,077 (-0%) | 12mo | $85,000 | $79 | 78 |
| 117 Morris St | 0.16mi | 2/1.0 | 1,008 (-6%) | 6mo | $50,000 | $50 | 77 |
| 800 Roby Rd | 0.22mi | 2/1.0 | 1,153 (+7%) | 14mo | $23,000 | $20 | 66 |
| 174 Oney Ave | 0.50mi | 2/1.0 | 1,030 (-4%) | 14mo | $29,000 | $28 | 58 |
| 2733 Washington Blvd | 0.38mi | 3/2.0 (+1) | 1,176 (+9%) | 10mo | $177,900 | $151 | 49 |
| 3044 Wallace Cir | 0.46mi | 3/1.5 (+1) | 1,219 (+13%) | 4mo | $165,000 | $135 | 46 |
| 3106 Brereton Ct | 0.71mi | 3/1.5 (+1) | 1,155 (+7%) | 3mo | $173,500 | $150 | 45 |
| 1209 26th St | 0.63mi | 2/1.0 | 940 (-13%) | 8mo | $100,000 | $106 | 42 |
| 306 Davis St | 0.44mi | 3/1.5 (+1) | 1,232 (+14%) | 11mo | $71,900 | $58 | 40 |
| 113 Allen Ave | 0.75mi | 3/1.0 (+1) | 941 (-13%) | 6mo | $143,900 | $153 | 34 |
| 111 Allen Ave | 0.75mi | 3/1.0 (+1) | 941 (-13%) | 10mo | $150,000 | $159 | 31 |
Match score weights: distance 35% · size 25% · config 20% · recency 20%. Top-matched comps best support the ARV.
Projected returns pro-forma
-3.0% appreciation · 3.0% rent growth · sell at horizon
- IRR
- —
- Equity multiple
- 6.73×
- Total profit
- $31,282
- Equity at exit
- $2,908
- IRR
- —
- Equity multiple
- 14.14×
- Total profit
- $71,724
- Equity at exit
- $1,686
Cash invested: $5,460 (down + closing). Projections, not guarantees.
Landlord ↔ Tenant lean methodology
- Overall (STATE)
- 83 Strongly Landlord-Friendly
- State West Virginia
- 83 Strongly Landlord-Friendly · R+22
- County
- — inherits STATE
- City
- — inherits STATE
ZIP-level market 25705
- Home prices YoY
- -24.9%
- Active inventory
- 163
- Price-to-rent
- 1.8×
Monthly cashflow live
- Estimated rent
- $925 medium interval (Pro) →
- Mortgage (P&I)
- −$102
- Tax from tax record
- −$80 /mo · $964/yr
- Insurance
- −$8
- HOA
- −$0
- Vacancy / Maint / Mgmt
- −$194
- Net cashflow
- $540
Break-even live
UW: 25.0% down · 7.5% · 30yr · 1.5% tax · 5.0% vac · 8.0% maint · 8.0% mgmt
Financing live
Cash to close
- Down payment
- $4,875
- Closing costs
- $585
- Reserves months
- —
- Total cash needed
- —
Loan-product check · same deal, 3 products live
Conventional
25% down · 7.5% · 30yr
- Down + closing
- —
- Monthly P&I
- —
- Monthly cashflow
- —
- DSCR
- —
- Eligible?
- —
Personal DTI + credit; lowest rate.
DSCR
20% down · 8.5% · 30yr
- Down + closing
- —
- Monthly P&I
- —
- Monthly cashflow
- —
- DSCR
- —
- Eligible?
- —
No personal income docs; deal must DSCR.
Hard money
10% down · 12.0% · 12mo
- Down + closing
- —
- Monthly P&I
- —
- Monthly cashflow
- —
- DSCR
- —
- Eligible?
- —
Short-term bridge; refi at stabilization.
Rent comps 1 comps
| Address | Beds | Baths | Sqft | Rent | $/sqft | DOM | Units | Dist |
|---|---|---|---|---|---|---|---|---|
| 2489 1st Ave Unit 101 A Huntington, WV | 1.0 | 1.0 | 750 | $925 | $1.23 | 43d | 1 | 1.49mi |
Listing history 21 events
-
2026-06-19days on market $19,500 Active 56 DOM
-
2026-06-18days on market $19,500 Active 55 DOM
-
2026-06-17days on market $19,500 Active 54 DOM
-
2026-06-16days on market $19,500 Active 53 DOM
-
2026-06-15days on market $19,500 Active 52 DOM
-
2026-06-14days on market $19,500 Active 50 DOM
-
2026-06-12days on market $19,500 Active 49 DOM
-
2026-06-09days on market $19,500 Active 46 DOM
-
2026-06-08days on market $19,500 Active 45 DOM
-
2026-06-07days on market $19,500 Active 44 DOM
-
2026-06-05days on market $19,500 Active 41 DOM
-
2026-06-03days on market $19,500 Active 40 DOM
-
2026-06-02days on market $19,500 Active 39 DOM
-
2026-06-01pricedays on market $19,500 Active 38 DOM
-
2026-05-31days on market $22,500 Active 37 DOM
-
2026-05-30days on market $22,500 Active 36 DOM
-
2026-04-24$22,500 Active
-
2024-08-30soldstatus $14,000 Closed 24-char remark
Show marketing remark (24 chars)
CASH ONLY BEING SOLD AS.
-
2024-08-07status Pending 24-char remark
Show marketing remark (24 chars)
CASH ONLY BEING SOLD AS.
-
2024-07-25price $20,000 24-char remark
Show marketing remark (24 chars)
CASH ONLY BEING SOLD AS.
-
2024-07-15$34,900 Active 24-char remark
Show marketing remark (24 chars)
CASH ONLY BEING SOLD AS.
ⓘ Source: listings_history table (triggers on properties + properties_extension) + one-shot
backfill from property_details.listing_events for pre-trigger history.
Tax reassessment forecast WV · Resets to sale price
- Current annual tax
- $964 · $80/mo
- Projected year-2 tax
- $964 · $80/mo
- Expected delta
- $0/yr ($0/mo · 0.0%)
ⓘ Screening estimate from a state-policy table — verify with the county assessor before closing.
Climate risk First Street
- Flood 1/10 Low FEMA zone X (unshaded) · 0% chance over 30 yrs
- Wildfire 4/10 Moderate
- Heat 4/10 Moderate 7 d/yr ≥102°F today · 18 d/yr by 30 yrs out
- Wind 2/10 Low 100% chance of damaging wind over 30 yrs
- Air quality 2/10 Low 0 unhealthy d/yr today · 1 by 30 yrs out
Nearby sold comps map
Loading sold comps map…
Walkable amenities ~0.75 mi
Loading nearby amenities…
Taxation est. · year 1
- Rental income
- $11,100
- − Mortgage interest
- −$1,092
- − Property taxes
- −$964
- − Insurance
- −$98
- − Repairs & maintenance
- −$888
- − Management
- −$888
- − Depreciation
- −$567
- Taxable income
- $6,603
- Est. tax owed @ 24.0%
- −$1,585
- After-tax cash flow
- $4,896/yr
For passive investors: Depreciation is non-cash, so a rental often shows a tax loss while cash-flowing — sheltering income. Rental losses are passive: they offset passive income freely, and up to $25,000/yr can offset ordinary (W-2) income if you actively participate and your MAGI is under $100k (phasing out to $0 by $150k); unused losses carry forward. On sale, claimed depreciation is recaptured at up to 25%, and gains may owe capital-gains tax (a 1031 exchange can defer both). Figures are a year-1 estimate at your 24.0% rate — not tax advice; consult a CPA.
Schools (NCES district)
- District
- Cabell County Schools
- NCES district ID
- 5400180
- Math proficiency
- 31% ▼ -7.00%
- Reading proficiency
- 42% ▼ -6.00%
- Median HH income
- $36,426
- Composite
- 30.26/100
- National rank
- #6285
- State rank
- #13 of 55 in WV
Livability — Huntington
- Score
- 79/100
- State rank
- #16
- US rank
- #2045
Category grades
Schools grade is shown separately in the Schools card above.
Census & demographics
- Census place
- Huntington, WV
- City population
- 25,795
- Population (ZIP)
- 20,668
Population outlook (Cabell County) Hauer SSP2
- Today (2025)
- 97,574 people
- By 2030
- 98,060 · +0.5%
- By 2040
- 98,817 · +1.3%
- By 2050
- 100,185 · +2.7%
- By 2075
- 105,895 · +8.5%
- By 2100
- 105,948 · +8.6%
Race, ethnicity, and origin ACS 2023
- Neighborhood character
- Predominantly White (89%)
- Race & ethnicity
- White 89% Black 5% Two or more races 4% Hispanic / Latino 2% Asian 1%
- Common ancestry
- Slovak 3% Serbian 2% Lithuanian 2%
- Foreign-born
- 2%
- Languages at home
- 97% English-only · Spanish 1%
Political lean MEDSL · Cabell
- 2024 margin
- Strong R (+21.9) · D 38.0% · R 59.9% · Other 2.0%
- 2008→2024 swing
- -11.8pp toward R · 2008: -10.1pp · 2024: -21.9pp
- All cycles
- 2024: R+21.9 2020: R+18.0 2016: R+25.5 2012: R+13.9 2008: R+10.1
Not yet ingested
- Civics
- —
Market trends
- HPI YoY
- ▼ -57.08%
- Current HPI
- 171.7797
- Rent YoY
- —
- Metro
- —
- State GDP YoY
- —
- F500 in state
- 0
Price history
-35.5% since first listed5 events — show timeline
- 2026-04-24 Listed $22,500 HBRMLS
- 2024-08-30 Sold (MLS) $14,000 KVBOR
- 2024-08-07 Pending — KVBOR
- 2024-07-25 Price Changed $20,000 KVBOR
- 2024-07-15 Listed $34,900 KVBOR
Property tax history
+8.5%/yrLatest (2025): $964 · +6.4% YoY. Source: county tax records.
Cash-flow waterfall
monthlySold comps — $/sqft
last 12 mo · ≤1 miLoading sold comps…