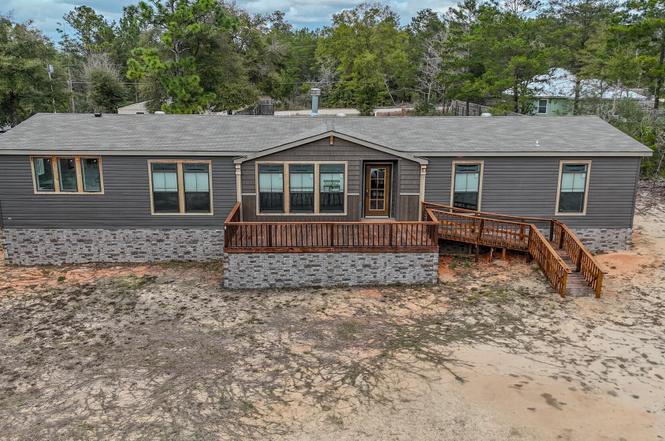
120 Clover Ln · DeFuniak Springs, FL
Flood risk 1/10 · Minimal
- FEMA flood zone
- X (unshaded)
- Chance of flooding over 30 yrs
- 0.0%
- Est. flood insurance / yr
- $507 – $1,088
Fire risk 5/10 · Moderate
- Est. fire insurance / yr
- $947 – $1,759
Heat risk 9/10 · Severe
- Hot days now (above 107°F)
- 7 days/yr
- Hot days in 30 yrs
- 20 days/yr
Wind risk 9/10 · Severe
- Chance of severe wind over 30 yrs
- 99.0%
Air-quality risk 1/10 · Minimal
- Unhealthy air days now
- 0 days/yr
- Unhealthy air days in 30 yrs
- 0 days/yr
Risk factors via First Street. Map © Google.
Why this score? — see what drove the C- grade
The composite is a weighted blend of 9 inputs, each scored 0–100. Each bar is that input's sub-score; the figure is the points it added to the 100-point composite (weight × sub-score).
- Cash flow +12.6/30.0
- Appreciation +10.0/10.0
- ARV discount +7.5/15.0
- Schools +5.2/10.0
- DSCR +3.8/10.0
- 1% rule +3.6/10.0
- Livability +3.2/5.0
- Rent growth +2.5/5.0
- Condition / age +2.5/5.0
$239,900
🖨 Deal sheet (PDF) 📄 Offer letter ✓ Due diligence
Listing remarks
reo. Beautiful 2023 manufactured home on over half an acre - a must see! This 4 bedroom, 3 bathroom home features an open floor plan with a spacious living room and cozy fireplace. The home flows into the dining area and a stunning chef's kitchen with upgraded finishes. The large primary suite includes a walk-in shower, stand-alone soaking tub, and oversized closet with extra storage. Three additional bedrooms and two full bathrooms provide plenty of space. Enjoy a large laundry room with sink and counter space and relax on the front deck overlooking the spacious lot. Ask about zero-down payment options, down payment assistance programs, and lender credits available for qualified buyers.
Key facts
- Open floor plan
- Upgraded finishes
- Walk-in shower
Tags
Property features AI
Finance
- Other: Zoning: County, Mobile Home, Residential Single Family
- Financial info: Details not provided
- HOA & community: Subdivision: Lots 7 & 8 Block 60 Oakwood Hills Unit III
Exterior
- Parking: Details not provided
- Security: Smoke detector(s)
- Utilities: Public water; Septic tank; TV cable available; Electric water heater / electric energy features
- Home design: Manufactured home; Single-story; Built in 2023
- Construction: Shingle roof; Shake siding with vinyl siding and vinyl trim; Built in 2023
- Exterior features: Open deck; Yard building; Located on a cul-de-sac; County road frontage; graded/maintained gravel or oyster shell access
Interior
- Kitchen: Dishwasher; Microwave; Range hood; Kitchen island
- Bedrooms: 4 bedrooms (all on the first floor)
- Flooring: Laminate
- Bathrooms: 3 full bathrooms
- Heating & cooling: Central heating; Central air conditioning; Electric heat controls
- Interior features: Tray ceilings; Fireplace; Kitchen island; Recessed lighting; Washer/Dryer hookup
- Laundry & utility: Washer/Dryer hookup; Electric water heater
Neighborhood map
What this means for you Summary
Snapshot
- This is a 4-bed/3.0-bath manufactured listed at $240k.
Deal economics
- At list price, monthly cash flow is $-30 ($-361/yr) — negative.
- To cash-flow at today's rent, offer at most $236k (1.8% below list).
- To meet the 1% rule (rent ≥ 1% of price), the offer needs to be $206k (14.1% below list).
- Recommended offer: $206k (14.1% below list) — sets the bar for 1% rule.
- Cap rate 6.1% vs local median 4.8% in DeFuniak Springs — meaningfully above typical; check what's discounted (condition, days-on-market, listing class) to confirm the premium yield is real.
Location & tenants
- Location reads 64/100 on livability (#694 in FL) — a middle-class / working-renter tenant base. Strengths: cost of living A+, housing A+; Watch: health & safety C-, crime D, amenities F.
- Walton (rural): math 62% / reading 61% proficiency, ranked #10 of 73 in FL (top 14%) — acceptable for families but not a draw, mixed tenant base, ~2y average lease.
- Zoned schools: Mossy Head School (math 72% / reading 57%, grade B, #525 of 2,144 statewide, top 26%, 439 students, 86% FRL); Emerald Coast Middle School (math 70% / reading 65%, grade A-, #77 of 571 statewide, top 14%, 868 students, 24% FRL); Walton High School (math 52% / reading 53%, grade C-, #154 of 667 statewide, top 24%, 856 students, 65% FRL).
- Market conditions: 423 active listings in the ZIP; 2,883 units permitted in Walton County in 2024 (1,322 in 5+ unit buildings).
- At $2,061/mo this rent would consume 47% of the median local household income ($52k/yr) (locally 356% of renters already pay >50% of income on rent) — very limited rent-growth headroom before tenants either downsize or default.
Forward outlook
- In year one you build about $26k of equity ($2k loan paydown + $24k appreciation (10.0% local appreciation)).
- Walton County population projected at +46% by 2050 — long-run rental-demand tailwind backs the buy-and-hold thesis.
- At projected returns (10.0% appreciation + 3.0% rent growth), your $67k cash investment doubles in ~3 years — after that, you're playing with house money.
- By year 2, paydown + projected appreciation supports a ~$41k cash-out refi (75% LTV) — recoverable capital for the next deal without selling this one.
Negotiation context
- It's been on market 102 days — a 9% lower offer ($218k) is reasonable based on typical stale-listing flexibility.
- 6 sale attempts since 2y ago with the ask held roughly flat each time — persistent listings suggest the price (not the market) is what's stuck; bring a comps-based counter.
Risks & watch-outs
- Climate carrying-cost: severe wind risk, 99% chance of damaging wind over 30y; moderate wildfire risk; extreme-heat days projected 7→20/yr by 2055 (HVAC capex compounding) — expect insurance premiums to compound above CPI over the hold.
Questions for the listing agent
- What do current leases actually rent for vs. the listed asking? Can we see a recent rent roll and the last 12 months of T-12 income?
- It's been on market 102 days. Have you received any prior offers? Is the seller open to a 14% concession, seller financing, or rate buy-down credit?
- Why hasn't it sold? Are there any deal-killer items the seller is aware of (foundation, flood, title, zoning, code violations)?
- Is there a deadline driving the sale (1031 exchange, divorce, estate, relocation)? That informs how much negotiation room exists.
- Schools are D-rated, which usually means shorter tenancies and higher turnover. Who's the typical renter profile here, and what's been the actual vacancy rate?
- Crime grade is D in this area — have there been break-ins, vandalism, or insurance claims at this property in the last 3 years? What carrier currently insures it and at what premium?
- What's the average days-on-market for RENTAL listings here right now (not sales)? A rising rental-DOM trend means longer vacancies and softer asking-rent achievability than the comps imply.
- What's the recent tenant-quality profile in this submarket — average credit score on applications, eviction rate, late-payment / NSF rate, and stable-employment percentage? A property-management company in the area should have these aggregated.
- How much new for-sale + rental construction is in the pipeline within 1–3 miles? Heavy new supply typically softens prices + rents 12–24 months out; constrained supply supports both.
Investment metrics
- 1% rule
- 0.86% ✗
- Cap rate
- 6.14%
- Cash-on-cash
- -0.54%
- DSCR
- 0.98
- GRM
- 9.7
CMA / ARV
No comps found within radius.
Projected returns pro-forma
10.0% appreciation · 3.0% rent growth · sell at horizon
- IRR
- 23.9%
- Equity multiple
- 2.92×
- Total profit
- $128,772
- Equity at exit
- $216,121
- IRR
- 21.2%
- Equity multiple
- 6.67×
- Total profit
- $380,781
- Equity at exit
- $466,073
Cash invested: $67,172 (down + closing). Projections, not guarantees.
Landlord ↔ Tenant lean methodology
- Overall (STATE)
- 87 Strongly Landlord-Friendly
- State Florida
- 87 Strongly Landlord-Friendly · R+3
- County
- — inherits STATE
- City
- — inherits STATE
ZIP-level market 32433
- Home prices YoY
- 4.2%
- Active inventory
- 423
- Price-to-rent
- 9.7×
Monthly cashflow live
- Estimated rent
- $2,061 medium interval (Pro) →
- Mortgage (P&I)
- −$1,258
- Tax est. 1.5%
- −$300 /mo · $3,598/yr
- Insurance
- −$100
- HOA
- −$0
- Vacancy / Maint / Mgmt
- −$433
- Net cashflow
- $-30
Break-even live
Sensitivity live
| Price | -10% $136 | -5% $53 | +0% $-30 | +5% $-113 | +10% $-196 |
|---|---|---|---|---|---|
| Rent | -10% $-193 | -5% $-111 | +0% $-30 | +5% $51 | +10% $133 |
| Rate | -1.0pp $91 | -0.5pp $31 | base $-30 | +0.5pp $-92 | +1.0pp $-155 |
UW: 25.0% down · 7.5% · 30yr · 1.5% tax · 5.0% vac · 8.0% maint · 8.0% mgmt
Financing live
Cash to close
- Down payment
- $59,975
- Closing costs
- $7,197
- Reserves months
- —
- Total cash needed
- —
Loan-product check · same deal, 3 products live
Conventional
25% down · 7.5% · 30yr
- Down + closing
- —
- Monthly P&I
- —
- Monthly cashflow
- —
- DSCR
- —
- Eligible?
- —
Personal DTI + credit; lowest rate.
DSCR
20% down · 8.5% · 30yr
- Down + closing
- —
- Monthly P&I
- —
- Monthly cashflow
- —
- DSCR
- —
- Eligible?
- —
No personal income docs; deal must DSCR.
Hard money
10% down · 12.0% · 12mo
- Down + closing
- —
- Monthly P&I
- —
- Monthly cashflow
- —
- DSCR
- —
- Eligible?
- —
Short-term bridge; refi at stabilization.
Listing history 36 events
-
2026-06-21statusdays on market $239,900 Pending 102 DOM
-
2026-06-18days on market $239,900 Active 101 DOM
-
2026-06-17days on market $239,900 Active 100 DOM
-
2026-06-16days on market $239,900 Active 99 DOM
-
2026-06-15days on market $239,900 Active 98 DOM
-
2026-06-14days on market $239,900 Active 96 DOM
-
2026-06-13days on market $239,900 Active 95 DOM
-
2026-06-10days on market $239,900 Active 93 DOM
-
2026-06-09days on market $239,900 Active 92 DOM
-
2026-06-08days on market $239,900 Active 91 DOM
-
2026-06-07days on market $239,900 Active 90 DOM
-
2026-06-05days on market $239,900 Active 87 DOM
-
2026-06-03days on market $239,900 Active 86 DOM
-
2026-06-03days on market $239,900 Active 85 DOM
-
2026-06-01days on market $239,900 Active 84 DOM
-
2026-05-31days on market $239,900 Active 83 DOM
-
2026-05-30days on market $239,900 Active 82 DOM
-
2026-04-20price $239,900
-
2026-03-09$249,900 Active
-
2025-12-04status Active
-
2025-10-23status Active
-
2025-10-17status Pending
-
2025-10-02price $249,000
-
2025-09-05price $250,000
-
2025-07-28status Active
-
2025-07-08price $270,000
-
2025-06-24price $290,000
-
2025-05-27price $295,000
-
2025-05-23price $295,900
-
2025-05-23status Active
-
2025-04-21price $299,900
-
2025-01-23price $305,000
-
2024-12-03price $309,900
-
2024-11-13price $319,500
-
2024-09-25price $329,500
-
2024-07-29$337,500 Active
ⓘ Source: listings_history table (triggers on properties + properties_extension) + one-shot
backfill from property_details.listing_events for pre-trigger history.
Climate risk First Street
- Flood 1/10 Low FEMA zone X (unshaded) · 0% chance over 30 yrs
- Wildfire 5/10 Major
- Heat 9/10 Extreme 7 d/yr ≥107°F today · 20 d/yr by 30 yrs out
- Wind 9/10 Extreme 99% chance of damaging wind over 30 yrs
- Air quality 1/10 Low 0 unhealthy d/yr today · 0 by 30 yrs out
Nearby sold comps map
Loading sold comps map…
Walkable amenities ~0.75 mi
Loading nearby amenities…
Taxation est. · year 1
- Rental income
- $24,727
- − Mortgage interest
- −$13,438
- − Property taxes
- −$3,598
- − Insurance
- −$1,200
- − Repairs & maintenance
- −$1,978
- − Management
- −$1,978
- − Depreciation
- −$6,979
- Taxable loss
- −$4,445
- Est. tax savings @ 24.0%
- +$1,067
- After-tax cash flow
- $706/yr
For passive investors: Depreciation is non-cash, so a rental often shows a tax loss while cash-flowing — sheltering income. Rental losses are passive: they offset passive income freely, and up to $25,000/yr can offset ordinary (W-2) income if you actively participate and your MAGI is under $100k (phasing out to $0 by $150k); unused losses carry forward. On sale, claimed depreciation is recaptured at up to 25%, and gains may owe capital-gains tax (a 1031 exchange can defer both). Figures are a year-1 estimate at your 24.0% rate — not tax advice; consult a CPA.
Schools (NCES district)
- District
- Walton
- NCES district ID
- 1201980
- Math proficiency
- 62% ▼ -4.00%
- Reading proficiency
- 61% ▼ -2.00%
- Median HH income
- $46,794
- Composite
- 52.03/100
- National rank
- #1634
- State rank
- #10 of 73 in FL
Livability — DeFuniak Springs
- Score
- 64/100
- State rank
- #694
- US rank
- #14475
Category grades
Schools grade is shown separately in the Schools card above.
Census & demographics
- County
- Walton County · 70,839 people
- City population
- 19,746
- Metro
- Crestview-Fort Walton Beach-Destin, FL
- Population (ZIP)
- 19,746
- Household income
- $52,199
- Rent vs Own
- Severe rent burden
- 356.0
Population outlook (Walton County) Hauer SSP2
- Today (2025)
- 80,014 people
- By 2030
- 88,120 · +10.1%
- By 2040
- 103,537 · +29.4%
- By 2050
- 117,034 · +46.3%
- By 2075
- 143,901 · +79.8%
- By 2100
- 155,138 · +93.9%
Race, ethnicity, and origin ACS 2023
- Neighborhood character
- Predominantly White (75%)
- Race & ethnicity
- White 75% Black 10% Hispanic / Latino 8% Two or more races 7% Native American 1%
- Hispanic origin (detail)
- Mexican 5%
- Common ancestry
- Slovak 3% Italian 2% Lithuanian 2%
- Foreign-born
- 6% · Canada
- Languages at home
- 92% English-only · Spanish 4% Other Indo-European 1% French/Haitian/Cajun 1%
Political lean MEDSL · Walton
- 2024 margin
- Solid R (+57.8) · D 20.7% · R 78.6%
- 2008→2024 swing
- -12.0pp toward R · 2008: -45.8pp · 2024: -57.8pp
- All cycles
- 2024: R+57.8 2020: R+51.7 2016: R+56.1 2012: R+52.0 2008: R+45.8
Not yet ingested
- Civics
- —
Market trends
- HPI YoY
- ▲ 14.77%
- Current HPI
- 367.046
- Rent YoY
- —
- Metro
- Crestview-Fort Walton Beach-Destin, FL
- State GDP YoY
- ▲ 3.28%
- F500 in state
- 36
Industry mix (Fortune 500 HQ in FL)
| Industry | F500 HQs | Revenue |
|---|---|---|
| Industrial Technology | 2 | $29B |
|
||
| Insurance | 2 | $17B |
|
||
| Retail | 1 | $60B |
|
||
| Technology Distribution | 1 | $58B |
|
||
| Homebuilding | 1 | $35B |
|
||
| Technology Manufacturing | 1 | $35B |
|
||
Price history
-28.9% since first listed19 events — show timeline
- 2026-04-20 Price Changed $239,900 ECAR
- 2026-03-09 Listed $249,900 ECAR
- 2025-12-04 Relisted — ECAR
- 2025-10-23 Relisted — ECAR
- 2025-10-17 Pending — ECAR
- 2025-10-02 Price Changed $249,000 ECAR
- 2025-09-05 Price Changed $250,000 ECAR
- 2025-07-28 Relisted — ECAR
- 2025-07-08 Price Changed $270,000 ECAR
- 2025-06-24 Price Changed $290,000 ECAR
- 2025-05-27 Price Changed $295,000 ECAR
- 2025-05-23 Price Changed $295,900 ECAR
- 2025-05-23 Relisted — ECAR
- 2025-04-21 Price Changed $299,900 ECAR
- 2025-01-23 Price Changed $305,000 ECAR
- 2024-12-03 Price Changed $309,900 ECAR
- 2024-11-13 Price Changed $319,500 ECAR
- 2024-09-25 Price Changed $329,500 ECAR
- 2024-07-29 Listed $337,500 ECAR
Cash-flow waterfall
monthlySold comps — $/sqft
last 12 mo · ≤1 miLoading sold comps…