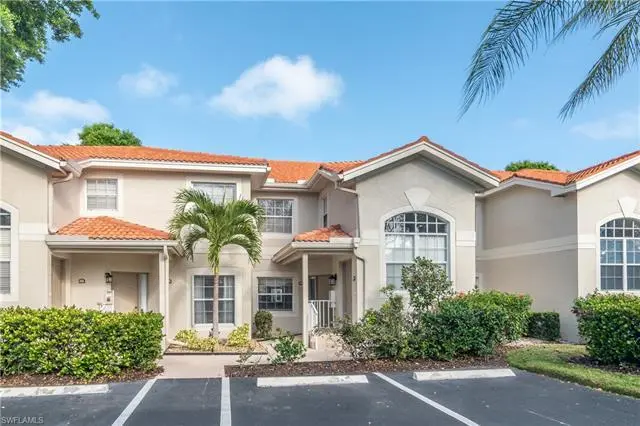
2585 Old Groves Rd Unit L102 · Pelican Marsh, FL
Flood risk 3/10 · Minor
- FEMA flood zone
- X (unshaded)
- Chance of flooding over 30 yrs
- 0.09%
- Est. flood insurance / yr
- $507 – $1,088
Fire risk 1/10 · Minimal
- Est. fire insurance / yr
- $947 – $1,759
Heat risk 10/10 · Severe
- Hot days now (above 107°F)
- 7 days/yr
- Hot days in 30 yrs
- 27 days/yr
Wind risk 10/10 · Severe
- Chance of severe wind over 30 yrs
- 99.0%
Air-quality risk 2/10 · Minimal
- Unhealthy air days now
- 2 days/yr
- Unhealthy air days in 30 yrs
- 2 days/yr
Risk factors via First Street. Map © Google.
Why this score? — see what drove the C grade
The composite is a weighted blend of 9 inputs, each scored 0–100. Each bar is that input's sub-score; the figure is the points it added to the 100-point composite (weight × sub-score).
- Cash flow +17.1/30.0
- 1% rule +7.6/10.0
- ARV discount +7.5/15.0
- DSCR +5.3/10.0
- Appreciation +5.1/10.0
- Schools +5.0/10.0
- Condition / age +3.8/5.0
- Rent growth +2.7/5.0
- Livability +2.5/5.0
$350,000
🖨 Deal sheet (PDF) 📄 Offer letter ✓ Due diligence
Listing remarks
LOCATION! LOCATION! Discover happiness living in North Naples within this delightful 2-bedroom, 2-bathroom pretty lake-view condo. Conveniently positioned near the second pool and residence gate, this unit provides pleasure and comfort, complete with a carport space and extra front parking. Many desirable features, including a newer AC unit from 2019, updated tile roofs, granite countertops in both bathrooms, and a refreshed kitchen tile, impact glass windows & sliders; this condo offers a touch of modern elegance. The kitchen is a standout, featuring a stylish updated glass backsplash. Embrace the serene lake views from the screened lanai, equipped with sliding glass doors that all
Key facts
- Newer ac unit
- Impact glass windows
- Lake view
Tags
Property features AI
Finance
- Other: Condo complex with 388 units; 8 units in building; 2 floors in building; unit is one of the floor plan; Development: PIPERS GROVE; Zoning: RMF; Lot unit: 102; Restrictions include deeded restrictions (no commercial, no motorcycles, no RV); Waterfront: lake
- HOA & community: Mandatory HOA; Quarterly HOA fee; HOA covers cable, insurance, internet/Wi-Fi, irrigation water, lawn/land maintenance, legal/accounting, exterior pest control, recreation facilities, sewer, street lights, and trash removal; Professional management; Community amenities include clubhouse, community pool, spa/hot tub, tennis courts, bocce court, cabana, BBQ/picnic area, bike and jog path, library, sidewalks, and underground utilities; Gated condo community with tennis; Total annual recurring fees listed
Exterior
- Parking: 1 assigned covered space (deeded); Detached 1-car carport; Guest parking available
- Security: Gated community access
- Utilities: Central water; Central sewer; Cable available; Central electric power
- Home design: Residential low-rise building (1–3 stories); 2-story building; Rear (west) exposure; Zero lot line
- Construction: Concrete block construction; Tile roof; Built in 1996
- Exterior features: Automatic sprinkler system; Lakefront water view; Water display/feature; Single-hung windows; Impact-resistant windows; Stucco exterior; Gated community
Interior
- Kitchen: Dishwasher; Disposal; Microwave; Refrigerator/Freezer; Pantry
- Bedrooms: 2 bedrooms; Master bedroom on ground level; Split bedroom floor plan
- Flooring: Carpet; Tile
- Bathrooms: 2 full bathrooms; Master bath with dual sinks and shower (no tub)
- Heating & cooling: Central electric heat; Central electric air conditioning
- Interior features: Cable pre-wired; Fire sprinkler system; Pantry; Smoke detectors; Walk-in closet; Window coverings; Dining area (in living room); Screened lanai/porch; Turnkey furnished
- Laundry & utility: Washer and dryer in residence
Neighborhood map
What this means for you Summary
Snapshot
- This is a 2-bed/2.0-bath condo listed at $350k. Condition is rated good.
Deal economics
- At list price, monthly cash flow is $241 ($3k/yr) — positive.
- The deal already cash-flows at list — no discount required.
- Meets the 1% rule at list price ($4k rent vs $350k).
- Recommended offer: $329k (6.0% below list) — sets the bar for market timing.
Location & tenants
- Location reads: area grade C — affects rentability + tenant quality, not the cash-flow math above.
- Collier (suburban): math 60% / reading 56% proficiency, ranked #16 of 73 in FL (top 22%) — acceptable for families but not a draw, mixed tenant base, ~2y average lease.
- Zoned schools: Pelican Marsh Elementary School (math 87% / reading 83%, grade A+, #35 of 2,144 statewide, top 2%, 709 students, 29% FRL); Pine Ridge Middle School (math 74% / reading 70%, grade A, #52 of 571 statewide, top 10%, 832 students, 31% FRL); Barron Collier High School (math 62% / reading 68%, grade B, #76 of 667 statewide, top 11%, 1,650 students, 26% FRL) — zoned schools average 29% FRL vs 55% district-wide (26 pts lower); this property's tenant base skews higher-income than the district average.
- Zoned-school proficiency averages 74% at this address vs 58% district-wide (+16 pts) — the actual schools serving this property are materially stronger than the Collier average implies; a family-tenant draw the district grade alone would hide.
- Market conditions: Rents flat; 424 active listings in the ZIP; 40 comparable units currently listed for rent nearby; rentals at typical pace (median 16d on market — plan ~3-4 weeks tenant-placement turnaround); solid renter incomes; 3,520 units permitted in Collier County in 2024 (959 in 5+ unit buildings).
- At $4,420/mo this rent would consume 57% of the median local household income ($92k/yr) (locally 1712% of renters already pay >50% of income on rent) — very limited rent-growth headroom before tenants either downsize or default.
Forward outlook
- In year one you build about $3k of equity ($2k loan paydown + $1k appreciation (0.3% local appreciation)).
- Collier County population projected at +30% by 2050 — long-run rental-demand tailwind backs the buy-and-hold thesis.
- By year 8, paydown + projected appreciation supports a ~$32k cash-out refi (75% LTV) — recoverable capital for the next deal without selling this one.
Negotiation context
- It's been on market 89 days — a 6% lower offer ($329k) is reasonable based on typical stale-listing flexibility.
Risks & watch-outs
- Climate carrying-cost: severe wind risk, 99% chance of damaging wind over 30y; extreme-heat days projected 7→27/yr by 2055 (HVAC capex compounding) — expect insurance premiums to compound above CPI over the hold.
Questions for the listing agent
- It's been on market 89 days. Have you received any prior offers? Is the seller open to a 6% concession, seller financing, or rate buy-down credit?
- What does the HOA fee cover, when was the last increase, and are there any pending special assessments or reserve-fund shortfalls?
- Any open or pending special assessments — roof, HVAC, plumbing, elevator, façade? What's the per-unit balance and payoff schedule, and is the seller paying it off at close or rolling it to the buyer?
- Why hasn't it sold? Are there any deal-killer items the seller is aware of (foundation, flood, title, zoning, code violations)?
- Is there a deadline driving the sale (1031 exchange, divorce, estate, relocation)? That informs how much negotiation room exists.
- What's the average days-on-market for RENTAL listings here right now (not sales)? A rising rental-DOM trend means longer vacancies and softer asking-rent achievability than the comps imply.
- What's the recent tenant-quality profile in this submarket — average credit score on applications, eviction rate, late-payment / NSF rate, and stable-employment percentage? A property-management company in the area should have these aggregated.
- How much new apartment / multifamily construction is in the pipeline within 1–3 miles? Heavy new supply (>2% of stock underway) typically softens rents 12–24 months out; light construction supports rent growth.
Investment metrics
- 1% rule
- 1.26% ✓
- Cap rate
- 7.12%
- Cash-on-cash
- 2.95%
- DSCR
- 1.13
- GRM
- 6.6
CMA / ARV
No comps found within radius.
Projected returns pro-forma
0.29% appreciation · 0.92% rent growth · sell at horizon
- IRR
- 0.3%
- Equity multiple
- 1.02×
- Total profit
- $1,508
- Equity at exit
- $106,821
- IRR
- 3.8%
- Equity multiple
- 1.40×
- Total profit
- $39,260
- Equity at exit
- $132,623
Cash invested: $98,000 (down + closing). Projections, not guarantees.
Landlord ↔ Tenant lean methodology
- Overall (STATE)
- 87 Strongly Landlord-Friendly
- State Florida
- 87 Strongly Landlord-Friendly · R+3
- County
- — inherits STATE
- City
- — inherits STATE
ZIP-level market 34109
- Home prices YoY
- 0.1%
- Rents YoY
- 0.9%
- Active inventory
- 424
- Price-to-rent
- 6.6×
Monthly cashflow live
- Estimated rent
- $4,420 high interval (Pro) →
- Mortgage (P&I)
- −$1,835
- Tax est. 1.5%
- −$438 /mo · $5,250/yr
- Insurance
- −$146
- HOA
- −$832
- Vacancy / Maint / Mgmt
- −$928
- Net cashflow
- $241
Break-even live
Sensitivity live
| Price | -10% $483 | -5% $362 | +0% $241 | +5% $120 | +10% $-1 |
|---|---|---|---|---|---|
| Rent | -10% $-108 | -5% $66 | +0% $241 | +5% $416 | +10% $590 |
| Rate | -1.0pp $417 | -0.5pp $330 | base $241 | +0.5pp $150 | +1.0pp $58 |
UW: 25.0% down · 7.5% · 30yr · 1.5% tax · 5.0% vac · 8.0% maint · 8.0% mgmt
Financing live
Cash to close
- Down payment
- $87,500
- Closing costs
- $10,500
- Reserves months
- —
- Total cash needed
- —
Loan-product check · same deal, 3 products live
Conventional
25% down · 7.5% · 30yr
- Down + closing
- —
- Monthly P&I
- —
- Monthly cashflow
- —
- DSCR
- —
- Eligible?
- —
Personal DTI + credit; lowest rate.
DSCR
20% down · 8.5% · 30yr
- Down + closing
- —
- Monthly P&I
- —
- Monthly cashflow
- —
- DSCR
- —
- Eligible?
- —
No personal income docs; deal must DSCR.
Hard money
10% down · 12.0% · 12mo
- Down + closing
- —
- Monthly P&I
- —
- Monthly cashflow
- —
- DSCR
- —
- Eligible?
- —
Short-term bridge; refi at stabilization.
Rent comps 40 comps
| Address | Beds | Baths | Sqft | Rent | $/sqft | DOM | Units | Dist |
|---|---|---|---|---|---|---|---|---|
| 2585 Old Groves Rd Unit L203 Naples, FL | 2.0 | 2.0 | 1448 | $5,500 | $3.80 | 15d | 1 | 0.03mi |
| 7762 Gardner Dr #102 Naples, FL | 2.0 | 2.0 | 1607 | $6,000 | $3.73 | 25d | 1 | 0.09mi |
| 7518 Silver Trumpet Ln Unit Q102 Naples, FL | 2.0 | 2.0 | 1300 | $2,600 | $2.00 | 15d | 1 | 0.12mi |
| 2516 Orchid Bay Dr #203 Naples, FL | 2.0 | 2.0 | 1360 | $4,750 | $3.49 | 25d | 1 | 0.17mi |
| 7822 Gardner Dr Unit 6-101 Naples, FL | 2.0 | 2.0 | 1607 | $2,500 | $1.56 | 25d | 1 | 0.29mi |
| 2835 Mizzen Way Naples, FL | 3.0 | 2.0 | 1641 | $2,900 | $1.77 | 25d | 1 | 0.30mi |
| 2460 Old Groves Rd Unit E102 Naples, FL | 2.0 | 2.0 | 1226 | $2,400 | $1.96 | 15d | 1 | 0.31mi |
| 7416 Plumbago Bridge Rd #103 Naples, FL | 2.0 | 2.0 | 1223 | $2,400 | $1.96 | 15d | 1 | 0.33mi |
| 2730 Sailors Way Naples, FL | 3.0 | 3.0 | 1700 | $9,000 | $5.29 | 25d | 1 | 0.35mi |
| 2864 Mizzen Way Unit Y106 Naples, FL | 2.0 | 2.0 | 1350 | $5,200 | $3.85 | 15d | 1 | 0.35mi |
| 7710 Ahoy Ave Naples, FL | 3.0 | 2.0 | 1580 | $2,950 | $1.87 | 25d | 1 | 0.36mi |
| 2729 Branch Ln Naples, FL | 3.0 | 2.0 | 1800 | $3,650 | $2.03 | 25d | 1 | 0.40mi |
| 2662 Bolero Dr Unit 10 Naples, FL | 2.0 | 2.0 | 1768 | $15,000 | $8.48 | 25d | 1 | 0.42mi |
| 2885 Citrus Lake Dr Unit N103 Naples, FL | 2.0 | 2.0 | 1249 | $5,250 | $4.20 | 15d | 1 | 0.42mi |
| 2608 Sailors Way #122 Naples, FL | 2.0 | 2.0 | 1387 | $5,500 | $3.97 | 25d | 1 | 0.45mi |
| 2654 Bolero Dr Unit 8-1 Naples, FL | 3.0 | 2.0 | 1768 | $20,000 | $11.31 | 25d | 1 | 0.45mi |
| 2625 Estrella Dr Unit 15-1 Naples, FL | 3.0 | 2.0 | 1768 | $18,000 | $10.18 | 25d | 1 | 0.45mi |
| 2860 Citrus Lake Dr Unit R202 Naples, FL | 3.0 | 2.0 | 1590 | $5,000 | $3.14 | 25d | 1 | 0.54mi |
| 2860 Citrus Lake Dr Unit R-202 Naples, FL | 3.0 | 2.0 | 1590 | $5,000 | $3.14 | 15d | 1 | 0.54mi |
| 3048 Horizon Ln #1104 Naples, FL | 3.0 | 2.5 | 1818 | $5,150 | $2.83 | 25d | 1 | 0.54mi |
| 2880 Citrus Lake Dr Unit Q201 Naples, FL | 3.0 | 2.0 | 1590 | $2,495 | $1.57 | 15d | 1 | 0.55mi |
| 2731 Citrus Lake Dr #202 Naples, FL | 2.0 | 2.0 | 1260 | $2,500 | $1.98 | 15d | 1 | 0.56mi |
| 2711 Citrus Lake Dr Unit F305 Naples, FL | 3.0 | 2.0 | 1480 | $5,500 | $3.72 | 15d | 1 | 0.56mi |
| 2711 Citrus Lake Dr Unit F302 Naples, FL | 2.0 | 2.0 | 1272 | $4,500 | $3.54 | 15d | 1 | 0.56mi |
| 2671 Citrus Lake Dr Unit E-201 Naples, FL | 3.0 | 2.0 | 1380 | $5,250 | $3.80 | 15d | 1 | 0.56mi |
| 2671 Citrus Lake Dr Unit E-303 Naples, FL | 2.0 | 2.0 | 1380 | $3,500 | $2.54 | 15d | 1 | 0.56mi |
| 3051 Horizon Ln #1803 Naples, FL | 2.0 | 2.0 | 1482 | $5,100 | $3.44 | 25d | 1 | 0.58mi |
| 2738 Tiburon Blvd E Unit B405 Naples, FL | 2.0 | 2.5 | 1865 | $12,000 | $6.43 | 15d | 1 | 0.58mi |
| 2651 Citrus Lake Dr Unit D302 Naples, FL | 2.0 | 2.0 | 1250 | $5,000 | $4.00 | 15d | 1 | 0.60mi |
| 3062 Driftwood Way #4301 Naples, FL | 3.0 | 2.0 | 1573 | $6,500 | $4.13 | 25d | 1 | 0.60mi |
| 3320 Bermuda Isle Cir Naples, FL | 1.0–3.0 | 1.0–2.0 | 1134 | $2,390 | $2.11 | 15d | 45 | 0.62mi |
| 2611 Citrus Lake Dr Unit C-203 Naples, FL | 3.0 | 2.0 | 1710 | $5,500 | $3.22 | 15d | 1 | 0.62mi |
| 3015 Horizon Ln #2702 Naples, FL | 3.0 | 2.0 | 1399 | $1,790 | $1.28 | 25d | 1 | 0.63mi |
| 2541 Citrus Lake Dr Unit A-205 Naples, FL | 3.0 | 2.0 | 1590 | $5,250 | $3.30 | 15d | 1 | 0.63mi |
| 3035 Horizon Ln #2206 Naples, FL | 2.0 | 2.0 | 1246 | $6,000 | $4.82 | 25d | 1 | 0.64mi |
| 2728 Tiburon Blvd E Naples, FL | 2.0–3.0 | 2.5–3.5 | 2425 | $4,500 | $1.86 | 15d | 3 | 0.64mi |
| 2728 Tiburon Blvd E Unit A-104 Naples, FL | 2.0 | 2.0 | 1465 | $12,500 | $8.53 | 15d | 1 | 0.65mi |
| 2728 Tiburon Blvd E Unit A-203 Naples, FL | 2.0 | 2.0 | 1465 | $11,000 | $7.51 | 15d | 1 | 0.65mi |
| 2728 Tiburon Blvd E Unit A204 Naples, FL | 2.0 | 2.0 | 1470 | $8,500 | $5.78 | 15d | 1 | 0.65mi |
| 2748 Tiburon Blvd E Unit C202 Naples, FL | 2.0 | 2.5 | 1865 | $15,000 | $8.04 | 15d | 1 | 0.65mi |
HOA detail condo
- Monthly dues
- $832 · $9,984/yr
- Likely covers
- pool
- Assessments
- None detected in remarks — confirm with the listing agent.
Listing history 13 events
-
2026-06-21days on market $350,000 Active 89 DOM
-
2026-06-18days on market $350,000 Active 86 DOM
-
2026-06-17days on market $350,000 Active 85 DOM
-
2026-06-16days on market $350,000 Active 84 DOM
-
2026-06-15days on market $350,000 Active 83 DOM
-
2026-06-14days on market $350,000 Active 81 DOM
-
2026-06-10days on market $350,000 Active 78 DOM
-
2026-06-09days on market $350,000 Active 77 DOM
-
2026-06-08days on market $350,000 Active 76 DOM
-
2026-06-07days on market $350,000 Active 75 DOM
-
2026-06-03days on market $350,000 Active 71 DOM
-
2026-06-03remarks 695-char remark
-
2026-06-03$350,000 Active 70 DOM
ⓘ Source: listings_history table (triggers on properties + properties_extension) + one-shot
backfill from property_details.listing_events for pre-trigger history.
Climate risk First Street
- Flood 3/10 Moderate FEMA zone X (unshaded) · 9% chance over 30 yrs
- Wildfire 1/10 Low
- Heat 10/10 Extreme 7 d/yr ≥107°F today · 27 d/yr by 30 yrs out
- Wind 10/10 Extreme 99% chance of damaging wind over 30 yrs
- Air quality 2/10 Low 2 unhealthy d/yr today · 2 by 30 yrs out
Nearby sold comps map
Loading sold comps map…
Walkable amenities ~0.75 mi
Loading nearby amenities…
Taxation est. · year 1
- Rental income
- $53,040
- − Mortgage interest
- −$19,605
- − Property taxes
- −$5,250
- − Insurance
- −$1,750
- − Repairs & maintenance
- −$4,243
- − Management
- −$4,243
- − HOA
- −$9,984
- − Depreciation
- −$10,182
- Taxable loss
- −$2,218
- Est. tax savings @ 24.0%
- +$532
- After-tax cash flow
- $3,425/yr
For passive investors: Depreciation is non-cash, so a rental often shows a tax loss while cash-flowing — sheltering income. Rental losses are passive: they offset passive income freely, and up to $25,000/yr can offset ordinary (W-2) income if you actively participate and your MAGI is under $100k (phasing out to $0 by $150k); unused losses carry forward. On sale, claimed depreciation is recaptured at up to 25%, and gains may owe capital-gains tax (a 1031 exchange can defer both). Figures are a year-1 estimate at your 24.0% rate — not tax advice; consult a CPA.
Condition & rehab AI · 13 photos
This well-maintained 2-bedroom, 2-bathroom condo offers a serene lake view and modern updates, making it an attractive option for both resale and rental.
Value-add opportunities
- Resale Paint touch-ups — Fresh paint enhances curb appeal and can increase the home's value.
- Rental Landscaping improvements — Well-maintained landscaping can attract more renters and increase rental value.
Renovation cost estimate screening
Value-add ROI direction
- Resale Paint touch-ups — Fresh paint enhances curb appeal and can increase the home's value. ↑
- Rental Landscaping improvements — Well-maintained landscaping can attract more renters and increase rental value. ↑
ⓘ Cost ranges are severity-bucket heuristics (US national rule-of-thumb). Get contractor quotes + a written scope before underwriting a rehab budget.
Schools (NCES district)
- District
- Collier
- NCES district ID
- 1200330
- Math proficiency
- 60% ▼ -4.00%
- Reading proficiency
- 56% ▼ -2.00%
- Median HH income
- $58,275
- Composite
- 50.23/100
- National rank
- #1892
- State rank
- #16 of 73 in FL
Livability — Pelican Marsh
No livability data for this city. (Only ~50 U.S. cities are tracked.)
Census & demographics
- County
- Collier County · 396,295 people
- Metro
- Naples-Marco Island, FL
- Population (ZIP)
- 27,273
- Household income
- $92,259
- Rent vs Own
- Severe rent burden
- 1712.0
Population outlook (Collier County) Hauer SSP2
- Today (2025)
- 420,858 people
- By 2030
- 450,054 · +6.9%
- By 2040
- 502,232 · +19.3%
- By 2050
- 544,932 · +29.5%
- By 2075
- 627,203 · +49.0%
- By 2100
- 659,015 · +56.6%
Race, ethnicity, and origin ACS 2023
- Neighborhood character
- Predominantly White (78%)
- Race & ethnicity
- White 78% Hispanic / Latino 11% Two or more races 9% Black 4% Asian 4%
- Hispanic origin (detail)
- Mexican 1% Puerto Rican 1% Cuban 3%
- Common ancestry
- Romanian 5% Scotch-Irish 3% Lithuanian 2%
- Foreign-born
- 20% · Canada, Jamaica, Vietnam
- Languages at home
- 77% English-only · Spanish 10% Other Indo-European 5% Russian/Polish/Slavic 3%
Political lean MEDSL · Collier
- 2024 margin
- Solid R (+33.1) · D 33.1% · R 66.2%
- 2008→2024 swing
- -10.6pp toward R · 2008: -22.5pp · 2024: -33.1pp
- All cycles
- 2024: R+33.1 2020: R+24.7 2016: R+26.0 2012: R+30.1 2008: R+22.5
Not yet ingested
- Civics
- —
Market trends
- HPI YoY
- ▲ 0.29%
- Current HPI
- 279.357
- Rent YoY
- ▲ 0.92%
- Metro
- Naples-Marco Island, FL
- State GDP YoY
- ▲ 3.28%
- F500 in state
- 36
Industry mix (Fortune 500 HQ in FL)
| Industry | F500 HQs | Revenue |
|---|---|---|
| Industrial Technology | 2 | $29B |
|
||
| Insurance | 2 | $17B |
|
||
| Retail | 1 | $60B |
|
||
| Technology Distribution | 1 | $58B |
|
||
| Homebuilding | 1 | $35B |
|
||
| Technology Manufacturing | 1 | $35B |
|
||
Price history
1 event — show timeline
- 2026-03-24 Listed $350,000 NAPLESMLS
Cash-flow waterfall
monthlySold comps — $/sqft
last 12 mo · ≤1 miLoading sold comps…