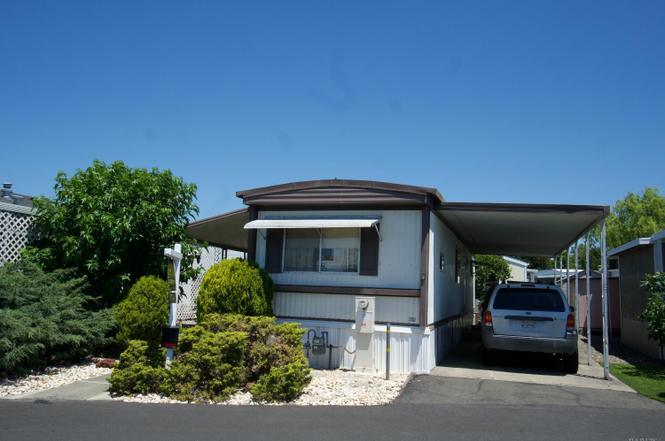
159 Apple Ln · Santa Rosa, CA
Flood risk 1/10 · Minimal
- FEMA flood zone
- X (unshaded)
- Chance of flooding over 30 yrs
- 0.0%
- Est. flood insurance / yr
- $507 – $1,088
Fire risk 6/10 · Moderate
- Est. fire insurance / yr
- $659 – $1,223
Heat risk 4/10 · Minor
- Hot days now (above 92°F)
- 7 days/yr
- Hot days in 30 yrs
- 16 days/yr
Wind risk 1/10 · Minimal
- Chance of severe wind over 30 yrs
- —
Air-quality risk 8/10 · Major
- Unhealthy air days now
- 15 days/yr
- Unhealthy air days in 30 yrs
- 17 days/yr
Risk factors via First Street. Map © Google.
Why this score? — see what drove the D+ grade
The composite is a weighted blend of 9 inputs, each scored 0–100. Each bar is that input's sub-score; the figure is the points it added to the 100-point composite (weight × sub-score).
- Cash flow +15.0/30.0
- ARV discount +7.5/15.0
- 1% rule +5.0/10.0
- DSCR +5.0/10.0
- Livability +3.8/5.0
- Schools +3.7/10.0
- Rent growth +3.2/5.0
- Condition / age +2.2/5.0
- Appreciation +0.0/10.0
$45,000
🖨 Deal sheet 📄 Offer letter ✓ Due diligence
Listing remarks
Welcome Home to 159 Apple Lane, a single wide mobile home conveniently located in Mountain View Estates, an All Age Park on Santa Rosa Avenue near markets, restaurants, and shops. This inviting home features 1 bedroom in the back of the unit with a full bath next to it, and a living room open to the kitchen. It comes furnished with a kitchen table/chairs, a living room sofa, chairs and TV. The bedroom comes with a bed, dressers, and some built in drawers. All you need to do is buy the home and move in! What a great deal! The space rent is cheaper than an apartment! This home boasts 600 sq. ft. of usable living space plus a 2 car carport and a shed. Buyers need to get Park Approval.
Key facts
- 2 car carport
- Shed
- Full bath
Tags
Property features AI
Finance
- Other: Located in Mountain View Estates (park name)
- Financial info: Land lease in place; current land lease amount $1,260
- HOA & community: No association; Not a senior community
Exterior
- Parking: Attached covered parking for 2
- Utilities: Individual electric meter; Individual gas meter; Public sewer; Internet available
- Home design: Manufactured in-park home; Single-wide; Skyline manufacturer; Skirted
- Construction: Updated/remodeled condition
- Exterior features: Covered, railed deck; Shed on property; Close to clubhouse
Interior
- Kitchen: Disposal; Free-standing gas range; Free-standing refrigerator; Range hood; Microwave; Kitchen and dining space combined
- Bedrooms: 1 bedroom
- Flooring: Carpet; Linoleum
- Bathrooms: 1 full bathroom with tub/shower over
- Heating & cooling: Central heating; Evaporative cooler
- Interior features: Updated/remodeled interior; Furnished; Laminate countertops
- Laundry & utility: Washer included
Neighborhood map
What this means for you Summary
Snapshot
- This is a 1-bed/1.0-bath manufactured listed at $45k. Condition is rated fair.
Deal economics
- At list price, monthly cash flow is $1k ($15k/yr) — positive.
- The deal already cash-flows at list — no discount required.
- Meets the 1% rule at list price ($2k rent vs $45k).
- Cap rate 39.2% vs local median 2.5% in Santa Rosa — top-decile yield for the area; either an underpriced asset or a hidden risk that comps aren't pricing in. Stress-test before assuming the spread holds.
Location & tenants
- Location reads 75/100 on livability (#112 in CA, #3,940 nationally) — a middle-class / working-renter tenant base. Strengths: amenities A+, commute A+, employment A+; Watch: schools C-, cost of living F.
- Santa Rosa High (urban): math 31% / reading 47% proficiency, ranked #703 of 1,400 in CA (top 50%) — families likely to look elsewhere, expect single-tenant / working-renter base with shorter leases.
- Market conditions: Rents rising (+2.9%/yr); 120 active listings in the ZIP; 11 comparable units currently listed for rent nearby; rentals leasing fast (median 14d on market — plan ~1-2 weeks tenant-placement turnaround); solid renter incomes; 1,039 units permitted in Sonoma County in 2024 (185 in 5+ unit buildings).
Forward outlook
- Local home prices are declining (-3.0%/yr); year-one equity from $311 of loan paydown is wiped out by about $1k of value loss. Plan a longer hold.
- Sonoma County population projected at +8% by 2050 — modest demand growth; plan on rents tracking national, not racing it.
- At projected returns (-3.0% appreciation + 2.9% rent growth), your $13k cash investment doubles in ~1 year — after that, you're playing with house money.
Negotiation context
- Only 2 days on market — expect competitive offers; lowballing is unlikely to land.
Risks & watch-outs
- Climate carrying-cost: major wildfire risk — expect insurance premiums to compound above CPI over the hold.
Questions for the listing agent
- Have any recent inspections been done? Can we get a copy of the seller's disclosures and any deferred-maintenance estimates?
- Built in 1970 — when were the roof, HVAC, electrical panel, plumbing, and water heater last replaced?
- Is there a deadline driving the sale (1031 exchange, divorce, estate, relocation)? That informs how much negotiation room exists.
- The area grade is low — what's the realistic commute time and amenity access for the typical tenant pool here? Any planned neighborhood developments (good or bad) we should know about?
- What's the average days-on-market for RENTAL listings here right now (not sales)? A rising rental-DOM trend means longer vacancies and softer asking-rent achievability than the comps imply.
- What's the recent tenant-quality profile in this submarket — average credit score on applications, eviction rate, late-payment / NSF rate, and stable-employment percentage? A property-management company in the area should have these aggregated.
- How much new for-sale + rental construction is in the pipeline within 1–3 miles? Heavy new supply typically softens prices + rents 12–24 months out; constrained supply supports both.
Investment metrics
- 1% rule
- 4.35% ✓
- Cap rate
- 39.24%
- Cash-on-cash
- 117.66%
- DSCR
- 6.24
- GRM
- 1.9
CMA / ARV
- ARV (on-the-fly)
- $107,400
- Comps found
- 4
Show comp detail 4 sales within ~0.75 mi
| Address | Dist | Beds/Ba | Sqft | Sold | Price | $/sf | Match |
|---|---|---|---|---|---|---|---|
| 215 Apple Ln | 0.06mi | 1/1.0 | 624 (+4%) | 7mo | $32,000 | $51 | 85 |
| 115 Coachman Ln #19 | 0.51mi | 2/1.0 (+1) | 672 (+12%) | 8mo | $120,000 | $179 | 45 |
| 131 El Crystal Dr | 0.74mi | 2/1.0 (+1) | 640 (+7%) | 13mo | $122,500 | $191 | 39 |
| 141 North Star Dr Unit A | 0.69mi | 2/1.0 (+1) | 566 (-6%) | 24mo | $98,500 | $174 | 34 |
Match score weights: distance 35% · size 25% · config 20% · recency 20%. Top-matched comps best support the ARV.
Projected returns pro-forma
-3.0% appreciation · 2.93% rent growth · sell at horizon
- IRR
- —
- Equity multiple
- 6.66×
- Total profit
- $71,284
- Equity at exit
- $6,710
- IRR
- —
- Equity multiple
- 13.93×
- Total profit
- $162,947
- Equity at exit
- $3,891
Cash invested: $12,600 (down + closing). Projections, not guarantees.
Landlord ↔ Tenant lean methodology
- Overall (STATE)
- 18 Strongly Tenant-Friendly
- State California
- 18 Strongly Tenant-Friendly · D+13
- County
- — inherits STATE
- City
- — inherits STATE
ZIP-level market 95407
- Rents YoY
- 2.9%
- Active inventory
- 120
- Price-to-rent
- 1.9×
Monthly cashflow live
- Estimated rent
- $1,957 high interval (Pro) →
- Mortgage (P&I)
- −$236
- Tax est. 1.5%
- −$56 /mo · $675/yr
- Insurance
- −$19
- HOA
- −$0
- Vacancy / Maint / Mgmt
- −$411
- Net cashflow
- $1,235
Break-even live
UW: 25.0% down · 7.5% · 30yr · 1.5% tax · 5.0% vac · 8.0% maint · 8.0% mgmt
Financing live
Cash to close
- Down payment
- $11,250
- Closing costs
- $1,350
- Reserves months
- —
- Total cash needed
- —
Loan-product check · same deal, 3 products live
Conventional
25% down · 7.5% · 30yr
- Down + closing
- —
- Monthly P&I
- —
- Monthly cashflow
- —
- DSCR
- —
- Eligible?
- —
Personal DTI + credit; lowest rate.
DSCR
20% down · 8.5% · 30yr
- Down + closing
- —
- Monthly P&I
- —
- Monthly cashflow
- —
- DSCR
- —
- Eligible?
- —
No personal income docs; deal must DSCR.
Hard money
10% down · 12.0% · 12mo
- Down + closing
- —
- Monthly P&I
- —
- Monthly cashflow
- —
- DSCR
- —
- Eligible?
- —
Short-term bridge; refi at stabilization.
Rent comps 11 comps
| Address | Beds | Baths | Sqft | Rent | $/sqft | DOM | Units | Dist |
|---|---|---|---|---|---|---|---|---|
| 240 Burt St Santa Rosa, CA | 1.0–2.0 | 1.0–2.0 | 742 | $1,998 | $2.69 | 13d | 10 | 0.21mi |
| 1018 Bellevue Ave Santa Rosa, CA | 1.0–4.0 | 1.0–2.0 | 1010 | $1,604 | $1.59 | 13d | 1 | 0.46mi |
| 2146 Bedford St Unit 2134-211 Santa Rosa, CA | 1.0 | 1.0 | 720 | $2,075 | $2.88 | 13d | 1 | 0.72mi |
| 1020 Kawana Springs Rd Santa Rosa, CA | 1.0–3.0 | 1.0–2.0 | 890 | $2,171 | $2.44 | 13d | 27 | 0.72mi |
| 2146 Bedford St Santa Rosa, CA | 1.0 | 1.0 | 720 | $1,900 | $2.64 | 13d | 1 | 0.74mi |
| 2111 Kawana Springs Rd Santa Rosa, CA | 1.0–3.0 | 1.0–2.0 | 936 | $2,320 | $2.48 | 13d | 8 | 0.80mi |
| 147 Colgan Ave Santa Rosa, CA | 1.0–2.0 | 1.0 | 623 | $1,067 | $1.71 | 13d | 3 | 0.99mi |
| 1501 Patty Pl Unit 1591 Santa Rosa, CA | 2.0 | 2.0 | 747 | $2,500 | $3.35 | 13d | 1 | 1.02mi |
| 1501 Patty Pl Unit 1555 Santa Rosa, CA | 2.0 | 2.0 | 747 | $1,995 | $2.67 | 13d | 1 | 1.02mi |
| 2025 Applejack Way Santa Rosa, CA | 1.0 | 1.0 | 500 | $1,750 | $3.50 | 13d | 1 | 1.15mi |
| 777 Aston Ave Santa Rosa, CA | 1.0 | 1.0 | 635 | $1,749 | $2.75 | 13d | 1 | 1.21mi |
Listing history 3 events
-
2026-06-18days on market $45,000 Active 2 DOM
-
2026-06-17remarks 692-char remark
-
2026-06-17$45,000 Active 1 DOM
ⓘ Source: listings_history table (triggers on properties + properties_extension) + one-shot
backfill from property_details.listing_events for pre-trigger history.
Climate risk First Street
- Flood 1/10 Low FEMA zone X (unshaded) · 0% chance over 30 yrs
- Wildfire 6/10 Major
- Heat 4/10 Moderate 7 d/yr ≥92°F today · 16 d/yr by 30 yrs out
- Wind 1/10 Low
- Air quality 8/10 Severe 15 unhealthy d/yr today · 17 by 30 yrs out
Nearby sold comps map
Loading sold comps map…
Walkable amenities ~0.75 mi
Loading nearby amenities…
Taxation est. · year 1
- Rental income
- $23,490
- − Mortgage interest
- −$2,521
- − Property taxes
- −$675
- − Insurance
- −$225
- − Repairs & maintenance
- −$1,879
- − Management
- −$1,879
- − Depreciation
- −$1,309
- Taxable income
- $15,002
- Est. tax owed @ 24.0%
- −$3,600
- After-tax cash flow
- $11,225/yr
For passive investors: Depreciation is non-cash, so a rental often shows a tax loss while cash-flowing — sheltering income. Rental losses are passive: they offset passive income freely, and up to $25,000/yr can offset ordinary (W-2) income if you actively participate and your MAGI is under $100k (phasing out to $0 by $150k); unused losses carry forward. On sale, claimed depreciation is recaptured at up to 25%, and gains may owe capital-gains tax (a 1031 exchange can defer both). Figures are a year-1 estimate at your 24.0% rate — not tax advice; consult a CPA.
Condition & rehab AI · 12 photos
This single-wide mobile home requires moderate repairs and updates to improve its condition and value. The home is move-in ready with a good layout, but the exterior and interior need freshening up.
Repairs flagged
- Moderate exterior siding — Aged appearance
- Minor interior paint — Worn wood paneling
- Minor kitchen cabinets — Dated design
Value-add opportunities
- Both paint interior walls and cabinets — Fresh paint enhances curb appeal and interior aesthetics
- Both replace exterior siding — New siding improves curb appeal and structural integrity
- Both update kitchen cabinets — Modern cabinets increase functionality and value
Renovation cost estimate screening
| Repair item | Severity | Est. cost |
|---|---|---|
| exterior siding · Aged appearance | Moderate | $3,000–15,000 |
| interior paint · Worn wood paneling | Minor | $500–3,000 |
| kitchen cabinets · Dated design | Minor | $500–3,000 |
| Total estimated repair cost · 3 items | $4,000–21,000 |
Value-add ROI direction
- Both paint interior walls and cabinets — Fresh paint enhances curb appeal and interior aesthetics ↑
- Both replace exterior siding — New siding improves curb appeal and structural integrity ↑
- Both update kitchen cabinets — Modern cabinets increase functionality and value ↑
ⓘ Cost ranges are severity-bucket heuristics (US national rule-of-thumb). Get contractor quotes + a written scope before underwriting a rehab budget.
Schools (NCES district)
- District
- Santa Rosa High
- NCES district ID
- 0635830
- Math proficiency
- 31% —
- Reading proficiency
- 47% —
- Median HH income
- $62,000
- Composite
- 37.25/100
- National rank
- #8972
- State rank
- #703 of 1400 in CA
Livability — Santa Rosa
- Score
- 75/100
- State rank
- #112
- US rank
- #3940
Category grades
Schools grade is shown separately in the Schools card above.
Census & demographics
- County
- Sonoma County · 449,805 people
- City population
- 210,074
- Metro
- Santa Rosa-Petaluma, CA
- Population (ZIP)
- 42,036
- Household income
- $82,863
- Rent vs Own
- Severe rent burden
- 1943.0
Population outlook (Sonoma County) Hauer SSP2
- Today (2025)
- 539,935 people
- By 2030
- 554,870 · +2.8%
- By 2040
- 573,262 · +6.2%
- By 2050
- 580,715 · +7.6%
- By 2075
- 579,229 · +7.3%
- By 2100
- 547,835 · +1.5%
Race, ethnicity, and origin ACS 2023
- Neighborhood character
- Diverse neighborhood (Simpson 0.56)
- Race & ethnicity
- Hispanic / Latino 59% White 29% Two or more races 13% Asian 7% Black 2% Native American 1%
- Hispanic origin (detail)
- Mexican 50% Puerto Rican 1%
- Common ancestry
- Lithuanian 1% Romanian 1% Italian 1%
- Foreign-born
- 32% · Canada, Vietnam, China
- Languages at home
- 42% English-only · Spanish 50% Other Indo-European 2% Other Asian/Pacific 1%
Political lean MEDSL · Sonoma
- 2024 margin
- Solid D (+46.2) · D 71.4% · R 25.2% · Other 3.3%
- 2008→2024 swing
- -3.4pp toward R · 2008: 49.6pp · 2024: 46.2pp
- All cycles
- 2024: D+46.2 2020: D+51.5 2016: D+47.9 2012: D+44.9 2008: D+49.6
Not yet ingested
- Civics
- —
Market trends
- HPI YoY
- ▼ -852.74%
- Current HPI
- 256.4307
- Rent YoY
- ▲ 2.93%
- Metro
- Santa Rosa-Petaluma, CA
- State GDP YoY
- ▲ 3.21%
- F500 in state
- 116
Industry mix (Fortune 500 HQ in CA)
| Industry | F500 HQs | Revenue |
|---|---|---|
| Technology | 27 | $1,492B |
|
||
| Financial Services | 3 | $174B |
|
||
| Retail | 3 | $44B |
|
||
| Insurance | 3 | $26B |
|
||
| Media / Entertainment | 2 | $115B |
|
||
| Pharmaceuticals / Biotech | 2 | $62B |
|
||
Price history
1 event — show timeline
- 2026-06-16 Listed $45,000 BAREIS
Cash-flow waterfall
monthlySold comps — $/sqft
last 12 mo · ≤1 miLoading sold comps…