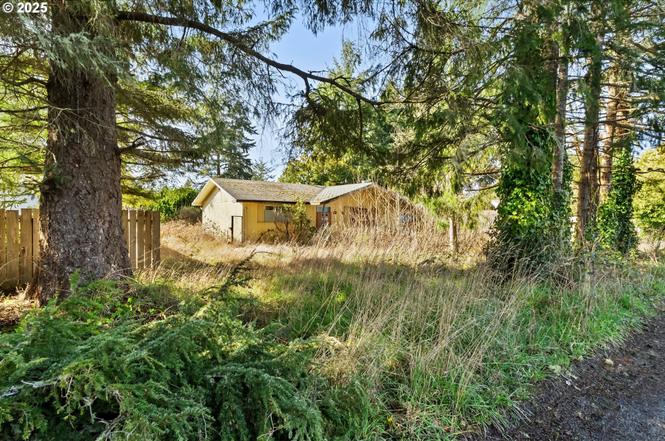
63528 S Olive Rd · Barview, OR
Flood risk 1/10 · Minimal
- FEMA flood zone
- X (unshaded)
- Chance of flooding over 30 yrs
- 0.0%
- Est. flood insurance / yr
- $507 – $1,088
Fire risk 1/10 · Minimal
- Est. fire insurance / yr
- $498 – $926
Heat risk 1/10 · Minimal
- Hot days now (above 73°F)
- 8 days/yr
- Hot days in 30 yrs
- 25 days/yr
Wind risk 1/10 · Minimal
- Chance of severe wind over 30 yrs
- —
Air-quality risk 6/10 · Moderate
- Unhealthy air days now
- 8 days/yr
- Unhealthy air days in 30 yrs
- 8 days/yr
Risk factors via First Street. Map © Google.
Why this score? — see what drove the B grade
The composite is a weighted blend of 9 inputs, each scored 0–100. Each bar is that input's sub-score; the figure is the points it added to the 100-point composite (weight × sub-score).
- Cash flow +30.0/30.0
- 1% rule +10.0/10.0
- DSCR +10.0/10.0
- ARV discount +7.5/15.0
- Rent growth +4.7/5.0
- Livability +3.2/5.0
- Schools +2.5/10.0
- Condition / age +2.5/5.0
- Appreciation +0.0/10.0
$119,900
🖨 Deal sheet (PDF) 📄 Offer letter ✓ Due diligence
Listing remarks
Charming Coastal Heavy Fixer or Tear Down With Endless Potential! Set among the trees and just three blocks from the stunning Pacific Ocean, this 3-bedroom, 1-bath home is full of possibilities. Set on a spacious 0.18-acre lot, there’s room for expansion or even an ADU to maximize its value. Enjoy the convenience of public water and sewer, a tank water heater, and a prime location just minutes from local restaurants, parks, and outdoor coastal adventures. The marina docks are only five minutes away where you can enjoy crabbing and beautiful scenery! Whether you're dreaming of a cozy coastal getaway or seeking an investment opportunity, this property is full of potential. Bring your vi
Key facts
- Public sewer
- Spacious lot
- Local restaurants
Tags
Neighborhood map
What this means for you Summary
Snapshot
- This is a 3-bed/1.0-bath single-family listed at $120k.
Deal economics
- At list price, monthly cash flow is $718 ($9k/yr) — positive.
- The deal already cash-flows at list — no discount required.
- Meets the 1% rule at list price ($2k rent vs $120k).
- Recommended offer: $118k (1.5% below list) — sets the bar for market timing.
Location & tenants
- Location reads 63/100 on livability (#230 in OR) — a middle-class / working-renter tenant base. Strengths: cost of living A+, housing A+, crime A; Watch: health & safety C-, employment D+, amenities F.
- Coos Bay SD 9 (town): math 22% / reading 39% proficiency, ranked #45 of 58 in OR (top 78%) — families likely to look elsewhere, expect single-tenant / working-renter base with shorter leases.
- Zoned schools: Madison Elementary School (295 students, 69% FRL); Marshfield Senior High School (math 17% / reading 54%, grade F, #89 of 143 statewide, top 62%, 835 students, 31% FRL) — zoned schools at 50% FRL track the district average.
- Market conditions: Rents rising fast (+8.7%/yr); 344 active listings in the ZIP; 122 units permitted in Coos County in 2024 (16 in 5+ unit buildings).
- This rent runs 38% of the median local income ($62k/yr) — at the standard rent-burdened threshold; future hikes will face affordability resistance.
Forward outlook
- Local home prices are declining (-3.0%/yr); year-one equity from $829 of loan paydown is wiped out by about $4k of value loss. Plan a longer hold.
- Coos County population projected to shrink 9% by 2050 — rents likely to lag national; underwrite the cash flow, not the appreciation.
- At projected returns (-3.0% appreciation + 8.0% rent growth), your $34k cash investment doubles in ~5 years — after that, you're playing with house money.
Negotiation context
- It's been on market 18 days — a 2% lower offer ($118k) is reasonable based on typical stale-listing flexibility.
- 3 sale attempts with the ask held roughly flat each time — persistent listings suggest the price (not the market) is what's stuck; bring a comps-based counter.
Questions for the listing agent
- Built in 1976 — when were the roof, HVAC, electrical panel, plumbing, and water heater last replaced?
- Is there a deadline driving the sale (1031 exchange, divorce, estate, relocation)? That informs how much negotiation room exists.
- Schools are F-rated, which usually means shorter tenancies and higher turnover. Who's the typical renter profile here, and what's been the actual vacancy rate?
- What's the average days-on-market for RENTAL listings here right now (not sales)? A rising rental-DOM trend means longer vacancies and softer asking-rent achievability than the comps imply.
- What's the recent tenant-quality profile in this submarket — average credit score on applications, eviction rate, late-payment / NSF rate, and stable-employment percentage? A property-management company in the area should have these aggregated.
- How much new for-sale + rental construction is in the pipeline within 1–3 miles? Heavy new supply typically softens prices + rents 12–24 months out; constrained supply supports both.
Investment metrics
- 1% rule
- 1.64% ✓
- Cap rate
- 13.48%
- Cash-on-cash
- 25.67%
- DSCR
- 2.14
- GRM
- 5.1
CMA / ARV
- ARV (on-the-fly)
- $393,328
- Comps found
- 4
Show comp detail 4 sales within ~0.75 mi
| Address | Dist | Beds/Ba | Sqft | Sold | Price | $/sf | Match |
|---|---|---|---|---|---|---|---|
| 90851 Travis Ln | 0.38mi | 2/1.0 (-1) | 1,008 (+3%) | 10mo | $85,000 | $84 | 64 |
| 90821 Sand Dollar Ln | 0.25mi | 2/2.0 (-1) | 912 (-7%) | 10mo | $369,000 | $405 | 60 |
| 63850 N Barview Rd | 0.64mi | 3/2.0 | 936 (-4%) | 10mo | $377,000 | $403 | 51 |
| 90853 Travis Ln | 0.39mi | 3/2.0 | 1,050 (+8%) | 20mo | $110,000 | $105 | 49 |
Match score weights: distance 35% · size 25% · config 20% · recency 20%. Top-matched comps best support the ARV.
Projected returns pro-forma
-3.0% appreciation · 8.0% rent growth · sell at horizon
- IRR
- 24.9%
- Equity multiple
- 2.09×
- Total profit
- $36,712
- Equity at exit
- $17,877
- IRR
- 35.6%
- Equity multiple
- 5.12×
- Total profit
- $138,213
- Equity at exit
- $10,367
Cash invested: $33,572 (down + closing). Projections, not guarantees.
Landlord ↔ Tenant lean methodology
- Overall (STATE)
- 28 Tenant-Leaning
- State Oregon
- 28 Tenant-Leaning · D+6
- County
- — inherits STATE
- City
- — inherits STATE
ZIP-level market 97420
- Rents YoY
- 8.7%
- Active inventory
- 344
- Price-to-rent
- 5.1×
Monthly cashflow live
- Estimated rent
- $1,963 medium interval (Pro) →
- Mortgage (P&I)
- −$629
- Tax from tax record
- −$154 /mo · $1,851/yr
- Insurance
- −$50
- HOA
- −$0
- Vacancy / Maint / Mgmt
- −$412
- Net cashflow
- $718
Break-even live
Sensitivity live
| Price | -10% $786 | -5% $752 | +0% $718 | +5% $684 | +10% $650 |
|---|---|---|---|---|---|
| Rent | -10% $563 | -5% $641 | +0% $718 | +5% $796 | +10% $873 |
| Rate | -1.0pp $778 | -0.5pp $749 | base $718 | +0.5pp $687 | +1.0pp $655 |
UW: 25.0% down · 7.5% · 30yr · 1.5% tax · 5.0% vac · 8.0% maint · 8.0% mgmt
Financing live
Cash to close
- Down payment
- $29,975
- Closing costs
- $3,597
- Reserves months
- —
- Total cash needed
- —
Loan-product check · same deal, 3 products live
Conventional
25% down · 7.5% · 30yr
- Down + closing
- —
- Monthly P&I
- —
- Monthly cashflow
- —
- DSCR
- —
- Eligible?
- —
Personal DTI + credit; lowest rate.
DSCR
20% down · 8.5% · 30yr
- Down + closing
- —
- Monthly P&I
- —
- Monthly cashflow
- —
- DSCR
- —
- Eligible?
- —
No personal income docs; deal must DSCR.
Hard money
10% down · 12.0% · 12mo
- Down + closing
- —
- Monthly P&I
- —
- Monthly cashflow
- —
- DSCR
- —
- Eligible?
- —
Short-term bridge; refi at stabilization.
Listing history 7 events
-
2025-06-23status Pending
-
2025-06-23status Active
-
2025-03-25status Pending
-
2025-03-25status Pending
-
2025-03-24historical
-
2025-03-07$119,900 Active
-
2025-03-07$119,900 Active
ⓘ Source: listings_history table (triggers on properties + properties_extension) + one-shot
backfill from property_details.listing_events for pre-trigger history.
Tax reassessment forecast OR · Resets to sale price
- Current annual tax
- $1,851 · $154/mo
- Projected year-2 tax
- $1,851 · $154/mo
- Expected delta
- $0/yr ($0/mo · 0.0%)
ⓘ Screening estimate from a state-policy table — verify with the county assessor before closing.
Climate risk First Street
- Flood 1/10 Low FEMA zone X (unshaded) · 0% chance over 30 yrs
- Wildfire 1/10 Low
- Heat 1/10 Low 8 d/yr ≥73°F today · 25 d/yr by 30 yrs out
- Wind 1/10 Low
- Air quality 6/10 Major 8 unhealthy d/yr today · 8 by 30 yrs out
Nearby sold comps map
Loading sold comps map…
Walkable amenities ~0.75 mi
Loading nearby amenities…
Taxation est. · year 1
- Rental income
- $23,560
- − Mortgage interest
- −$6,716
- − Property taxes
- −$1,851
- − Insurance
- −$600
- − Repairs & maintenance
- −$1,885
- − Management
- −$1,885
- − Depreciation
- −$3,488
- Taxable income
- $7,136
- Est. tax owed @ 24.0%
- −$1,713
- After-tax cash flow
- $6,904/yr
For passive investors: Depreciation is non-cash, so a rental often shows a tax loss while cash-flowing — sheltering income. Rental losses are passive: they offset passive income freely, and up to $25,000/yr can offset ordinary (W-2) income if you actively participate and your MAGI is under $100k (phasing out to $0 by $150k); unused losses carry forward. On sale, claimed depreciation is recaptured at up to 25%, and gains may owe capital-gains tax (a 1031 exchange can defer both). Figures are a year-1 estimate at your 24.0% rate — not tax advice; consult a CPA.
Schools (NCES district)
- District
- Coos Bay SD 9
- NCES district ID
- 4103660
- Math proficiency
- 22% ▼ -6.00%
- Reading proficiency
- 39% ▼ -4.00%
- Median HH income
- $38,630
- Composite
- 25.46/100
- National rank
- #7450
- State rank
- #45 of 58 in OR
Livability — Barview
- Score
- 63/100
- State rank
- #230
- US rank
- #15585
Category grades
Schools grade is shown separately in the Schools card above.
Census & demographics
- Census place
- Barview, OR
- County
- Coos County · 27,621 people
- Metro
- Coos Bay, OR
- Population (ZIP)
- 27,621
- Household income
- $61,574
- Rent vs Own
- Severe rent burden
- 799.0
Population outlook (Coos County) Hauer SSP2
- Today (2025)
- 62,222 people
- By 2030
- 61,120 · -1.8%
- By 2040
- 58,478 · -6.0%
- By 2050
- 56,819 · -8.7%
- By 2075
- 54,915 · -11.7%
- By 2100
- 51,403 · -17.4%
Race, ethnicity, and origin ACS 2023
- Neighborhood character
- Predominantly White (81%)
- Race & ethnicity
- White 81% Hispanic / Latino 10% Two or more races 8% Native American 2% Asian 1%
- Hispanic origin (detail)
- Mexican 7%
- Common ancestry
- Italian 5% Slovak 3% Lithuanian 3%
- Foreign-born
- 5% · Canada, Vietnam
- Languages at home
- 92% English-only · Spanish 6%
Political lean MEDSL · Coos
- 2024 margin
- R (+19.9) · D 38.7% · R 58.5% · Other 2.8%
- 2008→2024 swing
- -16.8pp toward R · 2008: -3.1pp · 2024: -19.9pp
- All cycles
- 2024: R+19.9 2020: R+20.5 2016: R+24.3 2012: R+6.3 2008: R+3.1
Not yet ingested
- Civics
- —
Market trends
- HPI YoY
- ▼ -315.58%
- Current HPI
- 198.3249
- Rent YoY
- ▲ 8.65%
- Metro
- Coos Bay, OR
- State GDP YoY
- ▲ 2.05%
- F500 in state
- 2
Industry mix (Fortune 500 HQ in OR)
| Industry | F500 HQs | Revenue |
|---|---|---|
| Consumer Goods | 1 | $51B |
|
||
Price history
+0.0% since first listed7 events — show timeline
- 2025-06-23 Pending — RMLS
- 2025-06-23 Relisted — RMLS
- 2025-03-25 Pending — MLSCO
- 2025-03-25 Pending — RMLS
- 2025-03-24 Listing Removed — MLSCO
- 2025-03-07 Listed $119,900 MLSCO
- 2025-03-07 Listed $119,900 RMLS
Property tax history
+4.7%/yrLatest (2025): $1,851 · +1.2% YoY. Source: county tax records.
Cash-flow waterfall
monthlySold comps — $/sqft
last 12 mo · ≤1 miLoading sold comps…