2840 S Circle Dr #818 · Colorado Springs, CO
Flood risk 4/10 · Minor
- FEMA flood zone
- X (shaded)
- Chance of flooding over 30 yrs
- 0.22%
- Est. flood insurance / yr
- $507 – $1,088
Fire risk 1/10 · Minimal
- Est. fire insurance / yr
- $939 – $1,743
Heat risk 3/10 · Minor
- Hot days now (above 90°F)
- 7 days/yr
- Hot days in 30 yrs
- 20 days/yr
Wind risk 2/10 · Minimal
- Chance of severe wind over 30 yrs
- —
Air-quality risk 1/10 · Minimal
- Unhealthy air days now
- 0 days/yr
- Unhealthy air days in 30 yrs
- 0 days/yr
Risk factors via First Street. Map © Google.
Why this score? — see what drove the B- grade
The composite is a weighted blend of 9 inputs, each scored 0–100. Each bar is that input's sub-score; the figure is the points it added to the 100-point composite (weight × sub-score).
- Cash flow +30.0/30.0
- 1% rule +10.0/10.0
- DSCR +10.0/10.0
- ARV discount +7.5/15.0
- Livability +3.9/5.0
- Condition / age +2.5/5.0
- Rent growth +2.4/5.0
- Schools +2.1/10.0
- Appreciation +0.0/10.0
$49,900
🖨 Deal sheet 📄 Offer letter ✓ Due diligence
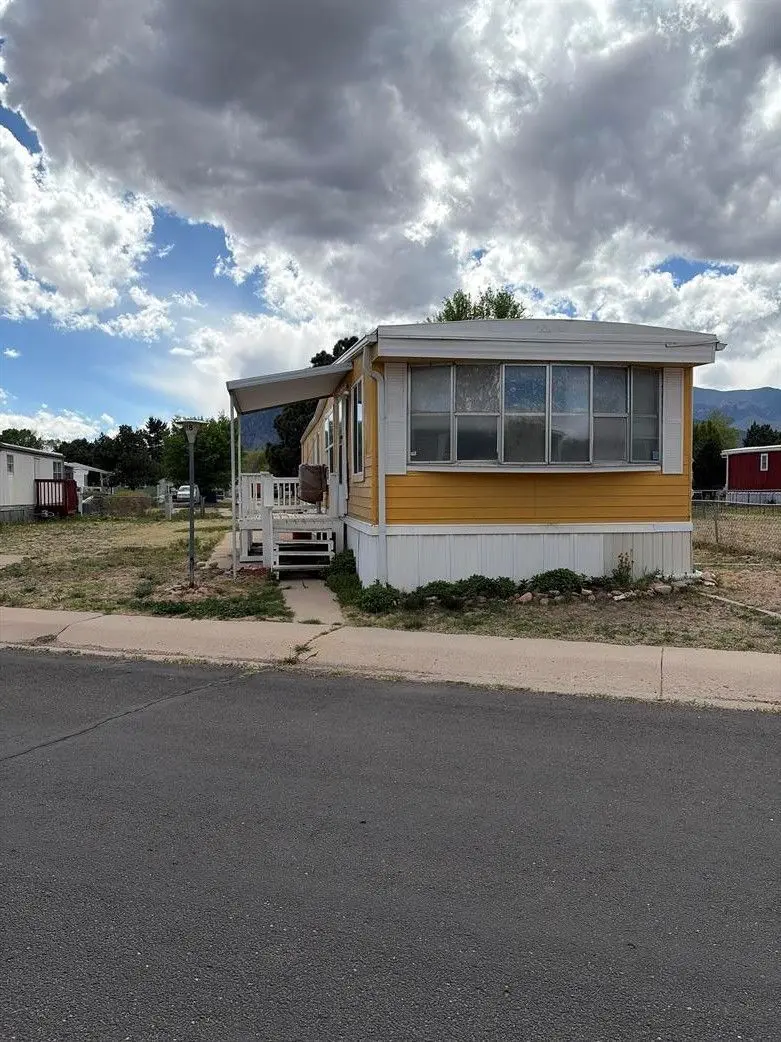
Listing remarks
Bring your vision to this vintage 1976 MARSHFIELD home at Circle Drive in Colorado Springs, CO. With 924 square feet and a practical single-wide layout, this retro fixer-upper is a great opportunity for a handyman, investor, or buyer looking for a project with potential. This home offers classic character and room for updates, making it ideal for someone ready to renovate and customize the space. Located at 2840 S Circle Dr, Lot 818, in the Circle Drive community of Colorado Springs, this affordable home is priced at $49,900 and is ready for its next chapter.
Key facts
- Built 2026
- Listed 41 days
Property features AI
Finance
- Other: Status: Active; Listing last modified 2026-05-08
- Financial info: List price $49,900
Exterior
- Home design: Spec inventory, Marshfield plan
- Exterior features: Located at 2840 S Circle Dr #818, Colorado Springs, CO 80906
Interior
- Bedrooms: 2 bedrooms
- Bathrooms: 1 bathroom
- Heating & cooling: Forced air heating; Other heating
- Interior features: Living area approximately 924
Neighborhood map
What this means for you Summary
Snapshot
- This is a 2-bed/1.0-bath manufactured listed at $50k.
Deal economics
- At list price, monthly cash flow is $867 ($10k/yr) — positive.
- The deal already cash-flows at list — no discount required.
- Meets the 1% rule at list price ($2k rent vs $50k).
- Recommended offer: $48k (3.0% below list) — sets the bar for market timing.
- Cap rate 27.1% vs local median 3.3% in Colorado Springs — top-decile yield for the area; either an underpriced asset or a hidden risk that comps aren't pricing in. Stress-test before assuming the spread holds.
Location & tenants
- Location reads 78/100 on livability (#23 in CO, #2,639 nationally) — a middle-class / working-renter tenant base. Strengths: amenities A+, housing A+, health & safety A+; Watch: cost of living C-, crime F.
- Harrison School District No. 2 In The County Of El Paso An (urban): math 16% / reading 35% proficiency, ranked #67 of 86 in CO (top 78%) — low school quality limits family demand, transient renter base, plan for 1-2y turnover; 62% free/reduced lunch — lower-income household profile, screen leases tightly.
- Market conditions: Rents soft (-0.4%/yr); 300 active listings in the ZIP; 30 comparable units currently listed for rent nearby; rentals at typical pace (median 14d on market — plan ~3-4 weeks tenant-placement turnaround); solid renter incomes; 3,906 units permitted in El Paso County in 2024 (872 in 5+ unit buildings).
Forward outlook
- Local home prices are declining (-3.0%/yr); year-one equity from $345 of loan paydown is wiped out by about $1k of value loss. Plan a longer hold.
- El Paso County population projected at +28% by 2050 — long-run rental-demand tailwind backs the buy-and-hold thesis.
- At projected returns (-3.0% appreciation + 0.0% rent growth), your $14k cash investment doubles in ~2 years — after that, you're playing with house money.
Negotiation context
- It's been on market 41 days — a 3% lower offer ($48k) is reasonable based on typical stale-listing flexibility.
Questions for the listing agent
- It's been on market 41 days. Have you received any prior offers? Is the seller open to a 3% concession, seller financing, or rate buy-down credit?
- Is there a deadline driving the sale (1031 exchange, divorce, estate, relocation)? That informs how much negotiation room exists.
- Schools are B-rated — typically a magnet for longer-tenancy family renters. What's the average tenant stay here, and is there a school-zone premium baked into asking?
- Crime grade is F in this area — have there been break-ins, vandalism, or insurance claims at this property in the last 3 years? What carrier currently insures it and at what premium?
- What's the average days-on-market for RENTAL listings here right now (not sales)? A rising rental-DOM trend means longer vacancies and softer asking-rent achievability than the comps imply.
- What's the recent tenant-quality profile in this submarket — average credit score on applications, eviction rate, late-payment / NSF rate, and stable-employment percentage? A property-management company in the area should have these aggregated.
- How much new for-sale + rental construction is in the pipeline within 1–3 miles? Heavy new supply typically softens prices + rents 12–24 months out; constrained supply supports both.
Investment metrics
- 1% rule
- 3.07% ✓
- Cap rate
- 27.15%
- Cash-on-cash
- 74.48%
- DSCR
- 4.31
- GRM
- 2.7
CMA / ARV
No comps found within radius.
Projected returns pro-forma
-3.0% appreciation · 0.0% rent growth · sell at horizon
- IRR
- 70.9%
- Equity multiple
- 4.05×
- Total profit
- $42,670
- Equity at exit
- $7,440
- IRR
- 74.0%
- Equity multiple
- 7.51×
- Total profit
- $90,990
- Equity at exit
- $4,314
Cash invested: $13,972 (down + closing). Projections, not guarantees.
Landlord ↔ Tenant lean methodology
- Overall (STATE)
- 38 Tenant-Leaning
- State Colorado
- 38 Tenant-Leaning · D+4
- County
- — inherits STATE
- City
- — inherits STATE
ZIP-level market 80906
- Rents YoY
- -0.4%
- Active inventory
- 300
- Price-to-rent
- 2.7×
Monthly cashflow live
- Estimated rent
- $1,534 high interval (Pro) →
- Mortgage (P&I)
- −$262
- Tax est. 1.5%
- −$62 /mo · $748/yr
- Insurance
- −$21
- HOA
- −$0
- Vacancy / Maint / Mgmt
- −$322
- Net cashflow
- $867
Break-even live
UW: 25.0% down · 7.5% · 30yr · 1.5% tax · 5.0% vac · 8.0% maint · 8.0% mgmt
Financing live
Cash to close
- Down payment
- $12,475
- Closing costs
- $1,497
- Reserves months
- —
- Total cash needed
- —
Loan-product check · same deal, 3 products live
Conventional
25% down · 7.5% · 30yr
- Down + closing
- —
- Monthly P&I
- —
- Monthly cashflow
- —
- DSCR
- —
- Eligible?
- —
Personal DTI + credit; lowest rate.
DSCR
20% down · 8.5% · 30yr
- Down + closing
- —
- Monthly P&I
- —
- Monthly cashflow
- —
- DSCR
- —
- Eligible?
- —
No personal income docs; deal must DSCR.
Hard money
10% down · 12.0% · 12mo
- Down + closing
- —
- Monthly P&I
- —
- Monthly cashflow
- —
- DSCR
- —
- Eligible?
- —
Short-term bridge; refi at stabilization.
Rent comps 30 comps
| Address | Beds | Baths | Sqft | Rent | $/sqft | DOM | Units | Dist |
|---|---|---|---|---|---|---|---|---|
| 2115 Birmingham Loop Colorado Springs, CO | 1.0–3.0 | 1.0–2.0 | 923 | $1,920 | $2.08 | 2d | 24 | 0.48mi |
| 1836 Ralphs Rdg Colorado Springs, CO | 1.0–2.0 | 1.0–2.0 | 702 | $1,566 | $2.23 | 2d | 10 | 0.61mi |
| 1316 Harrison Rd Colorado Springs, CO | 3.0 | 1.0 | 894 | $1,595 | $1.78 | 21d | 1 | 0.63mi |
| 1535 Monterey Rd #230 Colorado Springs, CO | 2.0 | 1.0 | 1008 | $1,550 | $1.54 | 23d | 1 | 0.79mi |
| 2218 Carmel Dr Colorado Springs, CO | 3.0 | 1.0 | 1000 | $1,950 | $1.95 | 23d | 1 | 0.79mi |
| 2049 Legacy Ridge Vw Colorado Springs, CO | 2.0 | 1.0 | 944 | $1,335 | $1.41 | 14d | 1 | 0.82mi |
| 2102 Carmel Dr Colorado Springs, CO | 1.0 | 1.0 | 548 | $749 | $1.37 | 23d | 1 | 0.84mi |
| 1810 Eldorado Springs Hts Colorado Springs, CO | 1.0–3.0 | 1.0–2.0 | 1081 | $2,398 | $2.22 | 2d | 14 | 0.85mi |
| 2010 Carmel Dr Colorado Springs, CO | 1.0–2.0 | 1.0 | 701 | $850 | $1.21 | 10d | 4 | 0.88mi |
| 2050 Del Mar Dr Colorado Springs, CO | 3.0 | 1.0 | 912 | $2,095 | $2.30 | 23d | 1 | 0.89mi |
| 1806 Monterey Rd Ste Off Colorado Springs, CO | 2.0 | 1.0 | 661 | $1,169 | $1.77 | 2d | 20 | 0.98mi |
| 1751 Shenandoah Dr Colorado Springs, CO | 2.0 | 1.5 | 960 | $1,015 | $1.06 | 23d | 1 | 1.05mi |
| 916 Tenderfoot Hill Rd Colorado Springs, CO | 2.0 | 2.0 | 908 | $1,822 | $2.01 | 14d | 1 | 1.08mi |
| 848 Tenderfoot Hill Rd Colorado Springs, CO | 2.0 | 2.0 | 908 | $1,395 | $1.54 | 23d | 1 | 1.16mi |
| 814 Tenderfoot Hill Rd #201 Colorado Springs, CO | 2.0 | 2.0 | 908 | $1,295 | $1.43 | 2d | 1 | 1.17mi |
| 2005 S El Paso Ave Colorado Springs, CO | 2.0 | 1.0 | 570 | $1,260 | $2.21 | 2d | 9 | 1.18mi |
| 2335 CoralBell Grv Colorado Springs, CO | 1.0–3.0 | 1.0–2.0 | 997 | $2,048 | $2.05 | 23d | 34 | 1.28mi |
| 2335 CoralBell Grv Colorado Springs, CO | 2.0–3.0 | 1.0–2.0 | 1004 | $1,695 | $1.69 | 2d | 7 | 1.28mi |
| 945 Moorings Dr Colorado Springs, CO | 2.0 | 2.0 | 984 | $1,712 | $1.74 | 23d | 1 | 1.29mi |
| 2605 Verde Dr Colorado Springs, CO | 1.0–2.0 | 1.0 | 722 | $1,190 | $1.65 | 2d | 15 | 1.30mi |
| 3308 Quail Lake Rd Colorado Springs, CO | 1.0–2.0 | 1.0–2.0 | 943 | $1,909 | $2.02 | 2d | 1 | 1.32mi |
| 1698 Lenmar Dr Colorado Springs, CO | 1.0–3.0 | 1.0 | 700 | $1,302 | $1.86 | 2d | 26 | 1.33mi |
| 750 E Cheyenne Rd Colorado Springs, CO | 1.0–2.0 | 1.0 | 610 | $1,175 | $1.93 | 23d | 5 | 1.38mi |
| 1117 Verde Dr Colorado Springs, CO | 2.0 | 1.0 | 714 | $1,065 | $1.49 | 2d | 18 | 1.39mi |
| 2730 Bentley Pt Colorado Springs, CO | 1.0–2.0 | 1.0–2.0 | 715 | $1,111 | $1.55 | 23d | 8 | 1.40mi |
| 1026 Rice Dr Colorado Springs, CO | 3.0 | 1.0 | 640 | $1,341 | $2.10 | 10d | 27 | 1.41mi |
| 2330 E Fountain Blvd Unit 37 Colorado Springs, CO | 1.0 | 1.0 | 640 | $950 | $1.48 | 23d | 1 | 1.45mi |
| 2610 E Fountain Blvd Colorado Springs, CO | 1.0–2.0 | 1.0 | 767 | $1,099 | $1.43 | 3d | 5 | 1.47mi |
| 890 Quail Lake Cir Colorado Springs, CO | 1.0–3.0 | 1.0–2.0 | 1147 | $1,798 | $1.57 | 2d | 21 | 1.48mi |
| 2614 E Fountain Blvd Colorado Springs, CO | 2.0 | 1.0 | 875 | $1,062 | $1.21 | 23d | 1 | 1.48mi |
Listing history 15 events
-
2026-06-18days on market $49,900 Active 41 DOM
-
2026-06-17days on market $49,900 Active 40 DOM
-
2026-06-16days on market $49,900 Active 39 DOM
-
2026-06-15days on market $49,900 Active 38 DOM
-
2026-06-14days on market $49,900 Active 36 DOM
-
2026-06-13days on market $49,900 Active 35 DOM
-
2026-06-10days on market $49,900 Active 33 DOM
-
2026-06-09days on market $49,900 Active 32 DOM
-
2026-06-08days on market $49,900 Active 31 DOM
-
2026-06-07days on market $49,900 Active 30 DOM
-
2026-06-05days on market $49,900 Active 27 DOM
-
2026-06-03days on market $49,900 Active 26 DOM
-
2026-06-03days on market $49,900 Active 25 DOM
-
2026-06-01days on market $49,900 Active 24 DOM
-
2026-05-31days on market $49,900 Active 23 DOM
ⓘ Source: listings_history table (triggers on properties + properties_extension) + one-shot
backfill from property_details.listing_events for pre-trigger history.
Climate risk First Street
- Flood 4/10 Moderate FEMA zone X (shaded) · 22% chance over 30 yrs
- Wildfire 1/10 Low
- Heat 3/10 Moderate 7 d/yr ≥90°F today · 20 d/yr by 30 yrs out
- Wind 2/10 Low
- Air quality 1/10 Low 0 unhealthy d/yr today · 0 by 30 yrs out
Nearby sold comps map
Loading sold comps map…
Walkable amenities ~0.75 mi
Loading nearby amenities…
Taxation est. · year 1
- Rental income
- $18,410
- − Mortgage interest
- −$2,795
- − Property taxes
- −$748
- − Insurance
- −$250
- − Repairs & maintenance
- −$1,473
- − Management
- −$1,473
- − Depreciation
- −$1,452
- Taxable income
- $10,220
- Est. tax owed @ 24.0%
- −$2,453
- After-tax cash flow
- $7,953/yr
For passive investors: Depreciation is non-cash, so a rental often shows a tax loss while cash-flowing — sheltering income. Rental losses are passive: they offset passive income freely, and up to $25,000/yr can offset ordinary (W-2) income if you actively participate and your MAGI is under $100k (phasing out to $0 by $150k); unused losses carry forward. On sale, claimed depreciation is recaptured at up to 25%, and gains may owe capital-gains tax (a 1031 exchange can defer both). Figures are a year-1 estimate at your 24.0% rate — not tax advice; consult a CPA.
Schools (NCES district)
- District
- Harrison School District No. 2 In The County Of El Paso An
- NCES district ID
- 0804530
- Math proficiency
- 16% ▼ -13.00%
- Reading proficiency
- 35% ▼ -7.00%
- Median HH income
- $40,242
- Composite
- 21.47/100
- National rank
- #8333
- State rank
- #67 of 86 in CO
Livability — Colorado Springs
- Score
- 78/100
- State rank
- #23
- US rank
- #2639
Category grades
Schools grade is shown separately in the Schools card above.
Census & demographics
- County
- El Paso County · 689,348 people
- City population
- 555,783
- Metro
- Colorado Springs, CO
- Population (ZIP)
- 37,502
- Household income
- $89,984
- Rent vs Own
- Severe rent burden
- 1572.0
Population outlook (El Paso County) Hauer SSP2
- Today (2025)
- 768,926 people
- By 2030
- 815,739 · +6.1%
- By 2040
- 903,489 · +17.5%
- By 2050
- 981,204 · +27.6%
- By 2075
- 1,155,542 · +50.3%
- By 2100
- 1,202,070 · +56.3%
Race, ethnicity, and origin ACS 2023
- Neighborhood character
- Predominantly White (70%)
- Race & ethnicity
- White 70% Hispanic / Latino 18% Two or more races 11% Black 4% Asian 3% Native American 1%
- Hispanic origin (detail)
- Mexican 8% Puerto Rican 2%
- Common ancestry
- Italian 3% Romanian 3% Slovak 3%
- Foreign-born
- 7% · Canada, South Korea, Vietnam
- Languages at home
- 89% English-only · Spanish 6% Russian/Polish/Slavic 1% German/W. Germanic 1%
Political lean MEDSL · El Paso
- 2024 margin
- Lean R (+9.8) · D 43.8% · R 53.5% · Other 2.7%
- 2008→2024 swing
- +9.0pp toward D · 2008: -18.8pp · 2024: -9.8pp
- All cycles
- 2024: R+9.8 2020: R+10.8 2016: R+22.6 2012: R+21.4 2008: R+18.8
Not yet ingested
- Civics
- —
Market trends
- HPI YoY
- ▼ -272.61%
- Current HPI
- 248.2125
- Rent YoY
- ▼ -0.43%
- Metro
- Colorado Springs, CO
- State GDP YoY
- ▲ 1.95%
- F500 in state
- 14
Industry mix (Fortune 500 HQ in CO)
| Industry | F500 HQs | Revenue |
|---|---|---|
| Technology Distribution | 1 | $31B |
|
||
| Food / Agriculture | 1 | $18B |
|
||
| Packaging | 1 | $14B |
|
||
| Healthcare | 1 | $13B |
|
||
| Energy | 1 | $10B |
|
||
| Technology | 1 | $4B |
|
||
Cash-flow waterfall
monthlySold comps — $/sqft
last 12 mo · ≤1 miLoading sold comps…